Free Access
Fig. 2
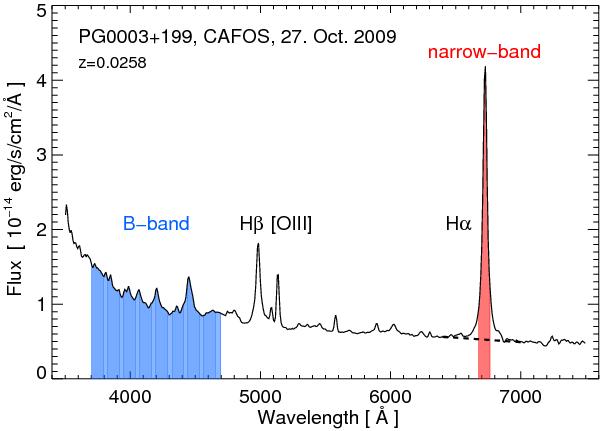
Observed spectrum of PG0003+199. The B-band (blue shaded) traces essentially the AGN continuum, while the narrow-band (red shaded) is dominated by the Hα line. The blue and red shaded areas are a schematic illustration, and quantitative calculations were made using the transmission curves shown in Fig. 1.
Current usage metrics show cumulative count of Article Views (full-text article views including HTML views, PDF and ePub downloads, according to the available data) and Abstracts Views on Vision4Press platform.
Data correspond to usage on the plateform after 2015. The current usage metrics is available 48-96 hours after online publication and is updated daily on week days.
Initial download of the metrics may take a while.