Fig. 7
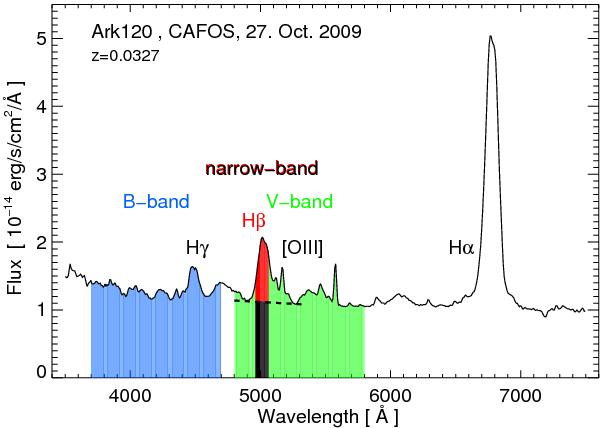
Observed spectrum of Ark 120. The B-band (blue shaded) traces the AGN (and host) continuum and a small (<5%) contribution by Hγ. The V-band (green shaded) traces the continuum and a small (<15%) contribution by Hβ. The narrow-band traces the continuum (black shaded) and Hβ (red shaded), each component contributing to about 50% to the band pass. The red wing of Hβ extending beyond [OIII] is neither seen in Hα nor in Hγ and could be due to Fe lines (Korista 1992). For the effective transmission curves of B and V see Fig. 1.
Current usage metrics show cumulative count of Article Views (full-text article views including HTML views, PDF and ePub downloads, according to the available data) and Abstracts Views on Vision4Press platform.
Data correspond to usage on the plateform after 2015. The current usage metrics is available 48-96 hours after online publication and is updated daily on week days.
Initial download of the metrics may take a while.