Fig. 10
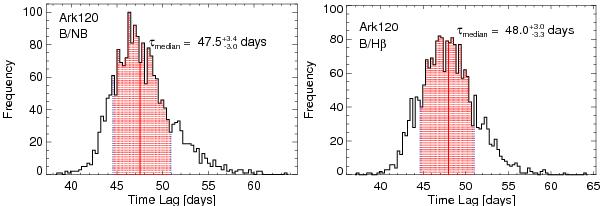
FR/RSS cross correlation results of Ark 120. left: B and NB, right: B and synthetic Hβ. Each histogram shows the distribution of τcent obtained by cross-correlating 2000 flux randomised and randomly selected subset light curves. The median of this distribution is taken as lag τcent. The red shaded area marks the 68% confidence range used to calculate the errors of τcent.
Current usage metrics show cumulative count of Article Views (full-text article views including HTML views, PDF and ePub downloads, according to the available data) and Abstracts Views on Vision4Press platform.
Data correspond to usage on the plateform after 2015. The current usage metrics is available 48-96 hours after online publication and is updated daily on week days.
Initial download of the metrics may take a while.