| Issue |
A&A
Volume 530, June 2011
|
|
|---|---|---|
| Article Number | A147 | |
| Number of page(s) | 11 | |
| Section | Extragalactic astronomy | |
| DOI | https://doi.org/10.1051/0004-6361/201015247 | |
| Published online | 26 May 2011 | |
Megamaser detection and nuclear obscuration in Seyfert galaxies⋆
1
Astronomisches Institut, Ruhr–Universität Bochum,
Universitätsstraße 150,
44801
Bochum, Germany
e-mail: This email address is being protected from spambots. You need JavaScript enabled to view it.
2
Department of Physics, University of California,
Santa Barbara, CA
93106,
USA
3
Facultad de Ciencias, Universidad Católica del
Norte, Antofagasta,
Chile
Received:
21
June
2010
Accepted:
3
February
2011
Abstract
We revisit the relation between H2O maser detection rate and nuclear obscuration for a sample of 114 Seyfert galaxies drawn from the CfA, 12 μm, and IRAS F25/F60 catalogs. These sources have mid-infrared spectra from the Spitzer Space Telescope and we search for accompanying X-ray and [O III] 5007 Å fluxes from the literature. We use the strength of the [O IV] 25.9 μm emission line as a tracer of the intrinsic AGN strength. After the normalization by [O IV], the observed X-ray flux provides information about X-ray absorption. The distribution of X-ray/[O IV] flux ratios is significantly different for masers and non-masers: The maser detected Seyfert-2s (Sy 1.8–2.0) populate a distinct X-ray/[O IV] range, which is, on average, about a factor of four lower than the range of Seyfert-2 non-masers and about a factor of ten lower than the range of Seyfert-1s (Sy 1.0–1.5). Non-masers are almost equally distributed over the entire X-ray/[O IV] range. This provides evidence that high nuclear obscuration plays a crucial role in determining the probability of maser detection. Furthermore, after normalization with [O IV], we find a similar but weaker trend for the distribution of the maser detection rate with the absorption of the 7 μm dust continuum. This suggests that the obscuration of the 7 μm continuum occurs on larger spatial scales than that of the X-rays. Hence, in the AGN unified model, at moderate inclinations away from edge-on, the 7 μm dust absorption may occur without any proportionate X-ray absorption. The absorption of [O III] appears unrelated to maser detections. The failure to detect masers in obscured AGN is most likely due to insufficient observational sensitivity.
Key words: galaxies: Seyfert / galaxies: nuclei / masers / X-rays: galaxies / infrared: galaxies
Full Table 1 is only available in electronic form at the CDS via anonymous ftp to cdsarc.u-strasbg.fr (130.79.128.5) or via http://cdsarc.u-strasbg.fr/viz-bin/qcat?J/A+A/530/A147
© ESO, 2011
1. Introduction
H2O megamaser galaxies represent an extreme subclass of active galactic nuclei (AGN) with strong water maser emission at 22 GHz (reviews by Lo 2005; and Henkel et al. 2005). In those cases where the emission arises from a molecular disk and can be resolved spatially using very long baseline interferometry, the central black hole (BH) mass, and the distance to the galaxy can be determined (e.g. for NGC 4258, Greenhill et al. 1993; Herrnstein et al. 1999). Thus, finding megamasers (henceforth simply called masers) and understanding their properties is of great interest.
Owing to theoretical considerations, a large line-of-sight column density of velocity coherent gas favors the detection of a maser. High velocity coherence of the maser emitting gas is required, because energy and momentum conservation imply that the induced photon has the same frequency and direction as the stimulating photon (e.g. Elitzur 2002). While the emission of an individual maser spot is directional (i.e. beamed), a collection of these spots statistically may be expected to radiate in all directions, but this has not yet been confirmed. The originally discovered water maser emission from AGN comes from (presumably edge-on) disks, and the resolved emission in most sources traces accretion disks and in a few cases star formation masers. However, two sources, Circinus and NGC 3079, exhibit in addition off-disk jet masers that seem to trace outflows. These outflow masers are potentially torus clouds (Nenkova et al. 2008).
In the AGN unified model, an optically thick obscuring dust torus is envisioned to encircle the accretion disk and type-1 AGN are seen pole-on while type-2 AGN are seen edge-on (Antonucci 1993). Masers are almost exclusively found in AGN of Seyfert-2 or LINER type, consistent with the picture that masers are preferentially beamed in the plane of the torus (Braatz et al. 1997, 2004; Henkel et al. 2005). But not all type-2 AGN are masers.
We note that the 22GHz radio-frequency maser emission itself is believed to be largely unaffected by absorption; but high X-ray, optical, or mid-infrared obscuration may indicate that there is a high likelihood that the masing disk is seen edge-on, hence favoring a maser detection.
Type-2 AGN that host masers show a prevalence (>80%) of high X-ray obscuring columns (NH > 1023 cm2) and about half are Compton thick (NH > 1024 cm2) (Braatz et al. 1997; Zhang et al. 2006; Greenhill et al. 2008). However, as pointed out by Zhang et al. (2006), among type-2 AGN the average X-ray derived column densities of masers and non-masers1 are indistinguishable. One explanation of this unexpected result could be that X-ray scattering in clumpy media dilutes the true line-of-sight column density, and thus prevents us from deriving unbiased orientation information. Therefore, it is vital to include information from other than X-ray wavelengths to reveal the potential influence of nuclear obscuration on the maser detection and non-detection, respectively.
Zhang et al. (2010) analyzed the Kα iron-line equivalent width EW(Kα), following the strategy of Bassani et al. (1999), and compared it with two optical thickness parameters, the infrared 6–400 μm luminosity LIR derived from IRAS 12–100 μm photometry and the [O III] 5007 Å emission-line luminosity L [O III] . Both parameters were adopted as isotropic tracers of the intrinsic AGN strength. While the EW(Kα) distributions of 19 masers and 34 non-masers cover the same broad range (100–3000 eV), the median EW(Kα) of masers is about a factor of four higher than that of the non-masers, indicating that the X-ray continuum of masers is more absorbed than that of non-masers.
However, it remains a matter of debate whether LIR and L [O III] are indeed isotropic tracers of the intrinsic AGN luminosity. While [O III] has often been used as an isotropic AGN tracer (Mulchaey et al. 1994; Alonso-Herrero et al. 1997; Bassani et al. 1999; Heckman et al. 2005; Panessa et al. 2006; Lamastra et al. 2009), the discovery of polarized [O III] emission in some type-2 AGN (di Serego Alighieri et al. 1997) implies that a substantial fraction of the [O III] emission might be shielded by the torus. Further studies, using MIR emission lines such as [O IV] or [Ne V] as orientation independent tracers of the AGN power, provide evidence in terms of the [O III]/[O IV] ratio, that [O III] suffers orientation-dependent extinction, up to a factor of ten in individual cases (Haas et al. 2005; Meléndez et al. 2008a; Baum et al. 2010).
This is qualitatively consistent with results obtained using the (extinction-corrected) 2–10 keV X-ray luminosity LX as an intrinsic measure of AGN power; Netzer et al. (2006) find that L [O III] /LX of type-2 AGN is, on average, about a factor of two lower than that of type-1 AGN. Even in the face-on Sy1 case, the back-sided cone of the NLR lies – at least partly – behind an absorbing layer (e.g. the dust torus). Therefore, it is highly questionable how far [O III] can serve as an isotropic AGN tracer. The extinction correction via Balmer decrement (Hα/Hβ = 3) remains highly uncertain, since it is dependent on the geometry of the emitting and obscuring regions.
Hes et al. (1996) and Baker (1997) caution against the use of [O III] as a measure of the intrinsic NLR emission and suggest using [OII] 3727 instead. Observations of radio-loud AGN, where the orientation can be inferred from radio morphology, show that [O II] is largely orientation independent (Hes et al. 1996; Baker 1997). On the other hand, because of its low ionization potential, [O II] may also be dominated by star formation in the host (e.g. Ho 2005). Then, the decline in L [O II] /LX with increasing LX, as found by Netzer et al. (2006), could be naturally explained by a decline in host/AGN with increasing AGN LX.
Likewise the mid-infrared (λ < 40 μm) part of LIR is orientation dependent (e.g. Fig. 16 in Buchanan et al. 2006), while the far-infrared (λ > 40 μm) emission of Seyfert galaxies and low-luminosity quasars is dominated by star-forming contributions rather than the AGN itself (e.g. Maiolino & Rieke 1995; Schweitzer et al. 2006). Thus, a careful re-investigation using more suitable isotropic AGN tracers would be desirable.
Documentation of how far the three samples (of 163 sources in total) match and complement each other.
The average values and standard deviations of the logarithmic luminosity ratios for each subset of Seyfert galaxies.
Here, we revisit the connection between maser detection rate and nuclear obscuration by using the strength of the [O IV] 25.9 μm emission line (for short [O IV]) as tracer for the intrinsic AGN strength. [O IV] has been found to be largely unaffected by obscuration (e.g., Genzel et al. 1998; Haas et al. 2005; Meléndez et al. 2008a; Baum et al. 2010). We combine the strategies of Bassani et al. (1999) and Meléndez et al. (2008a). The observed X-ray (2–10 keV) flux normalized by [O IV] should provide information about X-ray absorption, even in the case of X-ray scattering caused by a complex geometry or for Compton thick cases. We compare the distribution of X-ray/[O IV] for masers and non-masers. In addition, after normalization of the 7 μm flux by [O IV], we inspect the relation between maser detection rate and the absorption of the 7 μm dust continuum emitted from the nuclear torus, as well as maser detection and the absorption of the [O III] 5007 Å emission from the central part of the narrow-line region (NLR).
The distances from which we derived the luminosities are taken from the NED database. The cosmology is based on H0 = 73 km s-1 Mpc-1, ΩΛ = 0.73, and Ωm = 0.27.
2. Data
2.1. The parent sample
At first glance, one could take all known masers and non-masers from the literature and compare their properties, such as LX/L [O IV] . However, to determine nuclear obscuration, one also needs to know the range of LX/L [O IV] for unobscured (preferentially Sy1) sources, which should comprise a complete sample free of any selection bias. However, the selection of Seyferts for which a maser search has been performed has not followed any clear criteria. Even worse, most maser searches have been performed on Sy2s, but only a small number on Sy1s. Because incomplete sample selection may influence the results, we decided to start with complete Seyfert catalogs with well-defined selection criteria. To increase the sample size, we created a master sample from the following three catalogs, consisting of a total of 163 sources:
-
the magnitude-limited complete sample of the CfA Redshift Survey by Huchra & Burg (1992), which was supplied with updated Seyfert-type information from the NED database;
-
the 12 μm active galaxy sample by Spinoglio & Malkan (1989), complemented by that of Rush & Malkan (1993);
-
the IRAS F25/F60 flux-ratio selected sample by de Grijp et al. (1992), as refined by Schmitt et al. (2003).
In Sect. 3.4, we discuss potential differences between the three samples and our combined sample and all other known masers outside it. The Spitzer data archive contains IRS spectra (at ~26 μm) for 126 of the 163 sources classified as Seyferts according to the NED. This data is listed in Table 3. It covers the complete CfA-sample of 54 Seyfert Galaxies. It includes 107 of 118 Seyferts (two blazars included as Sy1) from the 12 μm selected sample. For the IRAS sample, we found useful IRS spectra for 34 of 60 sources.
2.2. Maser information
The parent sample of 126 sources with Spitzer spectra was searched for known maser-detections and non-detections. For this purpose, we used the lists compiled by Bennert et al. (2009) and those on the website of the Hubble constant Maser Experiment (HoME)2.
This search results in 18 masers (3 Sy1s, 15 Sy2s), 96 non-masers (36 Sy1s, 60 Sy2s), and 12 sources (10 Sy1s, 2 Sy2s) for which no maser search has yet been performed (henceforth called maser-unknown). The results are listed in Table 3, Col. 2.
2.3. [O IV] 25.89 μm line and 7 μm continuum flux
Our analysis is based on public archival IRS spectra of Seyfert galaxies. We used the post-basic-calibration data (PBCD), reduced by the Spitzer Science Center’s (SSC) pipeline. This included droop-, stray-light-, cross-talk- and saturation correction, dark subtraction, flatfielding and coaddition.
Where possible, IRS high resolution spectra with R ~ 600 were chosen, to avoid the contamination of [O IV]25.89 μm by the neighboring [Fe II]25.99 μm emission line. If high resolution spectra were not available, the low-resolution spectra were used, after a background subtraction had been performed by the SSC pipeline.
For the high resolution data collected with the shorter (4.7 × 11.3 and 11.1 × 22.3 arcsec) slits, separate background observations had to be chosen to evaluate the background contribution. This was performed in Ramolla (2009) by comparing the background with the source fluxes at the presumably weakest part of the source spectrum in the 9 and 10 μm rest frame; with the result that the background contribution is negligible compared to the conservatively assumed flux calibration errors of 15%. The resulting errors are calculated from an assumed 15% flux calibration error and the error in the line-fitting routine.
Measured fluxes and literature values.
The [O IV] flux was extracted by fitting a simple spectral model to a wavelength window of ~0.3 μm around the [O IV] line. This model consists of a linear base, convolved with Gaussian profiles that also include the neighboring [Fe II] line. No [O IV] aperture corrections had to be applied, because for both, high- and low-resolution data, the slit apertures cover an area larger than the expected size of the NLR, as estimated from the relationship3 of [O III] luminosity to NLR size, found by Bennert et al. (2002).
We calculated the 7.6 μm (henceforth for short 7 μm) continuum flux from the background-subtracted IRS low-resolution spectra. We used a modified version of the PAHFIT code by Smith et al. (2007), which estimated the continuum in the 5 to 11.8 μm branch. As suggested by Smith & Draine (2008), we did not correct the continuum fit for the silicate feature at 9.7 μm. The 7 μm continuum flux was then calculated from the PAH flux and the equivalent width of the features at 7.4 μm, 7.6 μm, and 7.8 μm (Ramolla 2009). The uncertainties in the 7 μm continuum are conservatively estimated to be smaller than 30%, which is sufficient for our purpose. In a few cases, the AGN contribution may be contaminated by nuclear (<3.7″) star formation (e.g. Deo et al. 2009). We verified that the effect on our statistical analysis is negligible compared to high resolution ground-based MIR observations.
The [O IV] and 7 μm fluxes are listed in Table 3. The values are consistent with those derived by others (Buchanan et al. 2006; Deo et al. 2007, 2009; Tommasin et al. 2010).
2.4. X-rays + [O III] 5007 Å line from the literature
The 2–10 keV hard X-ray data were obtained by several observers using ASCA, Beppo SAX, Chandra, and XMM. We collected the data from the NED; in case of multiple entries we chose the latest detection.
We collected [O III] 5007 Å emission line fluxes from various literature sources, as listed in Table 3. Because of the large uncertainties, we applied neither an extinction correction nor aperture correction for the [O III] fluxes. Those aperture corrections would affect few very nearby sources, but most sources are sufficiently distant to ensure that any bias in the statistical analysis is small.
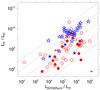 |
Fig. 1 Observed 2–10 keV X-ray versus [O IV] line luminosity. Blue stars represent Sy1s (Sy 1.0–1.5), red circles Sy2s (Sy 1.8–2.0). Filled symbols are masers, open symbols are non-masers. The dotted lines mark fixed LX/L [O IV] ratios of 1000; 100; 10; 1; 0.1 (from top to bottom). The error-bar in the lower right corner is the average relative error of all [O IV] measurements. |
2.5. Additional maser sources
On the one hand, our combined sample is drawn from the CfA, 12 μm, and IRAS F25/F60 catalogs, which contains 15 Sy2 maser sources with Spitzer spectra. On the other hand, a total of 52 masing Sy2 are known so far (Bennert et al. 2009; Zhang et al. 2010), although these are drawn from different AGN catalogs using inhomogeneous criteria.
To compare the 15 Sy2 masers of our combined sample with the remaining 37, we also analyzed available Spitzer spectra and gathered additional [O III] and X-ray fluxes for them from the literature in the same manner, as we did for our combined sample. This results in an “off-sample” list of 37 Sy2 masers that is appended to Table 3.
3. Results and discussion
While our combined sample of 126 sources contains 114 maser and non-maser sources (12 maser-unknown excluded), not all of them have data for all the observables considered here (X-rays, F7 μm, [O III]). Therefore, we compare the maximum possible subsets of observable pairs, and discuss the implications in the framework of the AGN unified model. Therein we consider as components the accretion disk supposed to host the maser, the dust torus, the bi-conical NLR, and the host galaxy. We denote by Sy1s the subtypes between Seyfert 1.0 and 1.5, and by Sy2s those between Seyfert 1.8 and 2.0. All figures contain a combined error bar in the lower right corner that is averaged from all relative errors in this measurement. Since the literature sources do not have uniformly presented errors, we do not perform this step for the X-ray, [O III], and H2O luminosities.
3.1. Nuclear X-ray obscuration
Figure 1 shows the observed hard X-ray versus [O IV] line luminosities, and Fig. 2 the LX/L [O IV] histogram. The main characteristics are:
-
on average, Sy1s have an X-ray/[O IV] ratio that is about 10 times higher than Sy2s;
-
Sy2 non-masers are evenly distributed over the entire range occupied by Sy2 masers and Sy1s (Fig. 1);
-
Sy2 masers are almost disjoint from Sy1s. At a given [O IV] luminosity, Sy2 masers have on average about a factor of four lower X-ray luminosity than Sy2 non-masers (Fig. 2). Likewise, the few Sy1 masers have a lower X-ray luminosity than Sy1 non-masers4;
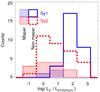
Fig. 2 Histogram of the LX/L [O IV] ratio of the data points shown in Fig. 1. The red dashed line represents Sy2 non-masers, whereas the blue thick line represents the Sy1 non-masers. The maser-detections are represented by the dashed surfaces – blue and vertically dashed for Sy1, red and horizontally dashed for Sy2. The one upper limit is excluded.
-
six out of 12 sources without masing information, but LX and L [O IV] available (see Table 3), show the same trends as the Sy1s and Sy2s with masing information (see Table 2). They are not plotted, to avoid the overcrowding of Figs. 1 and 2, with too many different symbols.
Assuming that Sy1s are almost unobscured, the obscured sources populate the LX/L [O IV] range below 10 in Fig. 1. Thus, masers almost completely populate the range of obscured sources. This range also surprisingly contains numerous non-masers. To more clearly understand why the maser search failed in these absorbed sources, we consider the influence of observed brightness. Figure 3 shows the X-ray and [O IV] flux distribution (instead of the luminosity distribution). The Sy2 masers and non-masers exhibit a flux-dependence in their [O IV] distribution. Sources with low [O IV] flux are more frequently classified as non-masers(2 Sy2 maser and 12 Sy2 non-maser at L [O IV] < 10-16 W m-2), while sources with high [O IV] flux are more frequently classified as masers (6 Sy2 maser and 5 Sy2 non-maser at L [O IV] > 10-15 W m-2). Figure 4 displays the [O IV] fluxes of all Sy2s lying below the dividing line between obscured and unobscured sources (LX: L [O IV] ≈ 10). Among this subset of obscured Sy2s, the frequency of non-masers rises constantly towards lower [O IV] fluxes, in contrast to the distribution of masers. This incidence is consistent with an observational bias against the maser-detection for faint AGN. This implies that a relation exists between [O IV] flux and H2O flux, which is indeed observed in Fig. 9 and discussed in Sect. 3.5.
Because the detection of maser emission appears to be biased against sources with low flux, we conclude that among obscured sources the true fraction of masers is higher than indicated by Fig. 2.
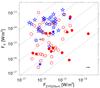 |
Fig. 3 Observed X-ray versus [O IV] line flux. Symbols and colors are as in Fig. 1. The dotted lines mark fixed flux ratios of 1000; 100; 10; 1; 0.1 (from top to bottom). The error bar in the lower right corner is the average relative error in all [O IV] measurements. |
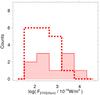 |
Fig. 4 [O IV] flux histogram of Sy2 masers for absorbed sources from Fig. 3 with LX/L [O IV] < 10. Masers are represented by the shaded area, non-masers by the thick dashed histogram. |
3.2. Extended obscuration of the dust torus and the NLR
Figure 5 shows a histogram of the MIR 7 μm continuum to [O IV] line ratio. The striking features of this diagram are:
-
Sy2s populate about the same total range as Sy1s, but show a prevalence of lower 7 μm/[O IV] values, i.e. a 7 μm continuum deficit. On average, the ratio 7 μm/[O IV] of Sy2s is about a factor of three lower than that of Sy1s. This is consistent with the results obtained via radio normalization (7 μm/8 GHz) by Buchanan et al. (2006, their Fig. 16).
-
Among Sy2s, the 7 μm/[O IV] ratio of masers is, on average, about a factor of two lower than that of non-masers. A KS test results in a probability of3.7% that the Sy2 masers and non-masers are drawn from the same parent distribution. Flux considerations similar to those for LX/L [O IV] suggest that the true 7 μm/[O IV] separation of masers and non-masers will be even more pronounced once the observational bias against the detection of low flux masers is taken into account.
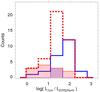 |
Fig. 5 Histogram of the 7 μm continuum to [O IV] line ratio. Legend as in Fig. 2.All 21 upper limits from Table 3 are excluded. |
To provide additional clues on the extent of the MIR-absorbing material, we consider the [O III] 5007 Å versus [O IV] line luminosity as shown in Figs. 6 and 7. The features of the [O III]/[O IV] distribution are similar to those of 7 μm/[O IV]. Most Sy2s populate the same range as Sy1s, a few Sy2s show a [O III] deficit, i.e. [O III]/[O IV] ratios lower on average about a factor 3 compared to Sy1s, consistent with the results of Baum et al. (2010) for the 12 μm sample. The distribution pattern of masers and non-masers appears to be statistically indistinguishable. A KS-test results in a probability of 61% that the Sy2 masers and non-masers are drawn from the same parent population. However, the Sy2 subsample in Figs. 6 and 7 shows a distinct tail towards lower ratios, potentially caused by absorption.
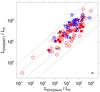 |
Fig. 6 Distribution of [O III] 5007 Å versus [O IV] 25.9 μm luminosity. Symbols are as in Fig. 1. The dotted lines mark fixed ratios 10; 1; 0.1; 0.01 (from top to bottom).The error bar in the lower right corner is the average relative error of all [O IV] measurements. |
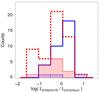 |
Fig. 7 Histogram of the [O III] to [O IV] ratio. Legend as in Fig. 2. Five upper limits are excluded. |
The [O IV] 25.9 μm line is ~50 times less affected by extinction than the optical [O III] 5007 Å line. A low [O III]/[O IV] ratio argues in favor of large obscuration, as explained in Haas et al. (2005). Another explanation of the very different [O III]/[O IV] ratios could be the different radiation fields in the NLR. Because the [O IV] 25.9 μm line needs a higher ionization potential than the optical [O III] 5007 Å line, AGN with a hard radiation field are expected to have a low ratio. The Sy2s with low [O III]/[O IV] would then be those AGN with hard radiation fields. However, this is inconsistent with other spectroscopic MIR tracers such as the [Ne II] 12.8 μm to [O IV] flux ratio (Meléndez et al. 2008b). Thus, we conclude that in Figs. 6 and 7 the NLR of Sy2s with an [O III] deficit is considerably obscured.
While the [O III] obscuration may occur mainly in the innermost part of the NLR, the large extent (>1 kpc) of the NLR suggests that the absorption is not confined to the region encircled by the dust torus. The sky-projected distribution of the absorbing material might reach further out to a considerable distance (several hundred parsec) from the line-of-sight to the nuclear accretion disk. The presence of moderately extended [O III] absorption, as well as the similarity of the 7 μm/[O IV] and [O III]/[O IV] diagrams supports the picture that the MIR absorption also takes place in a moderately extended layer, i.e. the torus halo mentioned above. Although both observables 7 μm and [O III] appear to be affected by absorption in a similar fashion, we note that the distribution of 7 μm/[O III] spans a wide range (2–700). This is unsurprising in view of the diversity of the orientation-dependent appearance of the involved emitters and absorbers even for a simple AGN model.
3.3. Combined picture
Why do masers and non-masers have such different distributions in X-ray/[O IV], while their distribution in 7 μm/[O IV] looks more similar?
Because masers need a large line-of-sight column density of velocity coherent gas, they are expected to be predominantly detected in edge-on accretion disks. Thus, the maser detection or non-detection can tell us about the disk orientation with respect to the line-of-sight. To constrain the implications in the framework of the AGN unified model, we consider two extreme cases:
-
1.
For a disk seen edge-on, the maser is obviously most easily detected and the molecular torus is also seen more or less edge-on. In this case, the nuclear accretion disk (and its corona) is shielded by the torus, so that the X-rays are heavily obscured. If additional extended material, capable of obscuring the MIR emission, does not lie in the torus plane, the 7 μm/[O IV] ratio is lower.
-
2.
For a non-maser, both the disk and torus appear to be sufficiently tilted away from edge-on, so that the nuclear X-ray absorption is relatively low. In addition, our diagrams indicate the existence of non-masers, where the torus plane is seen edge-on, although in these cases the disk might be tilted out of this plane because of the locally different angular momentum. For a non-maser, the edge-on torus also causes a high obscuration of the X-ray nucleus. On the other hand, irrespective of the disk and torus orientation, the MIR continuum can be absorbed or not depending on the line-of-sight through the extended host.
3.4. Comparison of the three samples with other known masers
Our combined sample was compiled from three complete samples with good coverage in the Spitzer archive. Table 1 shows the overlaps between the samples. We note that each sample is incomplete because of the limited availability of data in the Spitzer IRS archive and of X-ray and [O III] measurements in the literature (see Table 2). Moreover, maser surveys have not been performed with homogeneous properties (sensitivity, velocity coverage) nor carried out for all sources of our combined sample.
The three samples are based on different selection criteria: Optically selected Seyferts in the CfA sample and IRAS selected sources in the 12 μm and F25/F60 sample. Thus, it is possible that they are affected by different biases with respect to potential maser detection. The fraction of Sy2 masers to non-masers increases from 1/4 (4/16) in the CfA sample, to ~1/3 (11/29) in the 12 μm sample and to ≳1 (8/6) in the IRAS F25/F60 sample. This is consistent with the well-known finding that the mid- and far-infrared wavelengths select more obscured AGN than the optical bands.
However, the range of luminosity ratios (LX/L [O IV] , L7μm/L [O IV] , L [O III] /L [O IV] ), listed in Table 2, are similar for all three samples. This also indicates that among optical selected masing sources, some can be obscured at a level similar to that of infrared selected sources5. To summarize, the result of all three samples (CfA, 12 μm, and IRAS F25/F60) are similar in that they point consistently to a prevalence of maser detections in Sy2s with high X-ray obscuration and one may expect that this also holds in general for Seyfert galaxies.
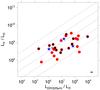 |
Fig. 8 Observed 2–10 keV X-rays plotted against [O IV] line luminosity. Sy1 masers are represented by blue stars and Sy2 masers by red dots. Off-sample Sy2 masers are marked with black dots. The dotted lines mark fixed flux ratios of 1000; 100; 10; 1; 0.1 (from top to bottom). The error bar in the lower right corner is the average relative error of all [O IV] measurements. |
Are our selected Sy2 masers representative of all 52 known Sy2 masers (Zhang et al. 2010)? To address this question, we compare our in-sample Sy2 masers with all remaining 37 off-sample Sy2 masers.
In Fig. 8, we compare X-ray and [O IV] luminosities between in- and off-sample masers. The comparison refers to those masers with X-ray and [O IV] fluxes available, i.e. 12 off-sample Sy2s, 13 in-sample Sy2s, and 3 in-sample Sy1s. Both the in-sample and off-sample roughly populate the same LX/L [O IV] range. However, the LX/L [O IV] ratio is, on average, about a factor of two higher for the off-sample than the in-sample masers. This indicates that the off-sample Sy2 masers may be less absorbed than the in-sample ones. Compared with the in-sample Sy2 non-masers (omitted in Fig. 8, see Fig. 1), however, the off-sample masers show, on average, about a factor of two lower LX/L [O IV] , hence considerably high obscuration.
Some off-sample masers exhibit spurious flux ratios indicative of no obscuration (i.e. LX/L [O IV] > 10 for 4 objects). Among them, we find two nearby extended sources, NGC 4258 and NGC 4945, in which the X-ray emission was associated with star formation by Risaliti (2002) and Strickland et al. (2004).
To summarize, the large overlap and the lack of significant differences between in- and off-sample Sy2 masers indicates that the results for our combined sample of Sy2 masers can be extended to all known Sy2 masers.
We note that the inhomogeneous selection of all off-sample masers and non-masers precludes any meaningful comparison of maser to non-maser statistics with our in-sample data. A KS test shows a probability of 63% that subsets of both, off- and in-sample masers, are drawn from the same parent distribution and the above-mentioned difference in LX/L [O IV] is only by chance. However, a KS test between the in-sample non-masers and the off-sample masers similarly yields a 60% probability that they are drawn from the same parent distribution. Comparing the LX/L [O IV] ratio of the in-sample Sy1 non-masers with those of the off-sample Sy2 masers, shows a probability of 0.16%0 of their being drawn from the same parent distribution. This indicates that the off-sample Sy2 masers differ significantly from the unobscured Sy1 non-maser.
3.5. Maser and AGN luminosity
A search for H2O masers in 274 high-redshift (0.3 < z < 0.8) SDSS type-2 AGN, of which half are type-2 quasars (Bennert et al. 2009) found only one maser (SDSSJ0804+3607, Barvainis & Antonucci 2005). The high rate of non-detections in these luminous AGN might be due to limited observational sensitivity or intrinsic differences between low- and high-luminosity AGN. These differences could for instance be that in a high-luminosity AGN the accretion disk becomes hotter so that the density required for maser emission falls below a critical limit. If this were frequently the case, one would expect a relative decline in H2O maser luminosity with increasing AGN luminosity. On the other hand, the SDSS H2O maser survey was relatively shallow, because one was interested in finding masers that are sufficiently bright for spatially resolved follow-up VLBI observations.
We consider how far the Seyfert sample can help us to distinguish between these two possibilities (i.e. by investigating whether or not LH2O/L [O IV] declines with increasing L [O IV] ). A remarkable feature of Fig. 1 is that maser-detections and non-detections are quite evenly distributed across the whole [O IV] luminosity range covering about four orders of magnitude. Thus, our data do not indicate a trend where the frequency of non-masers increases with luminosity. We have also seen that the available maser observations of the Seyferts are biased against maser detection in faint (and distant) AGN (Fig. 4).
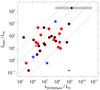 |
Fig. 9 Maser H2O versus [O IV] luminosity.Symbols and colors are as in Fig. 8. The dotted lines mark fixed ratios 10-4; 10-5; 10-6; 10-7 (from top to bottom). For comparison, the expected position of the z = 0.66 maser SDSSJ0804+3607 is marked with a black dot and a gray bar covering the range 0.1 × L [O III] < L [O IV] < 100 × L [O III] assumed from Fig. 6. |
Figure 9 shows the (isotropic) maser luminosity versus the AGN luminosity traced by [O IV]. In addition to the Seyfert sample, we have plotted the expected position of SDSSJ0804+3607 at z = 0.66, the only QSO-2 maser detection. Because this source had not been observed with Spitzer IRS, we derived L [O IV] from L [O III] using the range 0.1 × L [O III] < L [O IV] < 100 × L [O III] as indicated in Fig. 6, which is also valid for higher luminosity AGN (Haas et al. 2005). At a given [O IV] luminosity, the maser luminosity spreads over three orders of magnitude (Fig. 9). One explanation for the large spread is that the maser emission is not isotropic, and hence the derived maser luminosity depends sensitively on the maser direction with respect to the line-of-sight. The Seyfert sample alone indicates only a marginal correlation in Fig. 9, with a Pearson correlation coefficient of 0.32 for all Sy2 masers of our combined sample that is not significant at the 5% level. Adding the off-sample Sy2 masers changes the coefficient to 0.46 which would then be significant, but this correlation might also be an artifact of distance in the luminosities. However, in addition to the position of SDSSJ0804+3607 and that its assumed H2O/[O IV] ratio lies in the same range as the lower luminosity AGN, argues in favor of a physical connection between maser and AGN luminosity.
The numerous non-masers among the SDSS QSO-2s (Bennert et al. 2009) have a [O III] luminosity similar to that of SDSSJ0804+3607, hence are expected to populate a similar L [O IV] range in Fig. 9. The H2O maser upper limits6, found for these QSO-2s by Bennert et al. (2009), lie even above J0804+3607. Thus, the upper limits are not stringent enough to support a relative decline of maser luminosity with increasing AGN luminosity. This, together with the sufficiently high LH2O/L [O IV] ratio of J0804+3607, leads us to conclude that the main reason for the high rate of maser non-detections is insufficient observational sensitivity, rather than basic differences between low-and high-luminosity AGN for hosting a maser.
4. Conclusion
To understand the connection between H2O maser detection rate and nuclear extinction, we have used the [O IV]25.9 μm line and the 7 μm continuum flux from Spitzer spectra of a well-selected sample of 114 Seyfert galaxies from the CfA, 12 μm, and IRAS F25/F60 catalogs, for which a maser search has been performed. These data have been compared to hard X-ray and [O III] 5007 Å fluxes from the literature. We have analyzed the data in the framework of the orientation-dependent AGN unified scheme, yielding the following results:
- 1.
Comparing hard X-rays to [O IV] flux, Sy2s exhibit, on average, an about ten times lower X-ray to [O IV] ratio than Sy1s. Masers reside primarily in X-ray absorbed sources (i.e. those with low LX/L [O IV] ratios). Sy2 masers have on average about four times less X-ray flux normalized by [O IV] than non-maser Sy2s. This is consistent with the geometric alignment of both the X-ray absorber and the maser emitting region in the accretion disk. Non-masers do not tend to reside predominantly in strongly absorbed sources. However, our data uncover an observational bias against faint sources, in the sense that more sensitive maser observations might reveal more absorbed sources to house a maser.
- 2.
For the 7 μm to [O IV] flux ratio, we have found that most Sy2s are spread across the same range as Sy1s. However, some sources have a significantly lower ratio, rendering the Sy2s on average about three times lower than Sy1s. These cases can be explained by an extended dusty absorber covering the 7 μm emitting torus region. Maser detections also appear to correspond to 7 μm absorbed sources, but with less significance than in the X-ray to [O IV] comparison. This suggests that the geometric alignment of the MIR absorber with the maser emitting disk is not as perfect as the supposed alignment of the disk with the X-ray absorber.
- 3.
The [O III] to [O IV] flux ratio also indicates the presence of extended obscuration in some Sy2s that blocks the optical emission from the NLR. Masers and non-masers are distributed very similarly in the [O III] to [O IV] plot. The fraction of maser-detections is not significantly higher for sources with this extended absorption. This leads us to conclude that the matter distribution for the [O III] absorber is not essential for the prediction of a maser detection. Moreover, it is possible that a substantial fraction of the absorption of AGN emission could occur in extended regions outside the torus that are not necessarily aligned with the torus or AGN sub-structure.
- 4.
The separate three samples, CfA, 12 μm, and IRAS F25/F60 provide very similar results. The Sy2 maser to non-maser fraction increases from optical to infrared selection. The Sy2 masers of our combined sample have a similar range of L [O IV] and LH2O as the known off-sample Sy2 masers. While, on average, the off-sample masers are a factor of two less obscured, as inferred by the LX/L [O IV] ratio, they are still considerably obscured compared to Sy1s from our combined sample. Thus, the results obtained for our combined sample of Sy2 masers may also hold for all remaining Sy2 maser sources that have no Spitzer or X-ray data available.
- 5.
After supplementing our combined sample with the remaining known Sy2 masers that were not included in it the H2O maser luminosity appears to be correlated with the AGN luminosity traced by [O IV], although it has a large spread. We do not find any evidence of physical differences between low-and high-luminosity AGN hosting a maser.
We denote as non-masers those AGN that have been observed at 22 GHz, but for which no megamaser was detected.
http://www.cfa.harvard.edu/~lincoln/demo/HoME/surveys/survey.html compiled from Kondratko et al. (2006b,a); Hagiwara et al. (2003); Zhang et al. (2006); Braatz et al. (2004); Hagiwara et al. (2002); Greenhill et al. (2002, 1997); Sato et al. (2005); Braatz et al. (1996); Greenhill et al. (1995); Nakai et al. (1995); Henkel et al. (1998, 2005); Braatz et al. (2003); Henkel et al. (1984); Haschick & Baan (1985); Claussen & Lo (1986); Henkel et al. (1986); Becker et al. (1993); Greenhill et al. (1990); Braatz & Gugliucci (2008); Henkel (2008); Braatz (2008).
log (RNLR) = (0.52 ± 0.06) × log (L [O III] ) − (18.5 ± 2.6).
The Sy1 masers are NGC 4051, NGC 4151, and UCG 5101. Note that both NGC 4051 and NGC 4151 have relatively low maser H2O luminosity, and UCG 5101 is an ultra-luminous infrared galaxy so that the maser luminosity could arise from starburst regions rather than from the AGN accretion disk.
Even for infrared-selected AGN, optical criteria influence the sample, because the Seyfert identification is done using optical spectroscopy.
 .
.
Acknowledgments
The work is based on observations made with the Spitzer Space Telescope, which is operated by the Jet Propulsion Laboratory, California Institute of Technology under a contract with NASA. This research has made use of the NASA/IPAC Extragalactic Database (NED) which is operated by the Jet Propulsion Laboratory, California Institute of Technology, under contract with the National Aeronautics and Space Administration. This publication is supported as a project of the Nordrhein-Westfälische Akademie der Wissenschaften und der Künste in the framework of the academy program by the Federal Republic of Germany and the state Nordrhein-Westfalen. We thank the referee J. S. Zhang for his careful review of the manuscript.
References
- Alonso-Herrero, A., Ward, M. J., & Kotilainen, J. K. 1997, MNRAS, 288, 977 [NASA ADS] [Google Scholar]
- Antonucci, R. 1993, ARA&A, 31, 473 [Google Scholar]
- Awaki, H., Ueno, S., Taniguchi, Y., & Weaver, K. A. 2000, ApJ, 542, 175 [NASA ADS] [CrossRef] [Google Scholar]
- Baker, J. C. 1997, MNRAS, 286, 23 [NASA ADS] [CrossRef] [Google Scholar]
- Barvainis, R., & Antonucci, R. 2005, ApJ, 628, L89 [NASA ADS] [CrossRef] [Google Scholar]
- Bassani, L., Dadina, M., Maiolino, R., et al. 1999, ApJS, 121, 473 [NASA ADS] [CrossRef] [Google Scholar]
- Baum, S. A., Gallimore, J. F., O’Dea, C. P., et al. 2010, ApJ, 710, 289 [NASA ADS] [CrossRef] [Google Scholar]
- Becker, R., Henkel, C., Wilson, T. L., & Wouterloot, J. G. A. 1993, A&A, 268, 483 [NASA ADS] [Google Scholar]
- Bennert, N., Falcke, H., Schulz, H., Wilson, A. S., & Wills, B. J. 2002, ApJ, 574, L105 [NASA ADS] [CrossRef] [Google Scholar]
- Bennert, N., Jungwiert, B., Komossa, S., Haas, M., & Chini, R. 2006, A&A, 446, 919 [NASA ADS] [CrossRef] [EDP Sciences] [Google Scholar]
- Bennert, N., Barvainis, R., Henkel, C., & Antonucci, R. 2009, ApJ, 695, 276 [NASA ADS] [CrossRef] [Google Scholar]
- Bianchi, S., Balestra, I., Matt, G., Guainazzi, M., & Perola, G. C. 2003, A&A, 402, 141 [NASA ADS] [CrossRef] [EDP Sciences] [Google Scholar]
- Bianchi, S., Miniutti, G., Fabian, A. C., & Iwasawa, K. 2005, MNRAS, 360, 380 [NASA ADS] [CrossRef] [Google Scholar]
- Blustin, A. J., Branduardi-Raymont, G., Behar, E., et al. 2002, A&A, 392, 453 [NASA ADS] [CrossRef] [EDP Sciences] [Google Scholar]
- Boroson, T. A., & Meyers, K. A. 1992, ApJ, 397, 442 [NASA ADS] [CrossRef] [Google Scholar]
- Braatz, J. 2008, in A Decade of Dark Energy [Google Scholar]
- Braatz, J. A., & Gugliucci, N. E. 2008, ApJ, 678, 96 [NASA ADS] [CrossRef] [Google Scholar]
- Braatz, J. A., Wilson, A. S., & Henkel, C. 1996, ApJS, 106, 51 [NASA ADS] [CrossRef] [Google Scholar]
- Braatz, J. A., Wilson, A. S., & Henkel, C. 1997, ApJS, 110, 321 [NASA ADS] [CrossRef] [Google Scholar]
- Braatz, J. A., Wilson, A. S., Henkel, C., Gough, R., & Sinclair, M. 2003, ApJS, 146, 249 [NASA ADS] [CrossRef] [Google Scholar]
- Braatz, J. A., Henkel, C., Greenhill, L. J., Moran, J. M., & Wilson, A. S. 2004, ApJ, 617, L29 [NASA ADS] [CrossRef] [Google Scholar]
- Braito, V., Franceschini, A., Della Ceca, R., et al. 2003, A&A, 398, 107 [NASA ADS] [CrossRef] [EDP Sciences] [Google Scholar]
- Buchanan, C. L., Gallimore, J. F., O’Dea, C. P., et al. 2006, AJ, 132, 401 [NASA ADS] [CrossRef] [Google Scholar]
- Cappi, M., Panessa, F., Bassani, L., et al. 2006, A&A, 446, 459 [NASA ADS] [CrossRef] [EDP Sciences] [Google Scholar]
- Claussen, M. J., & Lo, K. 1986, ApJ, 308, 592 [NASA ADS] [CrossRef] [Google Scholar]
- Dahari, O., & De Robertis, M. M. 1988, ApJS, 67, 249 [NASA ADS] [CrossRef] [Google Scholar]
- de Grijp, M. H. K., Keel, W. C., Miley, G. K., Goudfrooij, P., & Lub, J. 1992, A&AS, 96, 389 [NASA ADS] [Google Scholar]
- Deo, R. P., Crenshaw, D. M., Kraemer, S. B., et al. 2007, ApJ, 671, 124 [NASA ADS] [CrossRef] [Google Scholar]
- Deo, R. P., Richards, G. T., Crenshaw, D. M., & Kraemer, S. B. 2009, ApJ, 705, 14 [NASA ADS] [CrossRef] [Google Scholar]
- di Serego Alighieri, S., Cimatti, A., Fosbury, R. A. E., & Hes, R. 1997, A&A, 328, 510 [NASA ADS] [Google Scholar]
- Done, C., Madejski, G. M., Życki, P. T., & Greenhill, L. J. 2003, ApJ, 588, 763 [NASA ADS] [CrossRef] [Google Scholar]
- Elitzur, M. 2002, in Cosmic Masers: From Proto-Stars to Black Holes, ed. V. Migenes, & M. J. Reid, IAU Symp., 206, 452 [Google Scholar]
- Genzel, R., Lutz, D., Sturm, E., et al. 1998, ApJ, 498, 579 [NASA ADS] [CrossRef] [Google Scholar]
- Gondoin, P., Barr, P., Lumb, D., et al. 2001, A&A, 378, 806 [NASA ADS] [CrossRef] [EDP Sciences] [Google Scholar]
- Gondoin, P., Orr, A., Lumb, D., & Santos-Lleo, M. 2002, A&A, 388, 74 [NASA ADS] [CrossRef] [EDP Sciences] [Google Scholar]
- Gondoin, P., Orr, A., & Lumb, D. 2003a, A&A, 398, 967 [NASA ADS] [CrossRef] [EDP Sciences] [Google Scholar]
- Gondoin, P., Orr, A., Lumb, D., & Siddiqui, H. 2003b, A&A, 397, 883 [NASA ADS] [CrossRef] [EDP Sciences] [Google Scholar]
- González-Martín, O., Masegosa, J., Márquez, I., Guerrero, M. A., & Dultzin-Hacyan, D. 2006, A&A, 460, 45 [NASA ADS] [CrossRef] [EDP Sciences] [Google Scholar]
- Greenhill, L. J., Moran, J. M., Reid, M. J., et al. 1990, ApJ, 364, 513 [NASA ADS] [CrossRef] [Google Scholar]
- Greenhill, L. J., Moran, J. M., Reid, M. J., Menten, K. M., & Hirabayashi, H. 1993, ApJ, 406, 482 [NASA ADS] [CrossRef] [Google Scholar]
- Greenhill, L. J., Henkel, C., Becker, R., Wilson, T. L., & Wouterloot, J. G. A. 1995, A&A, 304, 21 [NASA ADS] [Google Scholar]
- Greenhill, L. J., Herrnstein, J. R., Moran, J. M., Menten, K. M., & Velusamy, T. 1997, ApJ, 486, L15 [NASA ADS] [CrossRef] [Google Scholar]
- Greenhill, L. J., Ellingsen, S. P., Norris, R. P., et al. 2002, ApJ, 565, 836 [NASA ADS] [CrossRef] [Google Scholar]
- Greenhill, L. J., Tilak, A., & Madejski, G. 2008, ApJ, 686, L13 [NASA ADS] [CrossRef] [Google Scholar]
- Gu, Q., Melnick, J., Fernandes, R. C., et al. 2006, VizieR Online Data Catalog, 736, 60480 [NASA ADS] [Google Scholar]
- Guainazzi, M., Matt, G., & Perola, G. C. 2005, A&A, 444, 119 [NASA ADS] [CrossRef] [EDP Sciences] [Google Scholar]
- Haas, M., Siebenmorgen, R., Schulz, B., Krügel, E., & Chini, R. 2005, A&A, 442, L39 [NASA ADS] [CrossRef] [EDP Sciences] [Google Scholar]
- Hagiwara, Y., Diamond, P. J., & Miyoshi, M. 2002, A&A, 383, 65 [NASA ADS] [CrossRef] [EDP Sciences] [Google Scholar]
- Hagiwara, Y., Diamond, P. J., Miyoshi, M., Rovilos, E., & Baan, W. 2003, MNRAS, 344, L53 [NASA ADS] [CrossRef] [Google Scholar]
- Haschick, A. D., & Baan, W. A. 1985, Nature, 314, 144 [NASA ADS] [CrossRef] [Google Scholar]
- Heckman, T. M., Crane, P. C., & Balick, B. 1980, A&AS, 40, 295 [NASA ADS] [Google Scholar]
- Heckman, T. M., Ptak, A., Hornschemeier, A., & Kauffmann, G. 2005, ApJ, 634, 161 [NASA ADS] [CrossRef] [Google Scholar]
- Henkel, C. 2008, in A Decade of Dark Energy [Google Scholar]
- Henkel, C., Guesten, R., Downes, D., et al. 1984, A&A, 141, L1 [NASA ADS] [Google Scholar]
- Henkel, C., Wouterloot, J. G. A., & Bally, J. 1986, A&A, 155, 193 [NASA ADS] [Google Scholar]
- Henkel, C., Wang, Y. P., Falcke, H., Wilson, A. S., & Braatz, J. A. 1998, A&A, 335, 463 [NASA ADS] [Google Scholar]
- Henkel, C., Peck, A. B., Tarchi, A., et al. 2005, A&A, 436, 75 [NASA ADS] [CrossRef] [EDP Sciences] [Google Scholar]
- Herrnstein, J. R., Moran, J. M., Greenhill, L. J., et al. 1999, Nature, 400, 539 [NASA ADS] [CrossRef] [Google Scholar]
- Hes, R., Barthel, P. D., & Fosbury, R. A. E. 1996, A&A, 313, 423 [NASA ADS] [Google Scholar]
- Ho, L. C. 2005, ApJ, 629, 680 [NASA ADS] [CrossRef] [Google Scholar]
- Ho, L. C., Filippenko, A. V., & Sargent, W. L. 1995, ApJS, 98, 477 [NASA ADS] [CrossRef] [Google Scholar]
- Ho, L. C., Filippenko, A. V., & Sargent, W. L. W. 1997, ApJS, 112, 315 [NASA ADS] [CrossRef] [Google Scholar]
- Holczer, T., Behar, E., & Kaspi, S. 2007, ApJ, 663, 799 [NASA ADS] [CrossRef] [Google Scholar]
- Huchra, J., & Burg, R. 1992, ApJ, 393, 90 [NASA ADS] [CrossRef] [Google Scholar]
- Immler, S., Brandt, W. N., Vignali, C., et al. 2003, AJ, 126, 153 [NASA ADS] [CrossRef] [Google Scholar]
- Iyomoto, N., Makishima, K., Fukazawa, Y., et al. 1996, PASJ, 48, 231 [NASA ADS] [Google Scholar]
- Kewley, L. J., Heisler, C. A., Dopita, M. A., & Lumsden, S. 2001, ApJS, 132, 37 [NASA ADS] [CrossRef] [Google Scholar]
- Kim, D., Sanders, D. B., Veilleux, S., Mazzarella, J. M., & Soifer, B. T. 1995, ApJS, 98, 129 [NASA ADS] [CrossRef] [Google Scholar]
- Kondratko, P. T., Greenhill, L. J., & Moran, J. M. 2006a, ApJ, 652, 136 [NASA ADS] [CrossRef] [Google Scholar]
- Kondratko, P. T., Greenhill, L. J., Moran, J. M., et al. 2006b, ApJ, 649, 561 [NASA ADS] [CrossRef] [Google Scholar]
- Lamastra, A., Bianchi, S., Matt, G., et al. 2009, A&A, 504, 73 [NASA ADS] [CrossRef] [EDP Sciences] [Google Scholar]
- Lawson, A. J., & Turner, M. J. L. 1997, MNRAS, 288, 920 [NASA ADS] [CrossRef] [Google Scholar]
- Levenson, N. A., Heckman, T. M., Krolik, J. H., Weaver, K. A., & Życki, P. T. 2006, ApJ, 648, 111 [NASA ADS] [CrossRef] [Google Scholar]
- Lo, K. Y. 2005, ARA&A, 43, 625 [NASA ADS] [CrossRef] [Google Scholar]
- Lumsden, S. L., & Alexander, D. M. 2001, MNRAS, 328, L32 [NASA ADS] [CrossRef] [Google Scholar]
- Lumsden, S. L., Alexander, D. M., & Hough, J. H. 2004, MNRAS, 348, 1451 [NASA ADS] [CrossRef] [Google Scholar]
- Maiolino, R., & Rieke, G. H. 1995, ApJ, 454, 95 [NASA ADS] [CrossRef] [Google Scholar]
- Malizia, A., Landi, R., Bassani, L., et al. 2007, ApJ, 668, 81 [NASA ADS] [CrossRef] [Google Scholar]
- Matsumoto, C., Nava, A., Maddox, L. A., et al. 2004, ApJ, 617, 930 [NASA ADS] [CrossRef] [Google Scholar]
- Matt, G., Perola, G. C., Fiore, F., et al. 2000, A&A, 363, 863 [NASA ADS] [Google Scholar]
- Meléndez, M., Kraemer, S. B., Armentrout, B. K., et al. 2008a, ApJ, 682, 94 [NASA ADS] [CrossRef] [Google Scholar]
- Meléndez, M., Kraemer, S. B., Schmitt, H. R., et al. 2008b, ApJ, 689, 95 [NASA ADS] [CrossRef] [Google Scholar]
- Miniutti, G., Ponti, G., Dadina, M., Cappi, M., & Malaguti, G. 2007, MNRAS, 375, 227 [NASA ADS] [CrossRef] [Google Scholar]
- Moustakas, J., & Kennicutt, Jr., R. C., 2006, ApJS, 164, 81 [NASA ADS] [CrossRef] [Google Scholar]
- Mulchaey, J. S., Koratkar, A., Ward, M. J., et al. 1994, ApJ, 436, 586 [NASA ADS] [CrossRef] [Google Scholar]
- Nakai, N., Inoue, M., Miyazawa, K., Miyoshi, M., & Hall, P. 1995, PASJ, 47, 771 [NASA ADS] [Google Scholar]
- Nandra, K., O’Neill, P. M., George, I. M., & Reeves, J. N. 2007, MNRAS, 382, 194 [NASA ADS] [CrossRef] [Google Scholar]
- Nenkova, M., Sirocky, M. M., Ivezić, Ž., & Elitzur, M. 2008, ApJ, 685, 147 [NASA ADS] [CrossRef] [Google Scholar]
- Netzer, H., Mainieri, V., Rosati, P., & Trakhtenbrot, B. 2006, A&A, 453, 525 [NASA ADS] [CrossRef] [EDP Sciences] [Google Scholar]
- Oliva, E., Salvati, M., Moorwood, A. F. M., & Marconi, A. 1994, A&A, 288, 457 [NASA ADS] [Google Scholar]
- Panessa, F., Bassani, L., Cappi, M., et al. 2006, A&A, 455, 173 [NASA ADS] [CrossRef] [EDP Sciences] [Google Scholar]
- Perola, G. C., Matt, G., Fiore, F., et al. 2000, A&A, 358, 117 [NASA ADS] [Google Scholar]
- Perola, G. C., Matt, G., Cappi, M., et al. 2002, A&A, 389, 802 [Google Scholar]
- Phillips, M. M., Charles, P. A., & Baldwin, J. A. 1983, ApJ, 266, 485 [NASA ADS] [CrossRef] [Google Scholar]
- Polletta, M., Bassani, L., Malaguti, G., Palumbo, G. G. C., & Caroli, E. 1996, ApJS, 106, 399 [NASA ADS] [CrossRef] [Google Scholar]
- Ramolla, M. 2009, Middle-Infrared Spectroscopy of Seyfert Galaxies, Diploma Thesis, Ruhr-Universität Bochum [Google Scholar]
- Rao, A. R., Singh, K. P., & Vahia, M. N. 1992, MNRAS, 255, 197 [NASA ADS] [Google Scholar]
- Reeves, J. N., & Turner, M. J. L. 2000, MNRAS, 316, 234 [NASA ADS] [CrossRef] [Google Scholar]
- Reynolds, C. S. 1997, MNRAS, 286, 513 [NASA ADS] [CrossRef] [Google Scholar]
- Risaliti, G. 2002, A&A, 386, 379 [NASA ADS] [CrossRef] [EDP Sciences] [Google Scholar]
- Risaliti, G., Gilli, R., Maiolino, R., & Salvati, M. 2000, A&A, 357, 13 [NASA ADS] [Google Scholar]
- Rush, B., & Malkan, M. A. 1993, in BAAS, 25, 1362 [Google Scholar]
- Sato, N., Yamauchi, A., Ishihara, Y., et al. 2005, PASJ, 57, 587 [NASA ADS] [Google Scholar]
- Schmitt, H. R., Donley, J. L., Antonucci, R. R. J., Hutchings, J. B., & Kinney, A. L. 2003, ApJS, 148, 327 [NASA ADS] [CrossRef] [Google Scholar]
- Schweitzer, M., Lutz, D., Sturm, E., et al. 2006, ApJ, 649, 79 [NASA ADS] [CrossRef] [Google Scholar]
- Severgnini, P., Risaliti, G., Marconi, A., Maiolino, R., & Salvati, M. 2001, A&A, 368, 44 [NASA ADS] [CrossRef] [EDP Sciences] [Google Scholar]
- Shang, Z., Wills, B. J., Wills, D., & Brotherton, M. S. 2007, AJ, 134, 294 [NASA ADS] [CrossRef] [Google Scholar]
- Sharples, R. M., Longmore, A. J., Hawarden, T. G., & Carter, D. 1984, MNRAS, 208, 15 [NASA ADS] [CrossRef] [Google Scholar]
- Shinozaki, K., Miyaji, T., Ishisaki, Y., Ueda, Y., & Ogasaka, Y. 2006, AJ, 131, 2843 [NASA ADS] [CrossRef] [Google Scholar]
- Shu, X. W., Wang, J. X., Jiang, P., Fan, L. L., & Wang, T. G. 2007, ApJ, 657, 167 [NASA ADS] [CrossRef] [Google Scholar]
- Smith, D. A., & Wilson, A. S. 2001, ApJ, 557, 180 [NASA ADS] [CrossRef] [Google Scholar]
- Smith, J. D. T., & Draine, B. T. 2008, PAHFIT web description, http://tir.astro.utoledo.edu/jdsmith/research/pahfit.php [Google Scholar]
- Smith, J. D. T., Draine, B. T., Dale, D. A., et al. 2007, ApJ, 656, 770 [NASA ADS] [CrossRef] [Google Scholar]
- Spinoglio, L., & Malkan, M. A. 1989, ApJ, 342, 83 [NASA ADS] [CrossRef] [Google Scholar]
- Storchi-Bergmann, T., Kinney, A. L., & Challis, P. 1995, ApJS, 98, 103 [NASA ADS] [CrossRef] [Google Scholar]
- Strickland, D. K., Heckman, T. M., Colbert, E. J. M., Hoopes, C. G., & Weaver, K. A. 2004, ApJS, 151, 193 [NASA ADS] [CrossRef] [Google Scholar]
- Terashima, Y., Iyomoto, N., Ho, L. C., & Ptak, A. F. 2002, ApJS, 139, 1 [CrossRef] [Google Scholar]
- Tilak, A., Greenhill, L. J., Done, C., & Madejski, G. 2008, ApJ, 678, 701 [NASA ADS] [CrossRef] [Google Scholar]
- Tommasin, S., Spinoglio, L., Malkan, M. A., & Fazio, G. 2010, ApJ, 709, 1257 [NASA ADS] [CrossRef] [Google Scholar]
- Tran, H. D. 2003a, ApJ, 583, 632 [NASA ADS] [CrossRef] [Google Scholar]
- Tran, H. T. 2003b, New Astron. Rev., 47, 1091 [NASA ADS] [CrossRef] [Google Scholar]
- Turner, T. J., & Pounds, K. A. 1989, MNRAS, 240, 833 [NASA ADS] [CrossRef] [Google Scholar]
- Turner, T. J., George, I. M., Nandra, K., & Mushotzky, R. F. 1997, ApJS, 113, 23 [NASA ADS] [CrossRef] [Google Scholar]
- Ueda, Y., Ishisaki, Y., Takahashi, T., Makishima, K., & Ohashi, T. 2005, ApJS, 161, 185 [NASA ADS] [CrossRef] [Google Scholar]
- Ueno, S., Ward, M. J., O’Brien, P. T., Stirpe, G. M., & Matt, G. 2000, Adv. Space Res., 25, 823 [NASA ADS] [CrossRef] [Google Scholar]
- Vaceli, M. S., Viegas, S. M., Gruenwald, R., & de Souza, R. E. 1997, AJ, 114, 1345 [NASA ADS] [CrossRef] [Google Scholar]
- Véron-Cetty, M., & Véron, P. 2006, A&A, 455, 773 [NASA ADS] [CrossRef] [EDP Sciences] [Google Scholar]
- Verrecchia, F., in’t Zand, J. J. M., Giommi, P., et al. 2007, A&A, 472, 705 [NASA ADS] [CrossRef] [EDP Sciences] [Google Scholar]
- Whittle, M. 1992, ApJS, 79, 49 [NASA ADS] [CrossRef] [Google Scholar]
- Whittle, M., & Wilson, A. S. 2004, AJ, 127, 606 [NASA ADS] [CrossRef] [Google Scholar]
- Zhang, J. S., & Fan, J. H. 2009, Sci. Chin., 52, G6, 960 [Google Scholar]
- Zhang, J. S., Henkel, C., Kadler, M., et al. 2006, A&A, 450, 933 [NASA ADS] [CrossRef] [EDP Sciences] [Google Scholar]
- Zhang, J. S., Henkel, C., Guo, Q., Wang, H. G., & Fan, J. H. 2010, ApJ, 708, 1528 [NASA ADS] [CrossRef] [Google Scholar]
All Tables
Documentation of how far the three samples (of 163 sources in total) match and complement each other.
The average values and standard deviations of the logarithmic luminosity ratios for each subset of Seyfert galaxies.
All Figures
|
Fig. 1 Observed 2–10 keV X-ray versus [O IV] line luminosity. Blue stars represent Sy1s (Sy 1.0–1.5), red circles Sy2s (Sy 1.8–2.0). Filled symbols are masers, open symbols are non-masers. The dotted lines mark fixed LX/L [O IV] ratios of 1000; 100; 10; 1; 0.1 (from top to bottom). The error-bar in the lower right corner is the average relative error of all [O IV] measurements. |
| In the text | |
|
Fig. 2 Histogram of the LX/L [O IV] ratio of the data points shown in Fig. 1. The red dashed line represents Sy2 non-masers, whereas the blue thick line represents the Sy1 non-masers. The maser-detections are represented by the dashed surfaces – blue and vertically dashed for Sy1, red and horizontally dashed for Sy2. The one upper limit is excluded. |
| In the text | |
|
Fig. 3 Observed X-ray versus [O IV] line flux. Symbols and colors are as in Fig. 1. The dotted lines mark fixed flux ratios of 1000; 100; 10; 1; 0.1 (from top to bottom). The error bar in the lower right corner is the average relative error in all [O IV] measurements. |
| In the text | |
|
Fig. 4 [O IV] flux histogram of Sy2 masers for absorbed sources from Fig. 3 with LX/L [O IV] < 10. Masers are represented by the shaded area, non-masers by the thick dashed histogram. |
| In the text | |
|
Fig. 5 Histogram of the 7 μm continuum to [O IV] line ratio. Legend as in Fig. 2.All 21 upper limits from Table 3 are excluded. |
| In the text | |
|
Fig. 6 Distribution of [O III] 5007 Å versus [O IV] 25.9 μm luminosity. Symbols are as in Fig. 1. The dotted lines mark fixed ratios 10; 1; 0.1; 0.01 (from top to bottom).The error bar in the lower right corner is the average relative error of all [O IV] measurements. |
| In the text | |
|
Fig. 7 Histogram of the [O III] to [O IV] ratio. Legend as in Fig. 2. Five upper limits are excluded. |
| In the text | |
|
Fig. 8 Observed 2–10 keV X-rays plotted against [O IV] line luminosity. Sy1 masers are represented by blue stars and Sy2 masers by red dots. Off-sample Sy2 masers are marked with black dots. The dotted lines mark fixed flux ratios of 1000; 100; 10; 1; 0.1 (from top to bottom). The error bar in the lower right corner is the average relative error of all [O IV] measurements. |
| In the text | |
|
Fig. 9 Maser H2O versus [O IV] luminosity.Symbols and colors are as in Fig. 8. The dotted lines mark fixed ratios 10-4; 10-5; 10-6; 10-7 (from top to bottom). For comparison, the expected position of the z = 0.66 maser SDSSJ0804+3607 is marked with a black dot and a gray bar covering the range 0.1 × L [O III] < L [O IV] < 100 × L [O III] assumed from Fig. 6. |
| In the text | |
Current usage metrics show cumulative count of Article Views (full-text article views including HTML views, PDF and ePub downloads, according to the available data) and Abstracts Views on Vision4Press platform.
Data correspond to usage on the plateform after 2015. The current usage metrics is available 48-96 hours after online publication and is updated daily on week days.
Initial download of the metrics may take a while.