Fig. 8
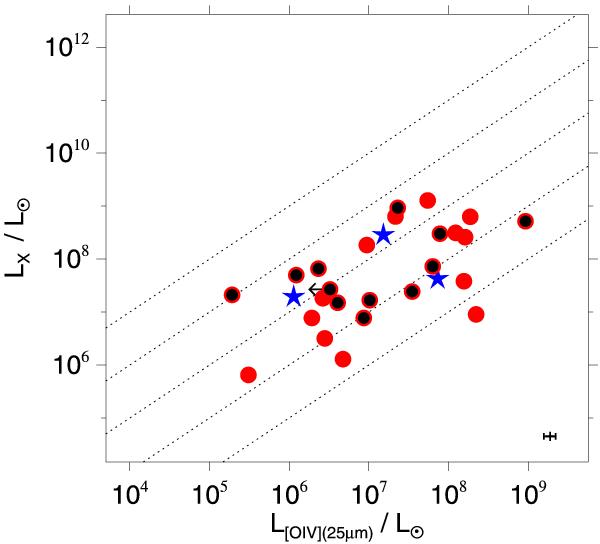
Observed 2–10 keV X-rays plotted against [O IV] line luminosity. Sy1 masers are represented by blue stars and Sy2 masers by red dots. Off-sample Sy2 masers are marked with black dots. The dotted lines mark fixed flux ratios of 1000; 100; 10; 1; 0.1 (from top to bottom). The error bar in the lower right corner is the average relative error of all [O IV] measurements.
Current usage metrics show cumulative count of Article Views (full-text article views including HTML views, PDF and ePub downloads, according to the available data) and Abstracts Views on Vision4Press platform.
Data correspond to usage on the plateform after 2015. The current usage metrics is available 48-96 hours after online publication and is updated daily on week days.
Initial download of the metrics may take a while.