Fig. 2
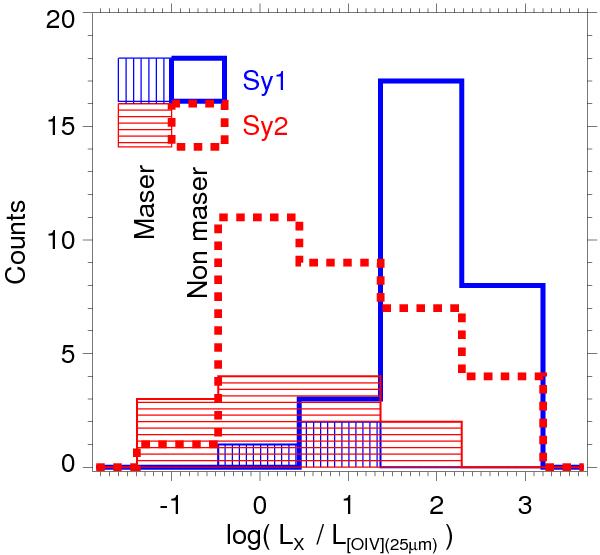
Histogram of the LX/L [O IV] ratio of the data points shown in Fig. 1. The red dashed line represents Sy2 non-masers, whereas the blue thick line represents the Sy1 non-masers. The maser-detections are represented by the dashed surfaces – blue and vertically dashed for Sy1, red and horizontally dashed for Sy2. The one upper limit is excluded.
Current usage metrics show cumulative count of Article Views (full-text article views including HTML views, PDF and ePub downloads, according to the available data) and Abstracts Views on Vision4Press platform.
Data correspond to usage on the plateform after 2015. The current usage metrics is available 48-96 hours after online publication and is updated daily on week days.
Initial download of the metrics may take a while.