| Issue |
A&A
Volume 529, May 2011
|
|
|---|---|---|
| Article Number | A16 | |
| Number of page(s) | 13 | |
| Section | Extragalactic astronomy | |
| DOI | https://doi.org/10.1051/0004-6361/201015984 | |
| Published online | 22 March 2011 | |
γ-rays in flat-spectrum AGN: revisiting the fast jet hypothesis with the CJF sample
1
Max-Planck-Institut für Radioastronomie, Auf dem Hügel 69, 53121 Bonn, Germany
e-mail: This email address is being protected from spambots. You need JavaScript enabled to view it.
2
I.Physikalisches Institut, Universität zu Köln, Zülpicher Str. 77, 50937 Köln, Germany
Received: 23 October 2010
Accepted: 2 February 2011
Abstract
Context. The recent release of the First Fermi-LAT Source Catalog solidified the predominant association of extragalactic γ-ray emitters to active galaxies, in particular blazars. A tight connection between AGN jet kinematics and γ-ray properties has been argued for, attributing the energetic emission from active galaxies to their highly relativistic outflows.
Aims. We investigate the Caltech-Jodrell Bank flat-spectrum (CJF) sample to study the connection between AGN jet kinematics and their γ-ray properties. The high number of sources included in the sample, in addition to the excellent kinematic data available, allows us to investigate the origin of γ-ray emission in AGN.
Methods. We identify the CJF sources detected in γ-rays (by Fermi-LAT and EGRET). We use γ-ray luminosities and the available VLBI kinematic data to look for correlations between γ-ray and kinematic properties, as well as for differences between AGN classes (quasars, BL Lacs, radio galaxies). We also check the kinematics of the TeV sources in the CJF.
Results. 21.8% of the CJF has been detected in the γ-ray regime. We find the detectability of BL Lacs significantly higher compared to quasars. Sources detected in the γ-rays show a wider apparent jet velocity distribution compared to the non-detected ones, but the maxima of both distributions are at similar values. No strong link between γ-ray detectability and fast apparent jet speeds is found. A tentative correlation is found between γ-ray luminosity and maximum apparent jet speeds, stronger for BL Lac and γ-variable sources. We find non-radial jet motions to be important to γ-ray emission. We suggest two-zone, spine-sheath models as a possible explanation for our results. Two out of four CJF TeV sources show superluminal jet speeds, in contrast to previous studies.
Key words: galaxies: statistics / galaxies: active / galaxies: nuclei / galaxies: jets / gamma rays: galaxies
Member of the International Max Planck Research School (IMPRS) for Astronomy and Astrophysics at the Universities of Bonn and Cologne.
© ESO, 2011
1. Introduction
Active galactic nuclei (AGN) are known for their emission over a broad range of the electromagnetic spectrum, reaching up to energy scales of 1012 eV (e.g., Punch et al. 1992; Neshpor et al. 1998). This high-energy end of the AGN spectrum is most probably created by inverse Compton scattering (either of the incident synchrotron photon field, self-scattering (SSC) of photons arising from the accretion disk, or of cosmic microwave background) from a population of relativistic electrons in the AGN jets (e.g., Blandford & Icke 1978; Ghisellini et al. 1985; Maraschi et al. 1992; Sikora et al. 1994). Acceleration mechanisms, including acceleration from electric fields and acceleration in shocks, can boost the energy of the electron population in a way that γ-ray emission can be efficiently produced through inverse Compton scattering. The variability observed at these short wavelengths adds another layer of complexity (e.g., Hoyle 1966) and may require special geometrical and physical configurations to be explained (e.g., Georganopoulos et al. 2005; Tavecchio & Ghisellini 2008).
Most γ-ray radiation is shielded away from us by the Earth’s atmosphere, except for very high-energy (TeV) photons that produce atmospheric particle showers that can be detected and analyzed by Cherenkov telescopes. The launch of γ-ray satellites like the Compton γ-ray Observatory satellite (Gehrels et al. 1993; carrying the Energetic Gamma Ray Experiment Telescope, EGRET; Kanbach et al. 1988), the AGILE satellite (Tavani et al. 2008), and the Fermi γ-ray Space Telescope (Atwood et al. 2009) allow a detailed study of the γ-ray sky. In particular, the Fermi telescope offers the possibility of a continuous all-sky monitoring (using the Large Area Telescope, LAT) at much higher resolution and sensitivity than those of previous instruments. There are 1451 sources included in the first source catalog of the Fermi-LAT (Abdo et al. 2010a), 687 of which are identified/associated with active galaxies. Of these, 671 Fermi-LAT detected sources at high galactic latitudes (|b| > 10°) are included in the first catalog of active galactic nuclei (Abdo et al. 2010b), associated with 709 AGN (multiple associations for some sources), comprising 300 BL Lac objects, 296 flat-spectrum radio quasars, 41 AGN of other type, and 72 of unknown class.
Of particular interest is the connection between the γ-ray and radio properties of AGN and the possibly common Doppler factor for both the radio and γ-ray emitting particles. The distribution of radio spectral indices of the Fermi-LAT detected AGN is consistent with a flat spectrum, although a minor tail of steeper spectrum sources exists (see Fig. 28 in Abdo et al. 2010b), indicating the dominance of core-dominated sources as γ-ray emitters and reflecting the importance of the beaming effect for the production of this high-energy emission. The existence of a population of steeper spectrum sources, also detected by the Fermi-LAT, implies a more complex link between the γ and radio properties of AGN.
Lister et al. (2009b) study the kinematic properties of the 3-month Fermi-LAT detected sources of the MOJAVE sample. The authors find that γ-ray detected quasars show on average faster jets than their non-detected counterparts, in agreement with previous studies of EGRET-detected sources, which showed that γ-ray detected sources have preferentially higher Doppler beaming factors (e.g., Jorstad et al. 2001; Kellermann et al. 2004). They also note that BL Lac sources show on average lower apparent speeds but are nevertheless preferentially detected by Fermi-LAT. They attribute this behavior to the spectral shape of BL Lacs and the possibility that BL Lacs have a higher intrinsic γ-ray-to-radio luminosity ratio than flat-spectrum QSOs, concluding that these results merit further investigation.
We use the Caltech-Jodrell Bank flat-spectrum (CJF; Taylor et al. 1996) sample of radio-loud AGN to test the putative connection between the γ-ray properties of AGN and their jet kinematics in light of the recent release of the first Fermi-LAT AGN source catalog (Abdo et al. 2010b) and in the context of the studies mentioned above. The paper is organized as follows: in Sect. 2 we describe the CJF sample, in Sect. 3 we present the available data, in Sect. 4 the data are analyzed and our results are presented, in Sect. 5 we discuss our results in the context of previous similar investigations, and we finally offer a summary and our conclusions in Sect. 6. Throughout the paper, we assume the cosmological parameters (from the first-year WMAP observations; Spergel et al. 2003) H0 = 71 km s-1 Mpc-1, ΩM = 0.27, and ΩΛ = 0.73.
2. The CJF sample
The CJF sample (Taylor et al. 1996) consists of 293 sources selected (see Table 1) from three different samples (for details see Britzen et al. 2007b). The sources span a large redshift range (see Fig. 1 in Britzen et al. 2008), with the farthest object being at a redshift z = 3.889 (1745+624; Hook et al. 1995) and the closest one at z = 0.0108 (1146+596; de Vaucouleurs 1991). The average redshift of the sample is zavg = 1.254, with zBLLac, avg = 0.546, zRG, avg = 0.554, and zQSO, avg = 1.489 for BL Lac objects, radio galaxies, and quasars, respectively. All objects have been observed with the VLBA and/or the global VLBI network. Each source has at least three epochs of observations and has been imaged and studied kinematically (Britzen et al. 1999; Britzen et al. 2007b, 2008). The X-ray properties have also been studied and were correlated with their VLBI properties (Britzen et al. 2007a). Finally, Karouzos et al. (2010) conduct a multi-wavelength study of the CJF in the context of the merger-driven evolution of galaxies.
The CJF sample and its properties.
The CJF offers an excellent tool to study AGN jet properties, given its large number of sources and the detailed investigation of the jet kinematics of all these sources. In light of the findings of Lister et al. (2009b), we are interested in investigating the putative connection between the γ-ray properties of the AGN in our sample and their jet kinematics, utilizing the extensive database of information already at our disposal (Britzen et al. 2007b; Britzen et al. 2008; Karouzos et al. 2011). We aim to distinguish the different effects that may contribute to defining the γ-ray properties of an AGN and assess their relative importance. In particular, we aim to test whether γ-ray detected AGN indeed show faster jets than their non-detected counterparts. We will also investigate the jet ridge-line properties of the γ-ray detected sources, in relation to those of the non-detected ones (a detailed treatment of the CJF jet ridge-lines will be presented in a separate paper).
3. Data
The CJF sample is a statistically complete sample with the selection criteria described in Sect. 2. Radio data are therefore available for all CJF sources, both single-dish (at several frequencies) and interferometric. In addition, all CJF sources have been observed by ROSAT (see Britzen et al. 2007b, for details). Finally, a substantial number of CJF sources has been recently detected in the γ-ray regime by the Fermi-LAT instrument. Below we describe the available radio and γ-ray data.
3.1. Radio emission
The CJF sample (Table 1) has been most extensively studied in the radio regime (e.g., Taylor et al. 1996; Pearson et al. 1998; Britzen et al. 1999; Vermeulen et al. 2003; Pollack et al. 2003; Lowe et al. 2007; Britzen et al. 2007a,b, 2008). Britzen et al. (2008) develop a localized method for calculating the bending of the jet associated with individual components. The maximum of the distribution of local angles is at zero degrees, although a substantial fraction shows some bending (0–40 degrees). A few sources exhibit sharp bends on the order of >50 degrees (see Fig. 13 in Britzen et al. 2008).
Britzen et al. (2008) present an extensive analysis of the CJF jet kinematics, uniformly analyze the interferometric data for each CJF source, identify individual components at each epoch, and study their kinematic behavior. Although the CJF sample consists mostly of blazars (i.e., presumably highly beamed sources), the kinematical study of the sample shows a large number of sources with stationary, subluminal, or, at best, mildly superluminal outward velocities (see e.g. Fig. 15 in Britzen et al. 2008). Combined with a number of sources that exhibit inward-moving components (e.g., 0600+422, 1751+441, 1543+517, Britzen et al. 2007b), these sources do not fit into the regular paradigm of outward, superluminaly moving components in blazar jets. This peculiar kinematic behavior can be readily explained by geometric effects, usually assuming a helical motion pattern combined with projection effects (e.g., Zensus et al. 1995; Steffen et al. 1995a,b; Lobanov & Roland 2005; Roland et al. 2008). Most of the CJF sources exhibit flux variability at different timescales, with several showing indications for quasi-periodicities in their radio lightcurves (see Karouzos et al. 2010, for details).
3.2. γ-ray emission
EGRET detected 14 CJF sources and provided an upper limit for 50 more (Fichtel et al. 1994; Hartman et al. 1999). Unlike for the radio and the X-rays, the γ-ray study of this sample is not complete because EGRET only made targeted observations of some of the CJF sources. Fermi-LAT (the renamed GLAST; Atwood et al. 2009) will provide a complete study of these sources through its all-sky survey. Sixty-one CJF sources are included in the first catalog of AGN by the Fermi-LAT after eleven months of observation (Abdo et al. 2010b). Three additional sources are included in the third EGRET catalog (Hartman et al. 1999) but have not, as of yet, been detected by Fermi (0804+499, 2346+385, and 2351+456).
In total, we find 64 sources (21.8% of the sample) that are detected in the γ-ray regime, while for 40 (13.6% of the sample) only an upper limit is reported from EGRET. Breaking down the number of detections, 24 of the 64 γ-ray detected sources are classified as BL Lacs, 32 as quasars, and 5 are radio galaxies. One γ-ray detected source remains unclassified. We mention here that there are 7 CJF sources detected by Fermi-LAT that have been classified differently by the Fermi-LAT team (see Table A.1). Three of these sources do not have kinematic data and therefore do not influence our result. For the remaining four, we retain the classification of Britzen et al. (2007a). Six CJF sources belong to the group of few sources that have been detected in the TeV regime (Table 3).
Of the 61 CJF sources already detected by Fermi-LAT (Table A.1) half are found to be γ-variable. In total, 31 sources (10.6%) have been detected to be variable. We note for the following analysis we only use real detections and exclude upper limits information.
The inclusion of a source in the LAT catalog and the flagging of a source as variable depends on a number of factors, the combination of which make the catalog incomplete. The flux of a source (both in radio and γ-rays), its spectral shape, and its position on the sky (e.g., near the galactic plane) influence its possible association with an AGN. Moreover, as has already been noted in Abdo et al. (2010b), for a source to be classified as variable it needs to have sufficiently high γ-ray flux. Subsequent catalogs will surely improve the current associations and consequentially increase the number of γ-ray bright AGN.
4. Analysis
We are interested in investigating a possible link between jet kinematics and γ-ray properties in the CJF sample. There are a couple of points that should be addressed before we do that. A first effect concerns the redshift distribution of our sources. Quasars show a redshift distribution peaking around z = 1.3, while the maximum of BL Lacs is around z = 0.2. In Fig. 1 we show the redshift distribution of the CJF sources detected in γ-rays. The distribution follows the distribution of the sample, with the highest γ-ray detected source at redshift z = 3.044. Secondly, the CJF sample predominantly contains quasars, and only a few percent of the sample are BL Lac objects and radio galaxies. This is a result of the selection criteria of the sample. 75% of the CJF BL Lacs have been detected by Fermi-LAT, while only 17% of the QSOs and 9.6% of the RGs are included in the first year AGN catalog of the telescope (Abdo et al. 2010b). Taking into account the number of QSOs at z < 1 (56 sources), we derive a γ-ray detectability of 16% for the CJF quasars which is, as expected, significantly lower than for BL Lacs.
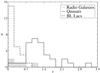 |
Fig. 1 Redshift distribution of the Fermi-LAT detected (1st Catalog; Abdo et al. 2010b) CJF sources. The three different classes of AGN are shown: BL Lacs (dashed empty line), quasars (continuous empty line), and radio galaxies (continuous filled line). |
4.1. γ-ray luminosities
γ-ray observations are based on photon counts per energy bin, unit surface, and unit time for each source. We are interested in translating the photon fluxes (at the energy interval of 1–100 GeV) to luminosities to account for the distance dependence. We follow Thompson et al. (1996) to calculate γ-ray luminosities as follows: assuming an energy range (E1,E2), the integral photon flux is described as
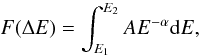 where A is a normalization constant that can be expressed in terms of the integral flux F, and α is the spectral index. For the Fermi-LAT instrument, a nominal value of 1–100 GeV is used for the probed energy range. Then, the energy flux is calculated from
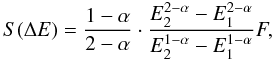 where F is the photon flux, the directly observed quantity (measured in photon counts per unit surface and time), and S is the energy flux (measured in ergs per unit surface and time). We use the median photon indices given in Abdo et al. (2010b) for each source. Within this energy range, a break in the spectrum may exist. This would lead to an overestimate of the luminosity, especially for the QSO sub-sample (e.g., Abdo et al. 2010c).
After calculating the source luminosities, we can calculate average and median values for our sample (shown in Table 2). A comparison of average and median values for non-Gaussian distributions is problematic. For the sake of continuity and uniformity with previous studies of the same topic we calculate both the average and median values, although they should be seen as only indicative and interpreted in tandem with results from statistical tests such as the K-S or Student’s test.
Taking into account only QSOs at redshifts lower than z = 1, we can calculate the average and median values (assuming a normal distribution for the samples studied here, the uncertainty for the median values is calculated as 1.253 of the standard error of the mean) for this sub-sample (47.09 ± 0.11 and 47.19 ± 0.14 erg, respectively; the values are given in the log (νLν) form). Evidently QSOs are consistently more luminous than the BL Lacs.
Characteristic statistic values of the γ-ray luminosity (in logarithmic scale, measured in erg/s) of the CJF sources detected in the γ-ray regime by Fermi-LAT.
The luminosity of a source at longer wavelengths may play a role in deciding its γ-ray properties. To that end, we compared the luminosities of the γ-ray detected and non-detected QSOs at z < 1, at 5 and 30 GHz (single dish), at optical (V band), and in the soft X-rays (data from Britzen et al. 2007b; Taylor et al. 1996, and references therein). The γ-ray detected sources are consistently more luminous in the radio and optical regime, but are fainter in the X-rays. As we mentioned above, up to soft X-rays the emission is thought to be produced by the synchrotron mechanism, and therefore γ-ray detected sources show a stronger synchrotron component than their non-detected counterparts. This may in turn be linked to the putative inverse Compton process that is usually employed to explain the production of γ-ray emission in AGN jets. Conversely, γ-ray detection of a source implies that the inverse Compton hump of its SED is shifted toward higher energies compared with non-detected sources. It is therefore to be expected that γ-ray detected sources are actually weaker in the soft X-rays than their non-detected counterparts. A larger sample of γ-ray detected sources, along with a closely matched (in terms of luminosity and redshift) control sample, is required to test this scenario.
For the relative importance of the synchrotron and inverse Compton components, we calculate the γ-ray-to-radio luminosity ratio for the γ-ray detected CJF sources (see Fig. 2).
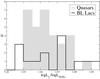 |
Fig. 2 Histogram comparing the distributions of γ-ray-to-radio luminosity ratios for BL Lacs and QSOs. We use γ-ray luminosities derived from the Fermi-LAT photon fluxes given in the first Fermi-LAT source catalog (Abdo et al. 2010a) and radio luminosities at 5 GHz derived from single-dish energy fluxes from Taylor et al. (1996). |
In Fig. 2 we show the distribution of this ratio for quasars and BL Lacs (including variable and non-variable sources). BL Lacs show marginally higher γ-ray-to-radio ratios than quasars, with the BL Lac distribution peaking around 1.075 compared with the quasar one peaking around 1.055. That we include both variable and non-variable sources may influence our results. Given the observational bias that sources classified as γ-variable are on average brighter than the non-variable ones and that there are more variable BL Lacs than non-variable ones, the effect observed in Fig. 2 may in part be due to the same observational bias discussed above. A two-sample K-S test for BL Lacs and quasars is inconclusive as to whether their γ-ray-to-radio ratio distributions are drawn from different parent distributions. An obvious caveat for this comparison is that γ-ray and radio observations are not contemporaneous.
4.2. Apparent VLBI jet component velocities and γ-ray emission
We characterize the kinematics of the CJF sources by the maximum observed component velocity, βapp, max, of each source. This maximum component velocity depends on both the orientation of the source (viewing angle) and the intrinsic properties of the jet itself. We investigated whether the distribution of maximum apparent component speeds differs between γ-ray detected and non-detected sources. For all CJF sources with available redshift, Britzen et al. (2008) have calculated the apparent total component velocities for all identified components in their VLBI jets. We identify the component with the maximum apparent speed in each source and plot the distribution of these maximum apparent speeds in Fig. 3, for γ-ray detected sources (black line) and non-detected ones (gray blocks).
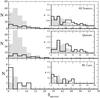 |
Fig. 3 Distribution of the maximum apparent velocities βapp, max for sources that have been detected in the γ-ray regime (black line) and for those that have not (gray blocks). We show the distributions for all sources (upper panel), quasars (middle panel), and BL Lacs (lower panel). The insets show the normalized-to-surface-area unity distributions for each case and for apparent speeds up to 30c. We used the kinematic data from Britzen et al. (2008). |
In the upper panel of Fig. 3 we plot the distribution of the maximum apparent velocities for the 191 CJF sources that have not been detected at γ-ray wavelengths (gray blocks) and the 45 sources that have (black line). The maximum of the distribution for the non-detections is found in the [3.5, 7] bin. For the detections the maximum lies in the [0, 3.5] bin. As can be seen in the inset of the upper panel (inset plots are normalized to the surface area one, because we are interested in the relative distributions of the two sub-samples), if smaller bins assumed, the maximum of the γ-ray detected sources breaks down to two maxima in the [0, 2] and [4, 6] bins. The non-detected source distribution is peaked in the [4, 6] bin. γ-ray detected sources have a more extended distribution toward higher velocities, and show a possible secondary peak in the [10, 12] and [12, 14] bins. A K-S test between γ-ray detected and non-detected source βapp, max distributions does not give a conclusive answer (93.7% confidence that the two sub-samples are different).
In the middle panel of Fig. 3 we show the same plots as before, but only for those sources classified as quasars (same notation as before). The distribution here is markedly different from before. Both populations (γ-ray detected and non-detected) have their distribution shifted toward higher velocities, and peak in the [4, 6] bin. The γ-ray detected QSOs show a possible secondary peak in the [10, 12] bin (secondary to primary ratio of 0.71) and again appear to show a higher fraction of the total number of sources at higher velocities. Non-detected quasars have a possible secondary peak in the [8, 10] bin (secondary to primary ratio of 0.8). The highest velocities for quasars are found in sources that have not been detected at γ-ray wavelengths. A K-S test gives a low probability (of 95.4%) that the two samples are significantly different. Similarly, in the lower panel of Fig. 3 we show the distributions (absolute and normalized) for BL Lac objects. Both γ-ray detected and non-detected BL Lacs have their distribution maxima in the [0, 2] bin, with γ-ray detected BL Lacs having a considerably more extended distribution, that reaches higher velocities, compared with their non-detected counterparts. Compared with quasars, the BL Lac velocity distribution is shifted toward lower values. A K-S test for the distribution of βapp, max for γ-ray detected quasars and BL Lacs gives a 97.7% probabilily that they are drawn from different parent samples. But the number of γ-ray detected BL Lacs with available redshift and kinematic information is small and therefore our analysis for BL Lacs is probably affected by low number statistics.
We also calculated the average and median values of the maximum apparent velocity for γ-ray detected CJF sources and for those not detected (9.0 ± 0.8 and 8.8 ± 1.0, compared to 8.1 ± 0.4 and 6.4 ± 0.5, respectively). A Student’s t-test is inconclusive (49% for the null hypothesis). Another note concerns the redshift distribution of the two sub-samples. The γ-ray detected sources have a lower average redshift (0.967) compared with their non-detected counterparts (1.175). It is known that there appears to be a dependence between apparent velocity and redshift (as noted by Cohen et al. 2007; Britzen et al. 2008; Lister et al. 2009a; Karouzos et al. 2011). This effect reinforces the difference in average and median values seen between γ-ray detected and non-detected sources and implies that γ-ray detected sources indeed have higher maximum apparent velocities.
Finally, for the γ-ray detected sources we distinguish between quasars and BL Lac objects. We find that quasars exhibit considerably higher average and median maximum apparent velocities (10.8 ± 1.0 and 10.2 ± 1.2, respectively, compared with 6.1 ± 1.5 and 2.9 ± 1.9). Redshift effects may again have influenced our results. We selected those QSOs at redshifts lower than 1 and calculated the βapp, max average and median values. We find that the sub-sample of local QSOs shows within the statistical errors the same average values as the BL Lacs (6.9 ± 1.2), but a considerably higher median value (6.1 ± 1.5).
In Fig. 4 we compare the βapp, max distribution of variable (27 sources; average redshift zavg = 0.94 ± 0.09) and non-variable (19 sources; average redshift zavg = 0.94 ± 0.10) γ-ray detected CJF sources. Below we refer to γ-ray variability, not taking into account possible variability in other wavelength regimes. Non-variable γ-ray detected sources show a more extended distribution than the variable ones, reaching the highest velocities (~30c). Both distributions show their main maximum in the [0, 3.5] bin. Variable sources show a possible secondary maximum in the [10.5, 14] bin (with a secondary to primary ratio of 0.86). A K-S test for the two distributions did not provide a conclusive result.
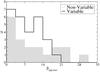 |
Fig. 4 Distribution of the maximum apparent velocities βapp, max for γ-ray detected sources that are variable (black line) and for those that are not (gray blocks). We used the kinematic data from Britzen et al. (2008). |
As in the previous cases, we again calculated the statistical properties of the two sub-samples. Variable γ-ray detected sources show a similar βapp, max average value to their non-variable counterparts, within the statistical errors (7.9 ± 0.8 and 8.9 ± 1.7, respectively). When checking the median values however, the variable sub-sample shows a substantially higher value than the non-variable one (8.6 ± 1.0, compared with 4.6 ± 2.1). Both sub-samples show similar redshift distributions, therefore we do not expect any redshift effect to influence our result.
In Fig. 5 we compare the βapp, max distributions of γ-ray detected, variable quasars and γ-ray detected, variable BL Lacs (left panel) and γ-ray detected variable quasars and γ-ray detected non-variable quasars (right panel). These two sub-samples (variable sources and quasar sources) are the largest of the different γ-ray detected sub-samples (e.g., non-variable sources, BL Lac sources, etc.) and were therefore chosen to check the differences between quasars and BL Lacs and their variability, in an isolated manner.
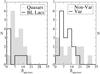 |
Fig. 5 Left panel: distributions of the maximum apparent velocities βapp, max for γ-variable BL Lacs (black line) quasars (gray blocks). Right panel: γ-variable (black line) and non-variable (gray blocks) quasars. We used the kinematic data from Britzen et al. (2008). |
We find that quasars (left panel of Fig. 5) show the maximum of their distribution at higher values than BL Lacs ([3.5, 7] bin compared to [0, 3.5]). Given the small number for each group of sources, a K-S test was not applied. For variable and non-variable sources the comparison is not straightforward (right panel of Fig. 5). Non-variable γ-ray detected quasars show a main maximum in the [0, 3.5] bin, lower than their variable counterparts. However, they also show a more extended distribution that reaches higher βapp, max values than their variable counterparts. A K-S test gives inconclusive results (23% probability that the sub-samples are the same). Small number statistics, as well as the biased detection of bright sources as variable, affect our results and therefore we cannot give a definitive answer concerning the relative importance of the two effects. There is evidence that γ-ray emitting, variable quasars show statistically higher apparent velocities.
The above analysis implies that there are two effects, which are possibly dependent, that correlate with the jet kinematic properties of γ-emitting AGN. These are the γ-variability and the classification of the source (BL Lac or quasar). The latter can be associated either to the difference in un-beamed luminosity between BL Lacs and quasars, or possibly to the difference in viewing angles (e.g., Lähteenmäki et al. 1999; Hovatta et al. 2009). We cannot robustly decouple these two effects for the number of sources available here. Given the available data, we do not find any significant connection between γ-ray detection and fast-moving jet components, as has been argued by other authors. We rather see that the βapp, max distribution is more strongly dependent on the type of object, i.e., BL Lac or quasar classification (see Sect. 5 for a discussion on this).
4.3. γ-ray luminosities and apparent jet-component velocities
In the previous section we probed the putative connection between the apparent brightness of γ-rays and the jet kinematics – i.e., the beaming mechanism, – as reflected in the differences between the βapp, max distribution of quasars and BL Lacs. Another way to approach this is by looking for a possible direct correlation between the apparent velocities measured in the AGN jets and their γ-ray luminosity. This is shown in Fig. 6.
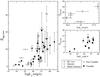 |
Fig. 6 Maximum apparent component velocities for all γ-ray detected CJF sources as a function of their γ-ray luminosity, for all sources (left panel) and for high-significance values of βapp,max (right panels; see text for details). We distinguish between γ-variable (filled symbols) and non-variable sources (open symbols), and between the different AGN classes, i.e., BL Lacs (circles), quasars (squares), and radio galaxies (diamonds). We used the kinematic data from Britzen et al. (2008). |
Apparently there is a correlation between the βapp, max of a source and its γ-ray luminosity. Variable sources appear to cluster closer to the implied trend, with non-variable QSOs deviating the most. We find Spearman correlation coefficients of 0.68 and 0.77 (both at a significance of >99.999%), respectively. Given the mutual dependence of luminosity and jet-component apparent velocity to the redshift of a source, we also calculated the Pearson product moment partial correlation coefficients r(Lγ βapp, max,z)1. While for the whole sample we obtained a relatively low partial correlation coefficient (0.43 at a significance of 99.8%), the correlation for variable sources persists (0.68 at a significance of >99.9%). Given the expected degree of scatter in the data, the correlation coefficients combined with the calculated significance imply that the trend seen in Fig. 6 is indeed true.
Some of the apparent velocities show relatively large errors, therefore, in the right panels of Fig. 6, we plot only sources for which βapp, max ≥ 3σ. We also separated the variable sources from non-variable ones. Clearly the non-variable sources show the most scatter. For the variable sources, we calculated a Spearman correlation coefficient of 0.69 (at a 99.1% significance level), which is lower than the coefficient we obtained when fitting all sources. Calculating the partial correlation coefficient for the same sub-sample gives a smaller correlation coefficient (0.61 at a 98.1% significance). We also investigated the same correlation for individual classes of objects. The strongest correlations are seen for both γ-variable BL Lacs (partial correlation coefficient of 0.68 at 95.1% significance) and quasars (partial correlation coefficient of 0.69 at 99.9% significance). The differences between the different classes of AGN, as well as between variable and non-variable sources reveal a complicated picture. We discuss the robustness and implications of our results more extensively in Sect. 5.
4.4. γ-ray and jet ridge-line properties
The currently accepted paradigm for the jet kinematics of flat-spectrum sources (i.e., core-dominated AGN) includes superluminaly outward-moving components, which are usually interpreted in the context of a specific projected geometry combined with relativistic effects, caused by the intrinsically high speeds of the bulk flow. Recent detailed kinematic studies of the parsec-scale jets of BL Lac objects (e.g., 1803+784, Britzen et al. 2010a; 0716+714, Britzen et al. 2009; 0735+178, Britzen et al. 2010b) have however revealed a rather different kinematic scheme for their jets: BL Lac jet components are predominantly stationary with respect to the core, but change their position angle significantly, which essentially reflects an important transverse component in their movement. In addition, their jet ridge lines, defined as the line that linearly connects the projected positions of all components at a certain epoch, show significant temporal evolution, at times forming very wide flow funnels. In an accompanying paper we present a statistical investigation of the jet ridge-lines of the CJF sources (Karouzos et al. 2011). We are interested in investigating a possible correlation between the jet ridge-line properties of a source and its appearance at γ-ray wavelengths. We therefore briefly outline the method used to analyze the CJF jet ridge lines. We can define three measures that probe the apparent radial and transverse motion of the jet ridge line of a source, (1) the jet ridge-line width, dP, (2) the jet ridge-line width evolution, ΔP, and (3) the linear evolution of the jet ridge line, Δℓ. The dP is defined as the position angle difference between the components with the maximum and minimum position angle at a given epoch, measured in degrees (see Fig. 7 for an example). The ΔP is derived between two successive epochs as the difference between the jet ridge-line widths at these epochs (measured in degrees per unit time). The Δℓ is derived as the sum of the linear displacements along the vector of their motion of all jet components across all available epochs (measured in parsecs per unit time and per component) and resembles an average component apparent speed across all epochs.
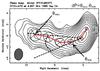 |
Fig. 7 Example of the definition of the jet width for the source 0700+470. With arrows we show the components with the minimum and maximum position angles at that epoch. The continuous line represents the jet ridge-line of 0700+470 (see the text for a definition) at the same epoch. Map from Britzen et al. (2007b). |
We compared these three measures of the jet ridge line properties for γ-ray detected and non-detected sources. We find that γ-ray detected sources show significantly wider jet ridge lines, both in average and median values (16.9 ± 1.0° and 11.1 ± 1.2°, respectively), compared with the non-detected ones (13.6 ± 0.4° and 9.3 ± 0.5°). A Student’s t-test gives a 97.6% probability that the two average values are significantly different. The difference between the two distributions is also clearly visible in the upper panel of Fig. 8: the maximum of the jet ridge-line width distribution of the γ-ray detected (non-variable) sources is shifted to higher values (in the [5, 10] bin) compared with their non-detected counterparts (which have their maximum in the [0, 5] bin).
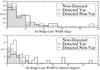 |
Fig. 8 Histograms of jet ridge-line apparent width, dP, and width evolution, ΔP, for γ-ray detected variables sources (continuous black line), γ-ray detected non-variable sources (dashed black line), and γ-ray non-detected sources (gray blocks). Given the large difference in absolute numbers, we plot histograms normalized to surface area unity. We used data from Karouzos et al. (2011). |
Jet morphology and kinematics of TeV-detected CJF sources.
Furthermore, γ-ray detected sources are found to show stronger evolution of their widths in their average and median values (4.7 ± 0.5 deg/yr and 2.5 ± 0.6 deg/yr, respectively) compared with their non-detected counterparts (3.13 ± 0.18 deg/yr and 2.26 ± 0.22 deg/yr). A Student’s t-test confirms at a 98.1% confidence that the two averages are significantly different. In the lower panel of Fig. 8 we show the normalized distribution of the width evolution values for γ-ray detected and non-detected sources. The γ-ray detected distribution is peaked in the [2, 3] bin compared with the non-detected one, which peaks in the [0, 1] bin.
We also distinguished between variable and non-variable γ-ray detected CJF sources and investigated their jet ridge-line width evolution in this context. Variable sources are found to have significantly stronger evolving jet ridge-line widths at a 4σ significance level in their average and median values (6.7 ± 1.0 and 4.4 ± 1.2 deg/yr, compared with 2.4 ± 0.3 and 2.2 ± 0.4 deg/yr). A Student’s t-test confirms this result (at a 98.8% confidence). In Fig. 8 (lower panel) we plot the distribution of γ-ray detected variable and non-variable sources. The non-variable source distribution is fairly confined to lower values, whereas variable sources extend up to the highest values of width evolution. This implies that viewing angle changes at parsec scales of AGN jets are linked to variability in the γ-ray regime, which reflects a possibly evolving jet at even smaller scales (connected to the timescales associated with γ-ray variability).
We finally compare how the jet ridge-line evolves in linear terms in γ-ray detected and non-detected sources, this time essentially looking for a possible link between γ-ray brightness of a source and its average jet component apparent speed instead of the maximum apparent speed. The redshift distributions of the two sub-samples are fairly similar. We therefore did not expect any redshift-induced effects related to linear distances to influence our results. We find that in the average and median values the two sub-samples show similar values of the linear evolution (0.47 ± 0.03 and 0.40 ± 0.04 pc/yr/comp, respectively, for the γ-ray detected sources, compared with 0.440 ± 0.020 and 0.377 ± 0.025 pc/yr/comp for the non-detected ones).
The same behavior is seen when comparing between γ-ray detected variable and non-variable sources. The median value for γ-ray detected variable sources is considerably higher than the one for non-variable sources (0.43 ± 0.04 pc/yr/comp compared with 0.291 ± 0.025 pc/yr/comp, respectively). This discrepancy between average and median values implies a large scattering within our data that may limit the robustness of our results. Aside from that, we confirm our finding from before, i.e., that the link between fast apparent jet speeds and the γ-ray detectability of a source is questionable. Apparently some other effect may play a more important role in defining the γ-ray properties of a source although there are certainly indications that higher speed sources are preferentially γ-ray emitters. Our results concerning the apparent width and width evolution comparison between γ-ray detected and non-detected sources imply that non-radial motion – i.e., motion transverse to the jet symmetry axis – is important for the γ-ray production. This is probably closely connected to the viewing angle effect, which is also reflected in the kinematic differences between different AGN types.
4.5. TeV sources
Twenty-eight extragalactic sources have been identified to be emitters in the TeV regime (for an updated list of these sources and references, see http://tevcat.uchicago.edu/). Six CJF sources (five BL Lac objects, one radio galaxy) are observed and detected in TeV. All are variable in γ-rays and optical, five in the infrared, while five of them are variable in radio and four in the X-rays.
Extremely high-energy photons coming from AGN (TeV sources, see Table A.1) can be a result of several different mechanisms, some of them taking place in the AGN jets (for a discussion on high-energy γ-ray emission from AGN see e.g., von Montigny et al. 1995). We checked the kinematics of the TeV sources in the CJF (Table 3; data from Britzen et al. 2008). We give the misalignment angle between the parsec and the kiloparsec scale (as calculated by Britzen et al. 2007a). We also list the bending of the parsec scale jet (as calculated by Britzen et al. 2008) for all identified components. Finally we give the maximum apparent total jet component speed, βapp, max. We find no apparent correlation between the bending of the jet and the γ-ray flux. Two out of five sources exhibit superluminal motion in their VLBI jets. Previous studies of TeV emitting high-frequency peaked BL Lacs exhibit slow jet speeds (e.g., Piner et al. 2008; Britzen et al. 2009). The sources 0219+428 and 2200+420 do not belong to that category of objects.
5. Discussion
It is interesting to compare our results with similar studies that used different samples of AGN. As we already mentioned in Sect. 1, a number of authors have claimed a close connection between γ-ray bright AGN and large βapp, max (e.g., Jorstad et al. 2001; Kellermann et al. 2004; Lister et al. 2009b). Lister et al. (2009b), in particular, examine the kinematic properties of the MOJAVE sources (Lister et al. 2009a) in light of the then recently published 3-month bright AGN Fermi-LAT list. In short, they find that the γ-ray detected MOJAVE quasars have the peak of their βapp, max distribution around 10–15c, quite a higher value compared with the non-detected ones (~5c). They also find that γ-variable sources show higher apparent speeds. Finally, although BL Lacs in their sample have lower redshifts and slow median jet speeds (6c), they are preferentially detected by Fermi-LAT. Similarly to Lister et al. (2009b), Jorstad et al. (2001) and Kellermann et al. (2004) also conclude that γ-ray detected AGN have significantly higher apparent speeds than their non-detected counterparts.
The results presented here are somewhat different. Although we do find a possible secondary maximum around 10–15c for the γ-ray detected sources, the primary maximum of both distributions appears to be around 5c, and γ-ray detected sources actually show a double maximum in the [0, 2] and [4, 6] bins. The βapp, max distribution of the sources is more strongly dependent on the classification of the source as a quasar or a BL Lac, and whether the source appears variable, than on that it is detected at γ-ray wavelengths. Given the larger number of sources in the CJF, unlike Lister et al. (2009a), we can treat the different AGN population separately. In particular, as we showed above, quasars show higher apparent jet speeds than BL Lacs, regardless of their γ-ray properties. A common feature for γ-ray detected sources is that their βapp, max distribution appears more extended, with a larger percentage of the sources at higher speeds, compared with those of non-detected sources. Regarding the observation that γ-variable sources show higher apparent jet speeds our results agree with those of Lister et al. (2009b), as we showed for the case of variable and non-variable γ-ray detected quasars. However, this does not come as a surprise in light of our recent findings from the statistical analysis of the CJF jet ridge lines. In short, we find that variable sources (throughout the electromagnetic spectrum) show stronger linear evolution of their jet ridge lines, a measure that essentially reflects their mean apparent jet speeds (Karouzos et al. 2011). Therefore, the higher apparent speeds of γ-ray detected variable sources can more probably be linked to the variability instead of to the γ-ray brightness itself.
Finally, we also find that BL Lac objects are preferentially detected by Fermi-LAT, even after correcting for the different redshift distribution of quasars and BL Lacs. Lister et al. (2009b) argue that BL Lacs might be preferentially detected by Fermi-LAT because of their flatter spectrum, i.e., their higher γ-to-radio ratio, compared with quasars. As we showed in Sect. 4.1, this is indeed true.
Another point of interest that has not so far been investigated concerns the apparent correlation seen between the γ-ray luminosity of a source and its maximum apparent jet speed. As we showed in Fig. 6, such a correlation exists, with variable sources falling closer to the implied trend. We need to contemplate whether the inclusion of more sources with potentially lower γ-ray luminosities would destroy this correlation. Looking at the CJF sources not yet detected by Fermi-LAT, 35 of them show significant (> 3σ) apparent speeds above 10c, while only 10 show speeds exceeding 20c. Of these 10 sources only 3 are classified as high-quality component fits (see Britzen et al. 2008, for details). Together with the high median redshift of the high-speed γ-ray non-detected CJF sources, the above suggest that the correlation seen in Fig. 6 is robust.
Although our results generally agree with previous studies, there are some differences that merit further interpretation. Of particular interest is that we find no strong connection between fast moving components and γ-ray detected sources, as do previous works. As we already discussed in Sect. 1, one of the models proposed for the origin of γ-ray emission in AGN involves a spine-sheath geometry, where a high-velocity spine is embedded in a slower moving sheath. According to these models, the ultra-relativistic spine gives rise to the γ-ray emission that we observe. Assuming that the jet as a whole becomes gradually more opaque at lower observing frequencies, we could then argue that given the lower frequency that the CJF sample has been observed in, we are only probing the (transversely) outer regions of the jet and therefore only recover the slower motions linked to the sheath of the jet. Conversely, the MOJAVE sample (15 GHz) as well as the samples used by both Jorstad et al. (2001) (42, 22, and occasionally 15 and 8.4 GHz) and Kellermann et al. (2004) (15 GHz) are all made at higher observing frequencies and are thus more sensitive to the inner layers of the jet. It is therefore plausible that these studies have recovered the faster speeds linked to the ultra-relativistic spine and the production of the observed γ-ray emission. An additional effect related to the higher frequency observation of the MOJAVE program is the probed distances from the core. At 15 GHz, the higher resolution of the VLBI observations allows the investigation of smaller spatial scales, closer to the core, which are therefore possibly more closely connected to γ-ray production processes. Finally, given the limited number of epochs available for some of the CJF sources, combined with the low observing frequency, it can be argued that the fastest moving components might have been missed or blended together with slower components in the CJF kinematic study, therefore resulting in on average slower component speeds for the whole sample. Detailed studies of individual sources at higher temporal and spatial resolutions (e.g., 1803+784, Britzen et al. 2010a; 0716+714, Britzen et al. 2009; etc.) have shown that this is not the case (if not showing the presence of the reverse effect).
An alternative scenario would be that indeed γ-ray emission, although boosted in high-Doppler jets, is not necessarily coupled to fast jet component speeds. Given that Lister et al. (2009b) use the three-month-bright-source list for their study, it is possible that only the γ-brightest, hence the most strongly beamed, sources are detected. Therefore there is a strong bias toward sources with higher Doppler factor jets. Including sources from the first 11-month Fermi-LAT catalog allows us to probe lower-flux sources (given the higher sensitivity achieved after 11 months of observations) and therefore the bias toward the most highly beamed sources is lifted. This scenario is unlikely however, because firstly by using only the sources included in the 3-month-bright-sources Fermi-LAT list and our CJF apparent speed data, we still recover a low-velocity component in the βapp, max distribution of the γ-ray detected sources, and secondly Savolainen et al. (2010), after calculating Doppler and Lorentz factors of Fermi-LAT detected AGN (3-month list), find a notable absence of sources at the smallest (and therefore most highly beamed) co-moving viewing angles. Distinguishing between either scenarios will require a larger sample of γ-ray detected AGN with uniform, multi-frequency kinematic data available.
A last possibility that may be affecting the kinematic properties of the γ-ray detected sources pertains to the relativistic effect of sources observed at a viewing angle inside the 1/Γ cone, where Γ is the Lorentz factor of the flow, which have lower apparent speeds. Hovatta et al. (2009) calculate median values for Lorentz factors and viewing angles for different AGN samples. The authors find for BL Lac objects a median Lorentz factor of Γ = 10.29 and a median viewing angle of θ = 5.24, while for flat-spectrum quasars they find 16.24 and 3.37, respectively. These values suggest that both sub-classes of AGN are found inside the 1/Γ cone. Given a certain combination of intrinsic speeds and viewing angles, sources could occur that are sufficiently beamed to be picked up by Fermi-LAT, but at the same time exhibit slower apparent jet speeds. That the same population of sources is not seen in the MOJAVE sample makes this explanation debatable.
Another layer of complexity is introduced when we consider the γ-ray variability of most of the γ-ray detected sources. If the γ-ray emission from AGN is of transient nature, related to a relativistic shock propagating down the pc-scale jet, this implies that many sources are missed from such an investigation simply because they are observed during their quiescent state. In addition to this, the non-contemporaneity of the kinematic and γ-ray data introduces further noise to plots like Figs. 3 and 6. At present we cannot sidestep these two caveats.
The last point that needs to be discussed concerns the connection between the jet ridge-line apparent width to the γ-ray properties of a source. Pushkarev et al. (2009) study the jet opening angles of the MOJAVE sample again in the context of the 3-month bright source list of the Fermi-LAT. The authors find that γ-bright sources have larger apparent opening angles, but in their co-moving frame both γ-bright and faint sources show similar opening angle distributions. This is in turn interpreted as evidence that γ-ray detected sources are seen at smaller viewing angles than the non-detected ones. Our results agree with these findings, because we find that γ-ray detected sources exhibit wider jet ridge lines compared to their non-detected counterparts. It should be noted however, that preferential detection of BL Lacs at γ-ray wavelengths combined with our results from the statistical analysis of the CJF jet ridge lines (i.e., that BL Lacs have apparently wider jet ridge lines; Karouzos et al. 2011) may introduce a spurious effect in such an analysis. It is also interesting to note that according to our findings from Sect. 4, γ-ray detected sources also exhibit substantial changes in their jet ridge-line widths, larger than the non-detected ones. That would introduce a noise factor when comparing the width distributions of γ-ray detected and non-detected sources. This in turn implies that γ-ray detected sources may in reality be even wider than inferred by the distribution shown in Fig. 8.
It is interesting to contemplate on how a two-zone model might accommodate for the apparently important non-radial component of the component trajectories, as implied by the significantly larger jet ridge line width evolution shown by γ-ray detected sources. A helical structure of AGN jets combined with the smaller viewing angles expected for γ-bright sources might offer a plausible explanation. Such a geometry has been used to explain non-ballistic trajectories for a number of AGN jets (e.g., 3C345, Steffen et al. 1995b; 1803+784, Steffen et al. 1995a; 1633+382, Liu et al. 2010). One could speculate that a helically structured sheath, enclosing an ultra-relativistic (straight) spine flow, could give rise to the kinematic behavior observed in the CJF sources, while explaining the γ-ray properties of these sources. Given the still small number of available CJF sources detected by Fermi-LAT, it is, for the time being, not possible to decouple and assess the individual importance of these effects.
6. Conclusions
We have investigated the connection of the γ-ray properties of the CJF sources to the morphologic and kinematic properties of their jets. In summary we find:
-
21.8% of the CJF sample is detected at γ-ray wavelengths (either from EGRET or the Fermi-LAT; three EGRET associations not included in the 11-month catalog).
-
BL Lacs appear to be preferentially detected in the γ-ray regime. Taking into account the difference of the redshift distributions of QSOs and BL Lacs in our sample, we still get fairly different detection ratios between the two classes (16% and 75%, respectively).
-
After calculating the γ-ray luminosities of both QSOs and BL Lacs, and taking into account the redshift effects of our flux-limited sample, we find that QSOs appear more luminous at γ-ray wavelengths than BL Lacs.
-
γ-ray detected sources (regardless of classification) show the peak of their βapp, max distribution at similar values as their non-detected counterparts, but show a more extended distribution toward higher jet component speeds. A K-S test results in an inconclusive answer, giving a 93.7% confidence that the two sub-samples are significantly different.
-
When considering QSOs and BL Lacs separately, we still find that γ-ray detected and non-detected sources show fairly similar distributions, with γ-ray detected sources showing more extended distributions toward higher values.
-
Comparing γ-ray detected QSOs and BL Lacs, both sub-samples show on average and within statistical errors the same apparent speeds after accounting for redshift effects.
-
We find a tentative correlation between βapp, max and γ-ray luminosity. The correlation is stronger for BL Lac objects and for γ-variable sources, with non-variable QSOs deviating the most from the implied trend.
-
We find that γ-ray detected sources have significantly apparently wider jet ridge lines than their non-detected counterparts. We also find that γ-ray detected sources show stronger jet ridge-line width evolution than non-detected ones.
-
We find no significant difference in terms of linear evolution of the jet ridge lines between γ-ray detected and non-detected sources.
-
We find no direct link between highly bent jets and TeV emission. Furthermore, two out of four TeV CJF sources with βapp, max information show superluminal speeds, unlike what was found in previous studies.
For this we use the Web tool: Wessa P. (2008), Partial Correlation (v1.0.4) in Free Statistics Software (v1.1.23-r6), Office for Research Development and Education, URL http://www.wessa.net/rwasp_partialcorrelation.wasp/.
Acknowledgments
M. Karouzos was supported for this research through a stipend from the International Max Planck Research School (IMPRS) for Astronomy and Astrophysics. The authors thank the anonymous referee for helpful suggestions that have improved this paper. M.K. also thanks Tuomas Savolainen and Mar Mezcua for insightful discussions and comments that significantly improved this manuscript. This research has made use of the NASA/IPAC Extragalactic Database (NED), which is operated by the Jet Propulsion Laboratory, California Institute of Technology, under contract with the National Aeronautics and Space Administration. This research has made use of NASA’s Astrophysics Data System Bibliographic Services.
References
- Abdo, A. A., Ackermann, M., Ajello, M., et al. 2010a, ApJ, 715, 429 [NASA ADS] [CrossRef] [Google Scholar]
- Abdo, A. A., Ackermann, M., Ajello, M., et al. 2010b, ApJ, 715, 429 [NASA ADS] [CrossRef] [Google Scholar]
- Abdo, A. A., Ackermann, M., Ajello, M., et al. 2010c, ApJ, 710, 1271 [NASA ADS] [CrossRef] [Google Scholar]
- Atwood, W. B., Abdo, A. A., Ackermann, M., et al. 2009, ApJ, 697, 1071 [NASA ADS] [CrossRef] [Google Scholar]
- Blandford, R. D., & Icke, V. 1978, MNRAS, 185, 527 [NASA ADS] [Google Scholar]
- Britzen, S., Vermeulen, R. C., Taylor, G. B., et al. 1999, in BL Lac Phenomenon, ed. L. O. Takalo, & A. Sillanpää, ASP Conf. Ser., 159, 431 [Google Scholar]
- Britzen, S., Brinkmann, W., Campbell, R. M., et al. 2007a, A&A, 476, 759 [NASA ADS] [CrossRef] [EDP Sciences] [Google Scholar]
- Britzen, S., Vermeulen, R. C., Taylor, G. B., et al. 2007b, A&A, 472, 763 [NASA ADS] [CrossRef] [EDP Sciences] [Google Scholar]
- Britzen, S., Vermeulen, R. C., Campbell, R. M., et al. 2008, A&A, 484, 119 [NASA ADS] [CrossRef] [EDP Sciences] [Google Scholar]
- Britzen, S., Kam, V. A., Witzel, A., et al. 2009, A&A, 508, 1205 [NASA ADS] [CrossRef] [EDP Sciences] [Google Scholar]
- Britzen, S., Kudryavtseva, N. A., Witzel, A., et al. 2010a, A&A, 511, A57 [NASA ADS] [CrossRef] [EDP Sciences] [Google Scholar]
- Britzen, S., Witzel, A., Gong, B. P., et al. 2010b, A&A, 515, A105 [NASA ADS] [CrossRef] [EDP Sciences] [Google Scholar]
- Chang, C. S., Ros, E., Kadler, M., et al. 2010, in Proceedings of the Workshop Fermi meets Jansky – AGN in Radio and Gamma-Rays, ed. T. Savolainen, E. Ros, R. W. Porcas, & J. A. Zensus, MPIfR, Bonn [arXiv:1006.4777] [Google Scholar]
- Cohen, M. H., Lister, M. L., Homan, D. C., et al. 2007, ApJ, 658, 232 [NASA ADS] [CrossRef] [Google Scholar]
- de Vaucouleurs, G. 1991, Science, 254, 1667 [NASA ADS] [Google Scholar]
- Fichtel, C. E., Bertsch, D. L., Chiang, J., et al. 1994, ApJS, 94, 551 [Google Scholar]
- Gehrels, N., Chipman, E., & Kniffen, D. A. 1993, A&AS, 97, 5 [NASA ADS] [Google Scholar]
- Georganopoulos, M., Perlman, E. S., & Kazanas, D. 2005, ApJ, 634, L33 [NASA ADS] [CrossRef] [Google Scholar]
- Ghisellini, G., Maraschi, L., & Treves, A. 1985, A&A, 146, 204 [NASA ADS] [Google Scholar]
- Hartman, R. C., Bertsch, D. L., Bloom, S. D., et al. 1999, ApJS, 123, 79 [NASA ADS] [CrossRef] [Google Scholar]
- Hook, I. M., McMahon, R. G., Patnaik, A. R., et al. 1995, MNRAS, 273, L63 [NASA ADS] [Google Scholar]
- Hovatta, T., Valtaoja, E., Tornikoski, M., & Lähteenmäki, A. 2009, A&A, 494, 527 [NASA ADS] [CrossRef] [EDP Sciences] [Google Scholar]
- Hoyle, F. 1966, Nature, 209, 751 [NASA ADS] [CrossRef] [Google Scholar]
- Jorstad, S. G., Marscher, A. P., Mattox, J. R., et al. 2001, ApJ, 556, 738 [NASA ADS] [CrossRef] [Google Scholar]
- Kanbach, G., Bertsch, D. L., Fichtel, C. E., et al. 1988, Space Sci. Rev., 49, 69 [NASA ADS] [Google Scholar]
- Karouzos, M., Britzen, S., Eckart, A., Witzel, A., & Zensus, A. 2010, A&A, 519, A62 [NASA ADS] [CrossRef] [EDP Sciences] [Google Scholar]
- Karouzos et al. 2011, A&A, submitted [Google Scholar]
- Kellermann, K. I., Lister, M. L., Homan, D. C., et al. 2004, ApJ, 609, 539 [NASA ADS] [CrossRef] [Google Scholar]
- Lähteenmäki, A., Valtaoja, E., & Wiik, K. 1999, ApJ, 511, 112 [NASA ADS] [CrossRef] [Google Scholar]
- Lister, M. L., Aller, H. D., Aller, M. F., et al. 2009a, AJ, 137, 3718 [NASA ADS] [CrossRef] [Google Scholar]
- Lister, M. L., Homan, D. C., Kadler, M., et al. 2009b, ApJ, 696, L22 [NASA ADS] [CrossRef] [Google Scholar]
- Liu, Y., Jiang, D. R., Shen, Z., & Karouzos, M. 2010, A&A, 522, L5 [NASA ADS] [CrossRef] [EDP Sciences] [Google Scholar]
- Lobanov, A. P., & Roland, J. 2005, A&A, 431, 831 [NASA ADS] [CrossRef] [EDP Sciences] [Google Scholar]
- Lowe, S. R., Gawroński, M. P., Wilkinson, P. N., et al. 2007, A&A, 474, 1093 [NASA ADS] [CrossRef] [EDP Sciences] [Google Scholar]
- Maraschi, L., Ghisellini, G., & Celotti, A. 1992, ApJ, 397, L5 [NASA ADS] [CrossRef] [Google Scholar]
- Neshpor, Y. I., Stepanyan, A. A., Kalekin, O. P., et al. 1998, Astron. Lett., 24, 134 [Google Scholar]
- Pearson, T. J., Browne, I. W. A., Henstock, D. R., et al. 1998, in Radio Emission from Galactic and Extragalactic Compact Sources, ed. J. A. Zensus, G. B. Taylor, & J. M. Wrobel, IAU Colloq., 164, ASP Conf. Ser., 144, 17 [Google Scholar]
- Piner, B. G., Pant, N., & Edwards, P. G. 2008, ApJ, 678, 64 [NASA ADS] [CrossRef] [Google Scholar]
- Pollack, L. K., Taylor, G. B., & Zavala, R. T. 2003, ApJ, 589, 733 [NASA ADS] [CrossRef] [Google Scholar]
- Punch, M., Akerlof, C. W., Cawley, M. F., et al. 1992, Nature, 358, 477 [NASA ADS] [CrossRef] [Google Scholar]
- Pushkarev, A. B., Kovalev, Y. Y., Lister, M. L., & Savolainen, T. 2009, A&A, 507, L33 [NASA ADS] [CrossRef] [EDP Sciences] [Google Scholar]
- Roland, J., Britzen, S., Kudryavtseva, N. A., Witzel, A., & Karouzos, M. 2008, A&A, 483, 125 [NASA ADS] [CrossRef] [EDP Sciences] [Google Scholar]
- Savolainen, T., Homan, D. C., Hovatta, T., et al. 2010, A&A, 512, A24 [NASA ADS] [CrossRef] [EDP Sciences] [Google Scholar]
- Sikora, M., Begelman, M. C., & Rees, M. J. 1994, ApJ, 421, 153 [NASA ADS] [CrossRef] [Google Scholar]
- Spergel, D. N., Verde, L., Peiris, H. V., et al. 2003, ApJS, 148, 175 [NASA ADS] [CrossRef] [Google Scholar]
- Steffen, W., Krichbaum, T. P., Britzen, S., & Witzel, A. 1995a, in The XXVIIth Young European Radio Astronomers Conference, ed. D. A. Green, & W. Steffen, 29 [Google Scholar]
- Steffen, W., Zensus, J. A., Krichbaum, T. P., Witzel, A., & Qian, S. J. 1995b, A&A, 302, 335 [Google Scholar]
- Tavani, M., Barbiellini, G., Argan, A., et al. 2008, Nuclear Instruments and Methods in Physics Research A, 588, 52 [Google Scholar]
- Tavecchio, F., & Ghisellini, G. 2008, in HIGH ENERGY GAMMA-RAY ASTRONOMY: Proceedings of the 4th International Meeting on High Energy Gamma-Ray Astronomy, AIP Conf. Proc., 1085, 431 [Google Scholar]
- Taylor, G. B., Vermeulen, R. C., Readhead, A. C. S., et al. 1996, ApJS, 107, 37 [NASA ADS] [CrossRef] [Google Scholar]
- Thompson, D. J., Bertsch, D. L., Dingus, B. L., et al. 1996, ApJS, 107, 227 [NASA ADS] [CrossRef] [Google Scholar]
- Vermeulen, R. C., Britzen, S., Taylor, G. B., et al. 2003, in Radio Astronomy at the Fringe, ed. J. A. Zensus, M. H. Cohen, & E. Ros, ASP Conf. Ser., 300, 43 [Google Scholar]
- von Montigny, C., Bertsch, D. L., Chiang, J., et al. 1995, ApJ, 440, 525 [NASA ADS] [CrossRef] [Google Scholar]
- Zensus, J. A., Cohen, M. H., & Unwin, S. C. 1995, ApJ, 443, 35 [NASA ADS] [CrossRef] [Google Scholar]
Appendix A: γ-ray properties of the CJF sample
CJF sources detected in the γ-ray regime by Fermi-LAT.
All Tables
Characteristic statistic values of the γ-ray luminosity (in logarithmic scale, measured in erg/s) of the CJF sources detected in the γ-ray regime by Fermi-LAT.
All Figures
|
Fig. 1 Redshift distribution of the Fermi-LAT detected (1st Catalog; Abdo et al. 2010b) CJF sources. The three different classes of AGN are shown: BL Lacs (dashed empty line), quasars (continuous empty line), and radio galaxies (continuous filled line). |
| In the text | |
|
Fig. 2 Histogram comparing the distributions of γ-ray-to-radio luminosity ratios for BL Lacs and QSOs. We use γ-ray luminosities derived from the Fermi-LAT photon fluxes given in the first Fermi-LAT source catalog (Abdo et al. 2010a) and radio luminosities at 5 GHz derived from single-dish energy fluxes from Taylor et al. (1996). |
| In the text | |
|
Fig. 3 Distribution of the maximum apparent velocities βapp, max for sources that have been detected in the γ-ray regime (black line) and for those that have not (gray blocks). We show the distributions for all sources (upper panel), quasars (middle panel), and BL Lacs (lower panel). The insets show the normalized-to-surface-area unity distributions for each case and for apparent speeds up to 30c. We used the kinematic data from Britzen et al. (2008). |
| In the text | |
|
Fig. 4 Distribution of the maximum apparent velocities βapp, max for γ-ray detected sources that are variable (black line) and for those that are not (gray blocks). We used the kinematic data from Britzen et al. (2008). |
| In the text | |
|
Fig. 5 Left panel: distributions of the maximum apparent velocities βapp, max for γ-variable BL Lacs (black line) quasars (gray blocks). Right panel: γ-variable (black line) and non-variable (gray blocks) quasars. We used the kinematic data from Britzen et al. (2008). |
| In the text | |
|
Fig. 6 Maximum apparent component velocities for all γ-ray detected CJF sources as a function of their γ-ray luminosity, for all sources (left panel) and for high-significance values of βapp,max (right panels; see text for details). We distinguish between γ-variable (filled symbols) and non-variable sources (open symbols), and between the different AGN classes, i.e., BL Lacs (circles), quasars (squares), and radio galaxies (diamonds). We used the kinematic data from Britzen et al. (2008). |
| In the text | |
|
Fig. 7 Example of the definition of the jet width for the source 0700+470. With arrows we show the components with the minimum and maximum position angles at that epoch. The continuous line represents the jet ridge-line of 0700+470 (see the text for a definition) at the same epoch. Map from Britzen et al. (2007b). |
| In the text | |
|
Fig. 8 Histograms of jet ridge-line apparent width, dP, and width evolution, ΔP, for γ-ray detected variables sources (continuous black line), γ-ray detected non-variable sources (dashed black line), and γ-ray non-detected sources (gray blocks). Given the large difference in absolute numbers, we plot histograms normalized to surface area unity. We used data from Karouzos et al. (2011). |
| In the text | |
Current usage metrics show cumulative count of Article Views (full-text article views including HTML views, PDF and ePub downloads, according to the available data) and Abstracts Views on Vision4Press platform.
Data correspond to usage on the plateform after 2015. The current usage metrics is available 48-96 hours after online publication and is updated daily on week days.
Initial download of the metrics may take a while.