Fig. 3
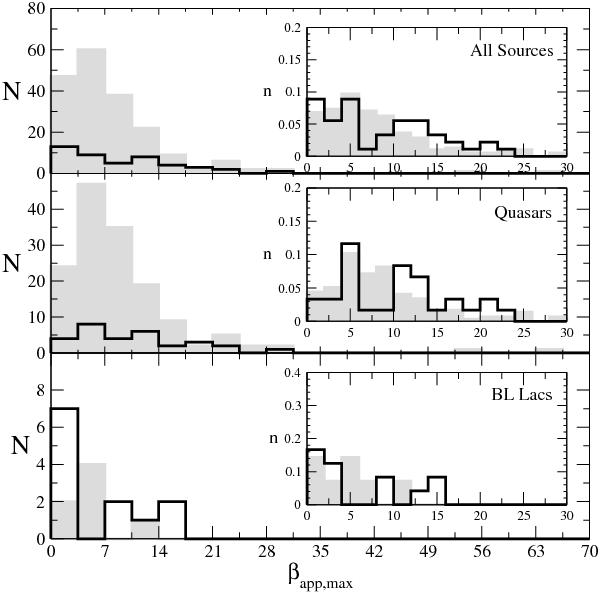
Distribution of the maximum apparent velocities βapp, max for sources that have been detected in the γ-ray regime (black line) and for those that have not (gray blocks). We show the distributions for all sources (upper panel), quasars (middle panel), and BL Lacs (lower panel). The insets show the normalized-to-surface-area unity distributions for each case and for apparent speeds up to 30c. We used the kinematic data from Britzen et al. (2008).
Current usage metrics show cumulative count of Article Views (full-text article views including HTML views, PDF and ePub downloads, according to the available data) and Abstracts Views on Vision4Press platform.
Data correspond to usage on the plateform after 2015. The current usage metrics is available 48-96 hours after online publication and is updated daily on week days.
Initial download of the metrics may take a while.