Fig. 8
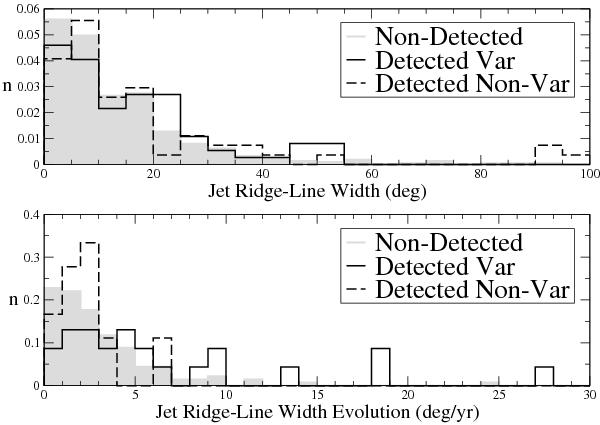
Histograms of jet ridge-line apparent width, dP, and width evolution, ΔP, for γ-ray detected variables sources (continuous black line), γ-ray detected non-variable sources (dashed black line), and γ-ray non-detected sources (gray blocks). Given the large difference in absolute numbers, we plot histograms normalized to surface area unity. We used data from Karouzos et al. (2011).
Current usage metrics show cumulative count of Article Views (full-text article views including HTML views, PDF and ePub downloads, according to the available data) and Abstracts Views on Vision4Press platform.
Data correspond to usage on the plateform after 2015. The current usage metrics is available 48-96 hours after online publication and is updated daily on week days.
Initial download of the metrics may take a while.