| Issue |
A&A
Volume 528, April 2011
|
|
|---|---|---|
| Article Number | A13 | |
| Number of page(s) | 20 | |
| Section | Extragalactic astronomy | |
| DOI | https://doi.org/10.1051/0004-6361/201015286 | |
| Published online | 18 February 2011 | |
Genesis and evolution of dust in galaxies in the early Universe
I. Modelling dust evolution in starburst galaxies
Dark Cosmology Centre, University of Copenhagen, Niels Bohr
Institute,
Juliane Maries Vej 30,
2100
Copenhagen,
Denmark
e-mail: This email address is being protected from spambots. You need JavaScript enabled to view it.
Received:
25
June
2010
Accepted:
12
November
2010
Abstract
Aims. The aim is to elucidate the astrophysical conditions required for generating large amounts of dust in massive starburst galaxies at high redshift.
Methods. We have developed a numerical galactic chemical evolution model. The model is constructed such that the effect of a wide range of parameters can be investigated. It takes into account results from stellar evolution models, a differentiation between diverse types of core collapse supernovae (CCSN), and the contribution of asymptotic giant branch (AGB) stars in the mass range 3–8 M⊙. We consider the lifetime-dependent yield injection into the interstellar medium (ISM) by all sources, and dust destruction due to supernova (SN) shocks in the ISM. We ascertain the temporal progression of the dust mass and the dust-to-gas and dust-to-metal mass ratios, as well as other physical properties of a galaxy, and study their dependence on the mass of the galaxy, the initial mass function (IMF), dust production efficiencies, and dust destruction in the ISM.
Results. The amount of dust and the physical properties of a galaxy strongly depend on the initial gas mass available. Overall, while the total amount of dust produced increases with galaxy mass, the detailed outcome depends on the SN dust production efficiency, the IMF, and the strength of dust destruction in the ISM. Dust masses are higher for IMFs biased towards higher stellar masses, even though these IMFs are more strongly affected by dust destruction in the ISM. The sensitivity to the IMF increases as the mass of the galaxy decreases. SNe are primarily responsible for a significant enrichment with dust at early epochs (<200 Myr). Dust production with a dominant contribution by AGB stars is found to be insufficient to account for dust masses in excess of 108 M⊙ within 400 Myr after starburst.
Conclusions. We find that galaxies with initial gas masses between 1–5 × 10¹¹ M⊙ are massive enough to enable production of dust masses > 108 M⊙. Our preferred scenario is dominated by SN dust production in combination with top-heavy IMFs and moderate dust destruction in the ISM.
Key words: galaxies: high-redshift / galaxies: starburst / galaxies: evolution / evolution / quasars: general / stars: massive
© ESO, 2011
1. Introduction
Modelling the evolution of dust in galaxies is a key ingredient in understanding the origin of the high observed dust masses in high-redshift galaxies and quasars (QSOs). Dust masses ≥ 108 M⊙ have been derived from observations in QSOs at redshift z ≳ 6 (e.g., Bertoldi et al. 2003a; Robson et al. 2004; Beelen et al. 2006; Hines et al. 2006; Michałowski et al. 2010b) along with high star formation rates (SFR) up to a few times 102−3 M⊙ yr-1 (e.g., Walter et al. 2004; Wang et al. 2010). Additionally, QSOs at z > 6 harbour supermassive black holes (SMBHs) with masses > 109 M⊙ (e.g., Willott et al. 2003; Vestergaard 2004; Jiang et al. 2006). Kawakatu & Wada (2008, 2009) showed that to form a SMBH > 109 M⊙, a high mass supply of > 1010−11 M⊙ is needed. These requirements, together with derived molecular gas masses from CO line emission measurements in excess of 1010 M⊙ (e.g., Cox et al. 2002; Carilli et al. 2002; Bertoldi et al. 2003b; Walter et al. 2003; Riechers et al. 2009; Wang et al. 2010), set significant constraints on the physical properties of the host galaxies. These in turn have implications for the origin and evolution of dust. Furthermore, a tendency toward increased dust attenuation with higher galaxy masses for systems at z ~ 6–8 has been found by Schaerer & de Barros (2010).
Analytical and numerical models for dust evolution have been developed. Dwek et al. (2007) propose 1 M⊙ of dust per SN will be necessary to account for dust masses in high-z QSOs, while contemplating SNe as the only source. Such high dust masses for SNe contradict derived dust masses from nearby SNe and SN remnants, which on average reveal a few times 10-4–10-2 M⊙ of dust (e.g., Wooden et al. 1993; Elmhamdi et al. 2003; Temim et al. 2006; Meikle et al. 2007; Rho et al. 2008; Kotak et al. 2009; Sibthorpe et al. 2010; Barlow et al. 2010). A review of observationally and theoretically derived dust from stellar sources is provided by Gall et al. (in prep., herafter GAH11).
The issue of whether SNe produce large amounts of dust is unclear. Other sources of dust such as AGB stars have been taken into account (Morgan & Edmunds 2003; Valiante et al. 2009) in chemical evolution models of high-redshift galaxies. Valiante et al. (2009) claim that with the contribution of AGB stars, 108 M⊙ of dust can be reached, with AGB stars dominating the dust production. AGB stars (0.85–8 M⊙) are the main source of dust in the present universe, but only stars with masses ≳ 3 M⊙ are likely to contribute at z > 6 (e.g., Marchenko 2006). Evidence that metal-deficient AGB stars also undergo strong mass loss and are able to efficiently produce dust is supported observationally (e.g., Zijlstra et al. 2006; Groenewegen et al. 2007; Lagadec et al. 2007; Matsuura et al. 2007; Sloan et al. 2009) and theoretically (e.g., Wachter et al. 2008; Mattsson et al. 2008). However, the theoretical models (Dwek et al. 2007; Morgan & Edmunds 2003; Valiante et al. 2009) greatly differ with respect to the assumptions made for the mass of the galaxy and dust contribution from stellar sources, as well as the treatment of the star formation. Thus the origin of dust and its evolution remain unclear.
In GAH11 we discuss plausible dust production efficiency limits for stellar sources between 3 M⊙ and 40 M⊙, and determined the dust productivity of these sources for a single stellar population. In this paper, we investigate the evolution of dust in high-z galaxies. We develop a numerical chemical evolution model, which allows exploration of the physical parameter space for galaxies at z > 5–6. Different types of core collapse supernovae are specified and the contribution from AGB stars and the impact of SMBHs are taken into account. We furthermore follow the evolution of some physical properties of these galaxies. The main parameters varied in the model are the IMF, the mass of the galaxy, yields for SNe, and the strength of dust destruction in the ISM, as well as the dust production efficiency limits. Models with or without the SMBH formation are considered.
The paper is arranged as follows. In Sect. 2 the equations used to construct the model are developed. We discuss the model parameters and their possible values in Sect. 3. A detailed analysis of the results is presented in Sect. 4, which is followed by a discussion in Sect. 5 and our conclusions of this work in Sect. 6.
2. Modelling the evolution of dust in starburst galaxies
In this section we formulate the equations needed to follow a galaxy’s time-dependent evolution in a self-consistent numerical model. The main basic logic is adopted from Tinsley (1980, and references therein), which has also been used in other chemical evolution models to study dust in galaxies (e.g., Morgan & Edmunds 2003; Dwek et al. 2007). We focus on an elaborate treatment of dust from different types of CCSNe and AGB stars. In order to calculate the amount of dust from these sources we use the dust production efficiencies described in Sect. 3.4. In particular, the lifetime-dependent delayed dust and gas injection from AGB stars and SNe is taken into account. The metallicity-dependent lifetimes of all stars are taken from Schaller et al. (1992), Schaerer et al. (1993), and Charbonnel et al. (1993). In GAH11 we show that the variation of the lifetime with metallicity is minimal. We therefore calculate and use a metallicity-averaged lifetime for all stars. The recycled gaseous material is defined as the remaining ejected stellar yields from all massive stars in the mass range 3–100 M⊙, which has not been incorporated into dust grains. This also includes the stellar feedback from very massive stars (≳30–40 M⊙) in the form of stellar winds. Dust and gas are assumed to be released instantaneously after the death of the stars.
We strictly treat the elements in the gas and solid phases separately, while paying attention to their interplay. Thus, we define Mg(t) as the total mass of elements in the ISM, which are in the gas phase and Md(t) as the total amount of elements in the solid dust phase. The mass of the ISM is defined as MISM(t) ≡ Mg(t) + Md(t), which in the literature is often referred to as the “gas mass”. The total amount of dust in our models is solely calculated from the dust contributions from SNe and AGB stars. Thus, no further growth in the ISM is contemplated. However, dust destruction in the ISM through SN shocks is taken into account. The formation of the SMBH is considered as a simple sink for dust, gas, and metals.
We assume a so-called “closed box” model; i.e., the effect of infalling and outflowing gas in the galactic system is neglected. Although galaxies may not evolve in such a simple manner, this assumption is plausible since massive starburst galaxies are assumed to have SFRs ψ(t) ≳ 103 M⊙ yr-1. Infall of neutral gas would only affect the system when the infall rate is comparable to the SFR. In this case a large gas reservoir needs to be present in the vicinity of the galaxy already. Besides, infall rates for high-z galaxies are not known. We further assume the ISM to be homogeneously mixed, and we evolve our model only up to the first Gyr. Examples of “closed box” models being sufficiently accurate include the works of Frayer et al. (1999) and Tecza et al. (2004) for the luminous and massive submillimetre galaxy SMMJ14011+0252 at z = 2.565.
2.1. Basic considerations
The initial mass functions (IMF) φ(m) is normalized to
unity in the mass interval [m1,
m2] as  (1)where
m1 and m2 are the lower and
upper limits of the IMF (see Sect. 3.2).
(1)where
m1 and m2 are the lower and
upper limits of the IMF (see Sect. 3.2).
The relation between the total mass MISM(t)
and the SFR ψ(t) is given by the Kennicutt law (Kennicutt 1998), where
ψ(t) ∝ MISM(t)k.
Analogously to Dwek et al. (2007), we apply the
following notation to calculate the SFR ![Mathematical equation: \begin{equation} \label{EQ:SFR} \psi(t) = \psi_{\mathrm{ini}} \left[ \frac{ M_{\mathrm{ISM}}(t)}{M_{\mathrm{ini}}}\right] ^k , \end{equation}](/articles/aa/full_html/2011/04/aa15286-10/aa15286-10-eq34.png) (2)where
ψini is the initial SFR, Mini
the initial gas mass of the galaxy, and
MISM(t) the mass of the ISM. The value
of k is between 1 and 2, so we set k = 1.5. This value
has often been assumed in other models (e.g., Dwek
1998; Dwek et al. 2007; Calura et al. 2008).
(2)where
ψini is the initial SFR, Mini
the initial gas mass of the galaxy, and
MISM(t) the mass of the ISM. The value
of k is between 1 and 2, so we set k = 1.5. This value
has often been assumed in other models (e.g., Dwek
1998; Dwek et al. 2007; Calura et al. 2008).
2.2. Equations for AGB stars and supernovae
The amount of dust from all stellar sources released into the ISM per unit time is simply calculated as the amount of dust produced by the stellar sources times the source rate. The considered dust producing stellar sources are AGB stars and CCSNe. We account for a potentially diverse dust contribution by different SNe subtypes and distinguish between type IIP SNe and the remaining type II subtypes. Types Ib and Ic SNe, collectively referred to as Ib/c, are not considered as dust producing SNe. However they inject their stellar yields into the ISM. A specification of these sources and their lower and upper stellar mass limits, mL(i) and mU(i), are discussed in Sect. 3.3. In the following equations these sources are indicated by the subscript i = AGB, IIP, II, Ib/c.
The AGB and SN rate Ri(t) calculates as
 (3)where τ
= τ(m) is the lifetime of a star with a zero-age main
sequence (ZAMS) mass m; i.e., the star was born at time
(t − τ) when it dies at time t. It is
evident that stars only contribute when the condition
t − τ ≥ 0 is fulfilled.
(3)where τ
= τ(m) is the lifetime of a star with a zero-age main
sequence (ZAMS) mass m; i.e., the star was born at time
(t − τ) when it dies at time t. It is
evident that stars only contribute when the condition
t − τ ≥ 0 is fulfilled.
For SNe, the time of releasing the total produced elements is assumed to take place right after explosion. The main sequence lifetime for AGB stars is defined as the time until the end of the early AGB phase, which can take up to several 100 Myr. However, the most efficient mass loss phase itself is less than 1 Myr at the very end of the AGB phase and is relatively short compared to the total lifetime of AGB stars. Thus, we make the same approximation as for SNe: all produced elements and dust are released instantaneously after the main sequence lifetime.
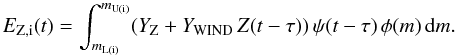
For each kind of source the total produced dust per unit time is calculated as
 (4)where
YZ = YZ(m,Z)
with Z = Z(t − τ) is
the mass (m) and metallicity (Z) dependent amount of
ejected heavy elements per star. The metallicity Z is defined as the
metallicity with which the star was born at a time
(t − τ). The parameter
ϵi(m,Z) is defined as the dust production
efficiency. The assumed efficiencies are described further in Sect. 3.4. For types Ib/c SNe,
(4)where
YZ = YZ(m,Z)
with Z = Z(t − τ) is
the mass (m) and metallicity (Z) dependent amount of
ejected heavy elements per star. The metallicity Z is defined as the
metallicity with which the star was born at a time
(t − τ). The parameter
ϵi(m,Z) is defined as the dust production
efficiency. The assumed efficiencies are described further in Sect. 3.4. For types Ib/c SNe,  .
.
The total amount of mass lost in stellar winds prior to explosion,
YWIND, caused by mass loss during stellar evolution of SNe,
is calculated as  (5)where
YWIND =
YWIND(m,Z) and
Mfin = Mfin(m,Z).
The latter is the final mass of a SN before explosion. Type II SN suffer strong mass loss
leading to the formation of dense circumstellar disks. Dust has been found in these disks
for some SNe (GAH11 and references therein). However, the actual amount of metals in these
disks is not known and data are not available, thus we cannot account for them. In the
case of AGB stars and for SN models where no mass loss prescription is available
YWIND = 0.
(5)where
YWIND =
YWIND(m,Z) and
Mfin = Mfin(m,Z).
The latter is the final mass of a SN before explosion. Type II SN suffer strong mass loss
leading to the formation of dense circumstellar disks. Dust has been found in these disks
for some SNe (GAH11 and references therein). However, the actual amount of metals in these
disks is not known and data are not available, thus we cannot account for them. In the
case of AGB stars and for SN models where no mass loss prescription is available
YWIND = 0.
Besides the elements bound in dust grains, elements in the gas phase are also released
into the ISM. The produced amount of elements in gaseous form is calculated as
 (6)where
YE = YE(m,Z) is
the amount of all ejected elements per star.
(6)where
YE = YE(m,Z) is
the amount of all ejected elements per star.
The total mass of heavy elements released into the ISM per unit time is calculated as
 (7)We include the
possibility of dust destruction in the SN remnant (SNR) due to reverse shock interaction.
Dust destruction time scales up to 104 yr have been predicted by Bianchi & Schneider (2007) and Nozawa et al. (2007, 2010). However, this timescale is relatively short in comparison to the lifetime
of a star, so we make the approximation that dust is destroyed immediately after
formation.
(7)We include the
possibility of dust destruction in the SN remnant (SNR) due to reverse shock interaction.
Dust destruction time scales up to 104 yr have been predicted by Bianchi & Schneider (2007) and Nozawa et al. (2007, 2010). However, this timescale is relatively short in comparison to the lifetime
of a star, so we make the approximation that dust is destroyed immediately after
formation.
We define the parameter ξSN as the SN dust destruction
factor; i.e., the destroyed mass of dust per unit time of all SNe is  (8)This term applies only to
type IIP and type II SNe, thus i = IIP, II.
(8)This term applies only to
type IIP and type II SNe, thus i = IIP, II.
The final SN dust injection rate per unit time is calculated as
 (9)while the final AGB dust
injection rate is
(9)while the final AGB dust
injection rate is
 (10)
(10)
2.2.1. Recycled gaseous material
The recycled material from SNe, and AGB stars consists of all the mass of the elements
not being incorporated into dust grains, thus the material is in the gas phase. Very
massive stars ending as BHs may contribute with their stellar winds to the recycled
material. We refer to stars that directly form a BH as the “remaining stars”. Pertaining
to the short lifetime of very massive stars and the resulting short duration of the wind
phase, we assume that all the elements lost in the wind phase are released after the
death of the star. The total mass of the released elements per unit time of the
remaining stars is 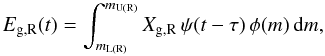 (11)where
Xg,R =
Xg,R(m,Z) is the mass of elements
released into the ISM per star, while the subscript “R” stands for “remaining stars”.
(11)where
Xg,R =
Xg,R(m,Z) is the mass of elements
released into the ISM per star, while the subscript “R” stands for “remaining stars”.
For these remaining stars the following two scenarios are possible: (1) a supernova without display (Eldridge & Tout 2004) occurs even if a BH is formed and elements are ejected or (2) no SN occurs because no SN shock is launched. For the first case, the term Xg,R can either be substituted with (YE + YWIND), or if YE and YWIND are not known, the common approximation of Xg,R = m − Mrem can be made. The mass Mrem = Mrem(m,Z) is the remnant mass of a star. In the second case we assume that no nucleosynthesis products will be ejected. A contribution to the gas household in the ISM comes solely from the stellar winds, thus Xg,R = YWIND.
The mass of released metals from these stars per unit time is given by
 (12)where
XZ,R =
XZ,R(m,Z) is the mass of the ejected
heavy elements per star. For the first case, XZ,R =
YZ + YWIND Z(t − τ).
For the second, XZ,R =
YWIND Z(t − τ).
(12)where
XZ,R =
XZ,R(m,Z) is the mass of the ejected
heavy elements per star. For the first case, XZ,R =
YZ + YWIND Z(t − τ).
For the second, XZ,R =
YWIND Z(t − τ).
By extending the subscript i to i = AGB, IIP, II, Ib/c, R, the total returned mass of gaseous material to the ISM per unit time calculates as
 (13)It is important to note
that elements locked up in dust grains will return to the gas phase when dust
destruction takes place. As a result, the amount of destroyed dust in SNRs must be added
to the total amount of gas in the ISM (second term in Eq. (13)).
(13)It is important to note
that elements locked up in dust grains will return to the gas phase when dust
destruction takes place. As a result, the amount of destroyed dust in SNRs must be added
to the total amount of gas in the ISM (second term in Eq. (13)).
2.3. The evolution of dust and gas in the galaxy
The chemical evolution of a galaxy is mainly determined by the equations balancing the net amount of gas, dust, and heavy elements.
2.3.1. Effect of a super massive black hole
We take the effect of a SMBH into account as an additional sink for the gas, dust, and heavy elements. We base our assumptions for the treatment of the BH on the theoretical work of Kawakatu & Wada (2008, 2009). Super Eddington growth is required to form a SMBH. This necessitates a large mass supply of ~1010−11 M⊙ on a short supply timescale of tSMBHsup ~ 108 yr from the host galaxy to a massive circumnuclear disk. Kawakatu & Wada (2009) find that the final SMBH mass is around 1–10% of the supply mass MBHsup.
We do not treat the formation of the disk in detail, but assume that the supply mass
needed is equal to the initial mass Mini of our considered
systems. We therefore only take the overall mass of the ISM needed to form the SMBH into
account. A simple constant growth rate is calculated as  (14)where
MSMBH is the mass of the final SMBH, and
ΨSMBH = const. for t ≤ tSMBH,
whereas ΨSMBH = 0 for
t > tSMBH. The growth timescale to
build up the SMBH is equal to the supply timescale
tSMBH = tSMBHsup. The onset of
the SMBH formation coincides with the onset of starburst of the whole galaxy. Where the
SMBH is not taken into account, the growth rate is set to zero (ΨSMBH = 0).
(14)where
MSMBH is the mass of the final SMBH, and
ΨSMBH = const. for t ≤ tSMBH,
whereas ΨSMBH = 0 for
t > tSMBH. The growth timescale to
build up the SMBH is equal to the supply timescale
tSMBH = tSMBHsup. The onset of
the SMBH formation coincides with the onset of starburst of the whole galaxy. Where the
SMBH is not taken into account, the growth rate is set to zero (ΨSMBH = 0).
2.3.2. The amount of dust in the ISM
The evolution of the amount of dust Md(t) in the galaxy is
 (15)The first and second
terms are the dust injection rates from SNe and AGB stars contributing to the increase
in the dust household in the ISM. The third term
ED(t) is defined as the total dust
destruction rate. It determines the dust reduction through astration, as well as through
the SMBH formation and destruction in the ISM caused by SN shocks, if considered. The
total dust destruction rate is calculated as
(15)The first and second
terms are the dust injection rates from SNe and AGB stars contributing to the increase
in the dust household in the ISM. The third term
ED(t) is defined as the total dust
destruction rate. It determines the dust reduction through astration, as well as through
the SMBH formation and destruction in the ISM caused by SN shocks, if considered. The
total dust destruction rate is calculated as
 (16)The variable
ηd(t) = Md(t)/MISM(t)
is the fraction of dust in the ISM and will be referred to as the “dust-to-gas mass
ratio”. For simplicity we make the assumption that the produced dust will be immediately
mixed with the material in the ISM. The dust destruction in the ISM through SN shocks
will be discussed in more detail in Sect. 3.5.
(16)The variable
ηd(t) = Md(t)/MISM(t)
is the fraction of dust in the ISM and will be referred to as the “dust-to-gas mass
ratio”. For simplicity we make the assumption that the produced dust will be immediately
mixed with the material in the ISM. The dust destruction in the ISM through SN shocks
will be discussed in more detail in Sect. 3.5.
2.3.3. The amount of gas in the ISM
The temporal evolution of the gas content in the galaxy is calculated as
 (17)Here,
Eg(t) is the recycled gaseous material
(see Eq. (13)). The second term is the
amount of destroyed dust in gaseous form (see Sect. 2.3.2). The third term accounts for the depletion of the gas in the ISM
through incorporation into stars and the loss to the SMBH. The fraction of gas in the
ISM is expressed as (1 − ηd(t)).
(17)Here,
Eg(t) is the recycled gaseous material
(see Eq. (13)). The second term is the
amount of destroyed dust in gaseous form (see Sect. 2.3.2). The third term accounts for the depletion of the gas in the ISM
through incorporation into stars and the loss to the SMBH. The fraction of gas in the
ISM is expressed as (1 − ηd(t)).
2.3.4. Metallicity
Owing to the separation of the ISM mass into the material locked in dust and gas, respectively, it is necessary to formally take care of the transition of elements from the dust phase to the gas phase (due to destruction). For the evolution of heavy elements we do not distinguish between their chemical states.
The equation for the evolution of the total amount of heavy elements is formulated as
 (18)where
 (19)is the total
ejected mass of heavy elements per unit time from all considered sources. The last term
in Eq. (18) determines the reduction of
heavy elements due to astration and the loss to the SMBH.
(19)is the total
ejected mass of heavy elements per unit time from all considered sources. The last term
in Eq. (18) determines the reduction of
heavy elements due to astration and the loss to the SMBH.
The total metallicity of the system is defined as
Z(t) = ηZ(t) = MZ(t)/MISM(t).
The fraction of metals in the ISM which are bound in dust grains is calculated as
ηZd(t) = Md(t)/MZ(t).
The amount of metals in the gas phase is 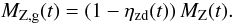 (20)The gas phase
metallicity is given as
ηZg(t) = MZ,g(t)/Mg(t).
(20)The gas phase
metallicity is given as
ηZg(t) = MZ,g(t)/Mg(t).
3. Model parameters
In this section we describe the prime model parameters, along with the values used in this study. In particular, we consider the initial conditions of the galaxy, the IMF, stellar yields, and the destruction rates of dust in the ISM. These characterize the system and significantly influence the evolution of gas, dust, and metals. In addition we define some switches, which specify various possibilities for some model parameters. All parameters and their considered values, as well as the possibilities for the switches, are listed in Table 2.
3.1. Initial conditions
The model is defined by the initial values of the parameters. It neither depends on nor is influenced by additional input from other models; i.e., it does not depend on a cosmological model. Therefore it can be applied to any galaxy within the accuracy limit of a “closed-box” treatment. We are mainly interested in massive high-redshift galaxies in which high dust masses, stellar masses, and H2 masses have been inferred from observations. The parameters of our computed models are therefore tuned to such galaxies.
One of the main parameters is the baryonic initial gas mass Mini, which is equal to the total mass of the galaxy in baryons. A relation between Mini and the mass of the dark matter halo MDM hosting such systems is given through Mini = Ωb/Ωm MDM. In this work we consider four different massive galaxies with Mini = 1.3 × 10¹² M⊙, Mini = 5 × 10¹¹ M⊙, Mini = 1 × 10¹¹ M⊙, and Mini = 5 × 10¹⁰ M⊙.
In GAH11 we argue that the very first population of stars (so-called Pop III stars) are not likely to be the main sources of high dust masses at high redshift. Thus we consider only the next generations of stars (Pops II or I). The formation of these stars takes place as soon as a critical metallicity of Zcr ~ 10-6–10-4 Z⊙ (Bromm & Loeb 2003; Schneider et al. 2006; Tumlinson 2006) is reached in the star-forming region. In this regard we assume an initial metallicity in accordance with the critical metallicity of Zini = Zcr = 10-6 Z⊙.
Pertaining to the rather high derived star formation rates from observations of some high-z massive galaxies and QSOs (e.g. Frayer et al. 1999; Bertoldi et al. 2003a; Riechers et al. 2007), we consider an initial SFR of ψini = 1 × 10³ M⊙ yr-1. The evolution is determined using the Kennicutt law as described in Sect. 2.1, Eq. (2). We also consider a case of constant SFR where ψ(t) = ψini = 1 × 10³ M⊙ yr-1.
In our model the onset of starburst is not directly connected to redshift, so, the age of the galaxy is identical to the evolutionary time after starburst. For dusty galaxies seen at redshift 5–6 the earliest onset of starburst with very high SFRs can be considered to have taken place at z ⋍ 10. For a ΛCDM universe with H0 = 70 km s-1 Mpc-1, ΩΛ = 0.73 and Ωm = 0.27 and Ωb = 0.04 (Spergel et al. 2003), the evolutionary time of interest for building up high dust masses possibly lies then within 400–500 Myr. We have computed all models presented in this paper up to an age of the galaxy of tmax = 1 Gyr.
3.2. The initial mass function
IMF and the adopted values.
The initial mass function is an important parameter influencing the evolution of dust, gas, and metals in a galaxy. It determines the mass distribution of a population of stars with a certain ZAMS mass. In models of dust evolution in galaxies and high-z quasars (e.g., Morgan & Edmunds 2003; Dwek et al. 2007), an IMF first proposed by Salpeter (1955) is often used. However, for starburst galaxies there is also observational evidence of a top-heavy IMF (e.g. Doane & Mathews 1993; Tumlinson 2006; Dabringhausen et al. 2009; Habergham et al. 2010).
In view of this, we consider a set of five different IMFs. The power-law IMFs (Salpeter, mass heavy and top-heavy) have the form φ(m) ∝ m − α. The lognormal Larson IMFs (Larson 1998) are given as φ(m) ∝ m − (α + 1)exp(−mch/m), where mch is the characteristic mass. Their parameters are presented in Table 1.
The influence of the diverse IMFs, particularly on the dust production rates from stellar sources, is demonstrated in GAH11.
List of all model parameters.
3.3. Stellar yields
The model is adapted to published results from stellar evolution models. Using these models the metallicity dependent upper and lower mass limits of the mass range of diverse SNe subtypes can be determined. For comparison to the usually adopted treatment of SNe we calculate simplified models with a fixed mass range for CCSNe between 8–40 M⊙ and use stellar yields from nucleosynthesis calculations for SNe. For SNe we adopt three different structural models.
3.3.1. SN yields from stellar evolution models
We adopt the stellar yields for the hydrogen mass MH(m,Z) in the envelope, the He core mass Mcore(m,Z), and the final mass Mfin(m,Z) of the progenitors, as well as YE(m,Z) and YZ(m,Z) from the single stellar evolution models by Eldridge et al. (2008, herafter EIT08. These yields are based on previous works (Eldridge & Tout 2004, 2005). EIT08 adopt a mass loss prescription using the rates of de Jager et al. (1988) with the rates of Vink et al. (2001) for pre-Wolf-Rayet (WR) and from Nugis & Lamers (2000) for WR evolution including overshooting. In their study, this model is closest to a set of SN progenitor observations.
Eldridge & Tout (2004, 2005) also show that all stars end up as II-P SN at metallicities roughly below Z = 10-4, while with increasing metallicity the upper mass limit for II-Ps decreases; i.e., at solar metallicity it is at roughly 28 M⊙. type II-P SNe are per definition all stars that have retained at least 2 M⊙ of hydrogen in their envelopes at their pre SN stage (Heger et al. 2003). Since mass loss is more efficient at higher metallicities, the upper mass limit for II-P supernovae decreases.
With increasing metallicity further types of CCSNe such as IIL, Ib, and Ic SNe arise. The upper limit for IILs is defined by the small hydrogen fraction of ~0.1 M⊙ in the envelope. In case little or no hydrogen in the envelope of the progenitor is present, SNe appear as types Ib or Ic. The SNe arising from the higher mass end of all type IIs are the subtypes IIb or IIn. These types are difficult to fit into a quiescent mass loss prescription and are not specified by EIT08. Thus we simply assume that these subtypes may be part of the fraction of SNe, which is determined as IIL in the models of Eldridge & Tout (2004). These SNe will be collectively referred to as the remaining type II supernovae.
We define the conditions for determining the lower mSL,(i) and upper mSU,(i) boundaries of the different SN subtypes analogous to Eldridge & Tout (2004) as given in Table 3. The masses MH(m,Z) and Mcore(m,Z) are dependent on metallicity. Therefore the lower and upper mass limits for these SN types are mSL,(i) = mSL,(i)(Z) and mSU,(i) = mSU,(i)(Z). The lower mass limit for type II-P SNe is fixed at mSL,IIP(Z) ≡ mSL,IIP = 8 M⊙. The absolute upper mass limit for the most massive stars is the cutoff mass defined by the IMF, thus mSU,(i)(Z) ≡ mSU,(i) = m2.
The criterion for direct BH formation is based on the system used by Heger et al. (2003) and Eldridge & Tout (2004). A direct BH forms when the final He
core mass Mcore(m,Z) exceeds the critical
He core mass,  M⊙.
Models using yields from EIT08 will be referred
to as “EIT08M”.
M⊙.
Models using yields from EIT08 will be referred
to as “EIT08M”.
3.3.2. SN yields from rotating stellar models
We take the yields for MH(m,Z), Mfin(m,Z), YE(m,Z), and YZ(m,Z) from Georgy et al. (2009). Rotationally enhanced mass loss becomes very efficient with increasing metallicity. The mass loss description used in their models are from Meynet & Maeder (2003, 2005) with a rotational velocity of 300 km s-1. Provided that a SN occurs even if a BH is formed, the resulting range for type II SN (without further subdivision) is between 8–54 M⊙ at a metallicity Z = 0.004 Z⊙. However, only stars between 8–25 M⊙ form neutron stars. At Z⊙ the type II mass range becomes narrower (8–25 M⊙) and stars above the upper limit will become WR stars and explode as Ib/c SNe. The range for neutron stars at this metallicity extends up to 35 M⊙.
To determine the lower mSL,(i)(Z) and upper mSU,(i)(Z) mass limits for the considered SNe types and remaining stars (i = IIP, II, Ib/c, R), we appled the same definitions as described for the EIT08M models. However, the direct BH cut is constrained by the mass of the remnant star Mrem(m,Z) instead of Mcore(m,Z). We follow the notation for the BH formation by Georgy et al. (2009), where a BH forms when Mrem(m,Z) > 2.7 M⊙. Models where these yields and the above SN type division and BH formation are applied, are referred to as “G09M”.
3.3.3. Models with fixed SN mass range
A treatment in which the boundaries of the mass range for all considered dust-forming supernovae and remaining stars are fixed throughout the evolution is quite common and has been used in previous models (e.g. Dwek 1998; Morgan & Edmunds 2003; Dwek et al. 2007; Valiante et al. 2009).
We used the stellar yields for YE(m,Z), YZ(m,Z) and certain elements YQ(m,Z) with Q = C, O from nucleosynthesis models of either Woosley & Weaver (1995, hereafter WW95 or Nomoto et al. (2006) (herafter N06). All SNe are of type II and considered to be within the mass interval mL,(II) = 8 M⊙ and mU,(II) = 40. Yields for the final mass prior to explosion are not available, thus in all equations YWIND = 0.
The remaining very massive stars between mL,(R) = mU,(II) = 40 and the upper limit mU,(R) = m2 are assumed to turn into BHs. We apply the yields from EIT08 to these remaining stars in order to account for the gas return into the ISM from their mass loss phase according to Eqs. (11) and (12). Thus, the option of whether a SN explosion occurs or not is retained.
The models with stellar yields from WW95 will be referred to as “WW95M” and the models with yields from N06 will be referred to as “N06M”.
Definitions of stellar types.
3.3.4. AGB stars
For high-mass AGB stars we use the stellar yields for the total ejected mass YE(m,Z), the metals YZ(m,Z) and certain elements YQ(m,Z) with Q = C, O from van den Hoek & Groenewegen (1997). The mass interval is set to a fixed mass range of mL,(i) = 3 M⊙ and mU,(i) = 8 M⊙, i = AGB. AGB stars with masses below 3 M⊙ are not considered.
3.4. AGB star and SN dust production efficiencies
The values for the AGB star and SN dust production efficiencies are derived from
observationally and theoretically determined dust yields. The dust production efficiency
per stellar mass and metallicity, ϵi(m,Z), is
calculated as 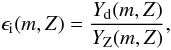 (21)where
Yd(m,Z) is assumed to be the final amount
of dust ejected into the ISM (i.e., produced and possibly processed through shock
interactions).
(21)where
Yd(m,Z) is assumed to be the final amount
of dust ejected into the ISM (i.e., produced and possibly processed through shock
interactions).
For AGB stars, we adopted for Yd(m,Z) the theoretically derived total dust yields from Ferrarotti & Gail (2006) and for YZ(m,Z) the yields from van den Hoek & Groenewegen (1997). We calculated the AGB star efficiency for different metallicities. For illustration, we show the metallicity-averaged efficiency, ϵAGB(m), which is representative of the trend of the metallicity-dependent ϵAGB(m,Z) in Fig. 1. One notices that, on average, AGB stars between 3–4 M⊙ are the most efficient dust producers.
For the dust production efficiency for SNe we used two plausible limits: (i) an upper limit that was motivated by theoretical SN dust formation models; and (ii) a lower limit based on dust masses inferred from observations of older SN remnants, such as Cas A, B0540 − 69.3, Crab nebula, and 1E0102.2 − 7219 (e.g., Douvion et al. 2001; Bouchet et al. 2004; Green et al. 2004; Krause et al. 2004; Temim et al. 2006; Rho et al. 2008; Sandstrom et al. 2008; Williams et al. 2008; Dunne et al. 2009; Barlow et al. 2010). For the upper limit we applied two different combinations of the dust and metal yields, which are (i) Yd(m,Z) from Todini & Ferrara (2001) with YZ(m,Z) from WW95 and (ii) Yd(m,Z) from Nozawa et al. (2003) with YZ(m,Z) from N06. Averaging the obtained efficiencies over Z leads to the metallicity independent “maximum” SN dust production efficiency, ϵmax(m). For the lower limit an average dust mass of 3 × 10⁻³ M⊙ inferred from the SN remnants is applied to all SNe in the mass range 8–40 M⊙. To calculate the SN dust production efficiency, stellar yields from WW95, N06, and EIT08 are used. The efficiencies obtained with these yields are averaged, constituting the “low” SN dust production efficiency, ϵlow(m).
Applying a dust destruction factor (see Sect. 2.2) to ϵmax(m) results in a reduced dust production efficiency. We refer to this efficiency as “high” SN dust-production efficiency, ϵhigh(m) = ξSNϵmax(m). The amount of dust (~2–6 × 10⁻² M⊙) produced per SN with this efficiency is comparable to the higher dust masses derived in older SN remnants.
We used a dust destruction coefficient, ξSN = 0.93, following Bianchi & Schneider (2007). These SN efficiencies may possibly also arise from different scenarios of dust formation, such as grain growth and shock interactions in SN remnants. The averaged SN efficiencies ϵmax(m) and ϵlow(m), as well as the “high” SN efficiency, ϵhigh(m), are seen in Fig. 1.
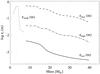 |
Fig. 1 Dust-production efficiencies of massive stars. The dashed line represents the “maximum” SN efficiency ϵmax(m) and the dashed dotted line the “high” SN efficiency ϵhigh(m). The solid line is the “low” SN efficiency ϵlow(m). The left dotted line represents the metallicity-averaged AGB efficiency ϵAGB(m). The vertical line marks the least massive (3 M⊙) AGB star considered. |
3.5. Dust destruction in the ISM
Once a dust grain is injected into the interstellar medium, it is subject to either growth or to disruptive or destructive processes. We here focus on the destructive and disruptive ones due to supernova shocks.
Disruptive processes are those that lead to fragmentation of large dust grains (radius > 1000 Å) into smaller dust grains (radius < 500 Å). Jones et al. (1996) found that shattering due to grain-grain collisions dominates vaporization and therefore also determines the grain size redistribution, which is shifted towards smaller grains.
Destructive processes return dust grains back into the gas phase. The main destruction of dust grains in the ISM comes from the sputtering caused by interstellar shock waves with shock velocities ≥ 100 km s-1 (Seab 1987; Jones et al. 1996). The destruction takes place because of high-velocity gas-grain impacts of smaller projectiles (radius < 100 Å), such as energetic He+ ions, onto dust grains. This results in the removal of dust species at or near the surface of the grains.
A dust grain is exposed to thermal and nonthermal sputtering, as well as to vaporization
during the passage of the shock. Jones et al.
(1996) also found that graphite grains are mainly destroyed by thermal
sputtering. Silicates are equally affected by thermal and non-thermal sputtering in
high-velocity shocks with velocities
vs > 150 km s-1, while vaporization is
negligible. These processes determine the lifetime of dust grains in the ISM. The
timescale τdl(t) of the dust grains against
destruction, or simply the lifetime of the dust grains, and the dust destruction rate in
the ISM ED,ISM(t) are given (McKee 1989; Dwek
1998; Dwek et al. 2007) through
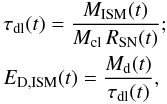 (22)where
MISM(t) is the mass of the ISM and
RSN(t) the supernova rate of all supernovae
causing the destruction. The mass Mcl is the mass of the ISM,
which is completely cleared of dust through one single supernova remnant. These two
equations combined lead to an expression for
ED,ISM(t) in the form
(22)where
MISM(t) is the mass of the ISM and
RSN(t) the supernova rate of all supernovae
causing the destruction. The mass Mcl is the mass of the ISM,
which is completely cleared of dust through one single supernova remnant. These two
equations combined lead to an expression for
ED,ISM(t) in the form  (23)which shows that
besides RSN(t) and
Mcl, the dust destruction rate in the ISM also depends on
the dust-to-gas ratio ηd(t).
(23)which shows that
besides RSN(t) and
Mcl, the dust destruction rate in the ISM also depends on
the dust-to-gas ratio ηd(t).
An expression for Mcl which is dependent on the shock velocity is given by Dwek et al. (2007). For a homogenous ISM and under the assumption that silicon and carbon grains are equally mixed, Dwek et al. (2007) obtains Mcl = 1100–1300 M⊙. However, the ISM is inhomogeneous, characterized by cold, warm, and hot phases with different densities (e.g., McKee 1989, and references therein). The density contrast between the cold and warm phases and the hot phase can be relatively large. Shocks traveling through these phases are found to be very inefficient in destroying dust (Jones 2004). The destruction process is solely effective in the warm (T > 100 K) phase of the interstellar medium, while SN shocks propagating through either a hot ISM with low density or cold clouds (atomic and molecular) do not destroy dust effectively (e.g., McKee 1989).
Another important parameter is the injection timescale of stellar yields and dust into the ISM. Following McKee (1989), we estimate the injection timescale of the dust from stellar sources as
 (24)In GAH11 we made a rough
estimate of the minimum averaged dust injection rate from SNe and AGBs of
0.5 M⊙ yr-1 based on data for
high-z QSOs. Using this dust injection rate we obtained an average
injection time
τin(t) = 4 × 10⁸ yr.
(24)In GAH11 we made a rough
estimate of the minimum averaged dust injection rate from SNe and AGBs of
0.5 M⊙ yr-1 based on data for
high-z QSOs. Using this dust injection rate we obtained an average
injection time
τin(t) = 4 × 10⁸ yr.
For comparison we estimate the lifetime τdl(t) of the dust grains. The mass of the ISM is assumed to be MISM = 2 × 10¹⁰ M⊙. The SN rates are calculated for a constant SFR of 500 M⊙ yr-1 and for a Larson 2 IMF. This results in a timescale of τdl(t) ~ 1.3 × 10⁷ yr for Mcl = 100 M⊙. A shorter timescale τdl(t) ~ 1.6 × 10⁶ yr is obtained for Mcl = 800 M⊙. When using a Salpeter IMF for the SN rates, the timescales are usually longer (τdl(t) ~ 6.6 × 10⁷ yr, for Mcl = 100 M⊙).
We note that this is a rather rough estimate. Typically τin(t) and τdl(t) are strongly dependent on the IMF, MISM(t) and the SNe dust production efficiency ϵi(m,Z). Hence, the values will deviate from the above estimated average during evolution.
However, this example demonstrates that the dust injection timescale can be longer than the lifetimes of the dust grains. The difference between these timescales is influenced by the value of Mcl. Pertaining to the formation of high dust masses in galaxies, this has significant consequences. An injection timescale τin(t) longer than the destruction timescale τdl(t) does not allow the build up of high dust masses in the galaxy. This implies that the dust injection rate must be higher than the dust destruction rate. A lowering of the dust destruction rate could be achieved if dust grains are shielded from destruction. Alternatively, a rapid dust grain growth in the ISM might be an option, if SNe and AGBs cannot generate the necessary high dust injection rate. Grain growth, however, is not incorporated into our model and remains to be investigated.
Furthermore, we assume that the starburst occurs in an initially dust free galaxy. Consequently dust produced by the first generations of SNe might be ejected into the ISM unhindered. The epoch at which the first SN shocks are able to sweep up ISM gas mixed with dust remains elusive. In view of these considerations, we stress that dust destruction in the ISM is uncertain, particularly when considering galaxies with conditions as described in Sects. 3.1 and 3.2.
Despite our simple assumption of dust being immediately homogeneously mixed with the gas in the ISM, we account for the uncertainty of the lifetime of dust grains against destruction by using Mcl as a parameter. This has also been done by Dwek et al. (2007). The considered cases are for Mcl = 800 M⊙ as the highest destruction, Mcl = 100 M⊙ for modest destruction, and Mcl = 0 for no dust destruction.
4. Results
In this section we present the results of several models calculated within the first Gyr after starburst. We focus on the total dust mass in a galaxy. At redshift z > 6, the time to build up high dust masses of > 108 M⊙ is limited to 400–500 Myr. Models able to exceed an amount of 108 M⊙ of dust within this time are therefore of particular interest. General evolutionary tendencies of certain quantities, such as dust injection rates, SFR, metallicity, or the amount of gas, are also discussed. In this paper we present results that assume the same value for the initial SFR in all models as given in Table 2. In Gall et al. (2011), we investigated models for different initial SFRs and discuss their applicability to particular quasars at z ≳ 6.
4.1. Evolution of dust, dust-to-gas, and dust-to-metal ratios
We study models with all considered initial gas masses Mini. The models discussed are calculated for the case that no SN occurs when a BH is formed (see Sect. 2.2.1). Models including SMBH formation are deferred to Sect. 4.5.
4.1.1. Models with SN type differentiation
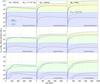 |
Fig. 2 Evolution of the total dust mass and dust destruction rates for EIT08M. The initial gas mass of the galaxy Mini = 5 × 10¹¹ M⊙. Calculations are performed for a “maximum” (top row), a “high” (middle row), and a “low” (bottom row) SN dust production efficiency ϵi(m). Dust destruction is taken into account for Mcl = 800 M⊙ (left column), 100 M⊙ (middle column), and 0 M⊙ (right column). The bottom group of curves in the light blue area represents the total dust destruction rate ED(t), which is based on Eq. (16). The upper group of curves in the green or yellow zones displays the evolution of the total amount of dust Md(t) in the galaxy. The yellow area marks dust masses exceeding 108 M⊙ of dust. The grey horizontal dashed line marks the limit of 108 M⊙ of dust. The grey vertical dashed lines indicate epochs at 100, 170, 400, and 500 Myr after the onset of starburst. The black solid, green dotted, cyan dashed, magenta dashed-dotted, and blue dashed-dot-dotted lines represent the Salpeter, mass-heavy, top-heavy, Larson 1 and Larson 2 IMF, respectively. |
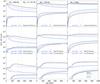 |
Fig. 3 Evolution of the dust-to-gas and dust-to-metal mass ratios for EIT08M. The initial gas mass of the galaxy Mini = 5 × 10¹¹ M⊙. Calculations are performed for a “maximum” (top row), a “high” (middle row), and a “low” (bottom row) SN dust production efficiency ϵi(m). Dust destruction is taken into account for Mcl = 800 M⊙ (left column), 100 M⊙ (middle column), and 0 M⊙ (right column). The upper group of curves signifies the dust-to-metal mass ratio ηZd(t). The lower group of curves represents the dust-to-gas mass ratio ηd(t). The gas-to-dust ratio displayed in the figures is calculated for a Larson 2 IMF at an epoch of 400 Myr. The grey vertical dashed lines indicate epochs at 100, 400, and 500 Myr after the onset of starburst. The black solid, green dotted, cyan dashed, magenta dashed-dotted, and blue dashed-dot-dotted lines represent the Salpeter, mass-heavy, top-heavy, Larson 1 and Larson 2 IMF, respectively. |
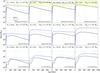 |
Fig. 4 Evolution of the total dust mass for EIT08M. Calculations for galaxies with initial gas masses of Mini = 5 × 10¹⁰ M⊙ are presented in the first and second columns and for Mini = 1 × 10¹¹ M⊙ in the third and fourth columns. Total dust masses Md(t) are shown for a “maximum” (top row), a “high” (middle row), and a “low” (bottom row) SN dust production efficiency ϵI(m). Dust destruction is taken into account for Mcl = 100 M⊙ (first and third columns) and 0 M⊙ (second and fourth columns). Maximum dust masses exceeding 108 M⊙ are indicated as yellow shaded zones. The grey horizontal dashed line marks the limit of 108 M⊙ of dust. The grey vertical dashed lines indicate epochs at 400, and 500 Myr after the onset of starburst. The black solid, green dotted, and blue dashed-dot-dotted lines represent the Salpeter, mass-heavy and Larson 2 IMF, respectively. |
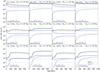 |
Fig. 5 Evolution of the dust-to-gas and dust-to-metal mass ratios for EIT08M. Calculations for galaxies with initial gas masses of Mini = 5 × 10¹⁰ M⊙ are presented in the first and second columns and for Mini = 1 × 10¹¹ M⊙ in the third and fourth columns. Results are presented for a “maximum” (top row), a “high” (middle row), and a “low” (bottom row) SN dust production efficiency ϵi(m). Dust destruction is taken into account for Mcl = 100 M⊙ (first and third columns) and 0 M⊙ (second and fourth columns). The upper group of thick curves signifies the dust-to-metal mass ratio ηZd(t). The lower group of thin curves represents the dust-to-gas mass ratio ηd(t). The gas-to-dust ratio displayed in the figures is calculated for a Larson 2 IMF at an epoch of 400 Myr. The grey vertical dashed lines indicate epochs at 400, and 500 Myr after the onset of starburst. The black solid, green dotted, and blue dashed-dot-dotted lines represent the Salpeter, mass-heavy and Larson 2 IMF, respectively. |
EIT08M with Mini = 5 × 10¹¹ M⊙:
in Fig. 2 the results are presented for the mass of dust Md(t) in a galaxy with Mini = 5 × 10¹¹ M⊙. Calculations were performed for a “maximum” (top row), a “high” (middle row), and a “low” (bottom row) SN dust production efficiency ϵi(m). Dust destruction in the ISM is included for three values of Mcl (see Sect. 3.5). This model is considered as a reference model. We therefore describe it in detail.
Dust masses Md(t) obtained with the “maximum” SN dust production efficiency ϵmax(m) exceed 108 M⊙ of dust in all cases of Mcl and for all IMFs. In fact, 108 M⊙ of Md(t) is reached within the first few Myr. This is insensitive to both the IMF and the amount of Mcl. The latter however determines the suppression of Md(t) as the system evolves. For Mcl = 800 M⊙ (top left), a maximum amount of ~4 × 10⁸ M⊙ is reached for a Larson 2 IMF and sustained until the end of the computation. Only the IMFs favouring lower masses exhibit a shallow decline in Md(t). Dust destruction with Mcl = 100 M⊙ (top middle) leads to nearly constant dust masses retainable over 1 Gyr of evolution. The amount of dust for most IMFs is a few times 109 M⊙. When assuming no dust destruction (top right), a broader spread of the dust masses for the different IMFs develops. The amount of dust increases with time regardless of the IMF and yields up to 109 − 10 M⊙ are reached.
In the case of “high” SN dust production efficiency, ϵhigh(m), similar trends are featured. However the amount of dust is lower. Without dust destruction (Mcl = 0), dust masses up to a few times 108 M⊙ are attained for all IMFs (Fig. 2 middle right). The timescale to exceed 108 M⊙ of dust ranges from 80 Myr (Larson 2 IMF) up to 400 Myr (Salpeter IMF). Taking dust destruction with only a modest amount of Mcl = 100 M⊙ into account decreases Md(t) substantially (Fig. 2 middle middle). The IMFs favouring high masses are most affected, while the reduction in Md(t) for a Salpeter IMF is small. Except for the Salpeter IMF, all remaining IMFs lead to more than 108 M⊙ of dust. The highest amount of dust is reached with either a Larson 2 or a mass-heavy IMF, and is ~2 × 10⁸ M⊙ at an epoch of ~400 Myr. Considering a very high destruction with Mcl = 800 M⊙ results in a strong reduction of Md(t), so only ~2–3 × 10⁷ M⊙ of dust remains throughout the evolution (Fig. 2 middle left).
The results for Md(t) with a “low” SN dust production efficiency ϵlow(m) are dominated by AGB dust production (see also GAH11). Without dust destruction, dust masses up to 1–2 × 10⁸ M⊙ is reached after ~300–500 Myr for most of the IMFs. Applying a modest dust destruction of Mcl = 100 M⊙ reduces Md(t) analogously to the higher SN efficiencies ϵmax(m) or ϵhigh(m). Dust masses for either the top-heavy or the Larson 2 IMF are efficiently decreased and comparable to Md(t) for a Salpeter IMF. Increasing Mcl to 800 M⊙ leads to a stronger reduction in Md(t) for these IMFs, resulting in lower dust masses than for a Salpeter IMF.
A considerable difference in the progression of Md(t) for the “low” SN efficiency ϵlow(m) compared to the higher SN efficiencies is encountered during the first ~200 Myr. While a fast rise of Md(t) is identifiable for either ϵmax(m) or ϵhigh(m), for ϵlow(m) the dust mass remains between 106 − 7 M⊙ during this epoch. This is caused primarily by high-mass AGB stars with short lifetimes ( > 4–5 M⊙). A further increase in the dust mass due to the delayed AGB dust injection from the less massive but more efficient AGB stars results in a second dust bump at an epoch of ~200–300 Myr. High dust masses at early epochs (100–200 Myr) are not possible with ϵlow(m).
The curves at the bottom of the light-blue area in Fig. 2 represent the dust destruction rate ED(t). For Mcl = 0 and independent of ϵi(m) the dust destruction rate reflects the amount of dust incorporated into stars per unit time and is calculated as ED(t) = ηd(t) ψ(t). For Mcl > 0 ED(t) is given by Eq. (16) and additionally consists of the destroyed dust in the ISM, ED,ISM(t).
We find that ED(t) increases faster and earlier with increasing Mcl. Consequently, dust destruction rates comparable to SN injection rates are reached at earlier epochs. Given Eq. (23) for the amount of dust destroyed through SN shocks, the high SN rates RSN(t) at the beginning of evolution in conjunction with Mcl lead to a high base value of ED,ISM(t). This suppresses the rise in the amount of dust at early epochs. Additionally, SN rates are higher for the IMFs biased towards more massive stars affecting these IMFs most. Later in the evolution, the dust destruction rates remain almost constant in most cases, with a marginal increase for Mcl = 0 or decline for Mcl > 0. Dust destruction and injection appear to be balanced, resulting in the flat development of Md(t).
In Fig. 3 we present the results for the evolution of the dust-to-gas mass ratio ηd(t) and the dust-to-metal mass ratio ηZd(t). Commonly the curves for ηd(t) for all IMFs are slowly increasing with time except for Mcl = 800 M⊙ for which they remain approximately constant. Interestingly, in this case and for ϵmax(m), the dust-to-gas ratio for all IMFs sustains a constant value of ~10-3 over the whole evolution. Without dust destruction (top right), ηd(t) increases up to values above ~10-2 for most of the IMFs. For either a “high” or “low” SN efficiency, the values are below ~10-3. Only for ϵhigh(m) and Mcl = 0 (middle right) is ηd(t) further increased. These overall trends show that ηd(t) can be very low for massive galaxies even if the galaxy appears dusty.
The dust-to-metal mass ratio ηZd(t) is significantly lower for the Larson 2 and top-heavy IMF than for the other IMFs. This feature is exhibited in all calculated models. The degree of this separation between different IMFs depends primarily on the SN dust production efficiency and secondly on the destruction rate in the ISM, and is larger for ϵlow(m). This reflects the decrease in the SN dust production efficiency towards the higher mass end of the SN mass interval. Additionally, type Ib/c SNe produce no dust, but they do inject metals into the ISM at higher rates for the top-heavy IMFs. For Mcl = 0 and ϵhigh(m), the amount of metals bound in dust grains is between ~1.5–3%. For Mcl = 100 M⊙ the fraction of metals bound in dust grains for the two IMFs favouring high masses is below 1% and decreases further with increasing Mcl. Generally, for a “low” SN efficiency, ηZd(t) remains below 10-2 for all IMFs. For the “maximum” SN efficiency ϵmax(m) the dust-to-metal ratio, ηZd(t), is about a factor of 10 higher than for ϵhigh(m).
EIT08M with Mini = 1 × 10¹¹M⊙:
in Fig. 4 (two right columns) the results are presented for Md(t) in cases of either no or a modest destruction and all three SN dust formation efficiencies ϵmax(m), ϵhigh(m), ϵlow(m).
The top row of Fig. 4 depicts the evolution of the amount of dust Md(t) for ϵmax(m). It is evident that high dust masses beyond 108 M⊙ are obtained for both cases of Mcl. The maximum value for Md(t) is already reached shortly after the onset of the starburst. Thereafter Md(t) follows a negative slope, which is steepest for the IMFs biased towards low-mass stars. This decline is generally observable in all cases of Mcl and ϵi(m). The cause of this is that dust is incorporated into stars on higher rates than is replenished by stellar sources. This dust decrease is amplified by dust destruction in the ISM as is demonstrated for Mcl = 100 M⊙. For ϵhigh(m) and Mcl = 0, a high total dust mass ≥ 108 M⊙ can be achieved with a Larson 2 IMF after ~200 Myr (Fig. 4 middle row, right column). For all remaining cases of either Mcl or for ϵlow(m) and regardless of the IMF, Md(t) stays below 108 M⊙. The tendencies for the various IMFs resemble those identified for Mini = 5 × 10¹¹ M⊙.
The curves of the dust-to-gas ratio ηd(t) and the dust-to-metal ratio ηZD(t) are also similar to the system with Mini = 5 × 10¹¹ M⊙, although the amount is higher (see Fig. 5 two left columns). For Mcl = 0 and “maximum” SN efficiency, ηd(t) is roughly independent of the IMF, while exhibiting a wider range for ϵlow(m). The fraction of metals bound in dust grains is ≲ 4% (Mcl = 0) for IMFs favouring low-mass stars and ϵhigh(m); for ϵmax(m) it is roughly 20–30%.
EIT08M with Mini = 5 × 10¹⁰M⊙:
The evolution of Md(t) within the first Gyr exhibits similar, but more strongly pronounced, tendencies for the various IMFs as the galaxy system with Mini = 1 × 10¹¹ M⊙. Results are presented in Fig. 4 (two left columns). Even with a “maximum” SN efficiency ϵmax(m), large dust masses of a few times 108 M⊙ cannot be reached or sustained when dust destruction in the ISM is considered. In Fig. 5 (two left columns) it is evident that the dust-to-gas ratios ηd(t) and the dust-to-metal ratios ηZD(t) result in higher values than for the higher mass galaxy systems (see Figs. 3, 5 two right columns). The tendencies are the same in general.
G09M:
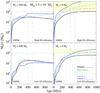 |
Fig. 6 Evolution of the total dust mass for G09M, presented for a galaxy with Mini = 5 × 10¹¹ M⊙. Total dust masses Md(t) are shown for a “high” (top row) and a “low” (bottom row) SN dust production efficiency ϵi(m). Dust destruction is taken into account for Mcl = 800 M⊙ (left column) and 0 M⊙ (right column). Maximum dust masses exceeding 108 M⊙ are indicated as yellow shaded zones. The grey horizontal dashed line marks the limit of 108 M⊙ of dust. The grey vertical dashed lines indicate epochs at 400 and 500 Myr after the onset of starburst. The black solid, green dotted, cyan dashed, magenta dashed-dotted, and blue dashed-dot-dotted lines represent the Salpeter, mass-heavy, top-heavy, Larson 1, and Larson 2 IMF, respectively. |
in Fig. 6 the results are shown for models with a rotationally enhanced mass-loss prescription. The galaxy under consideration has Mini = 5 × 10¹¹ M⊙. The outcome is similar to the reference EIT08M (Fig. 2), although the obtained dust yields are increased for the IMFs favouring higher masses. For a Larson 2 IMF, Md(t) exceeds 109 M⊙ after ~650 Myr. Interestingly, even though the dust yields are high for no dust destruction in the ISM, for Mcl = 800 M⊙ the dust mass also stays below 108 M⊙. In case of a “low” SN dust production efficiency, 108 M⊙ cannot be reached within the first 400 Myr. However, for the IMFs biased towards high masses an amount of dust > 108 M⊙ is attained later in the evolution.
4.1.2. Models with fixed SNe mass range
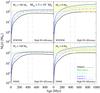 |
Fig. 7 Evolution of the total dust mass for WW95M (top row) and N06M (bottom row). Both models are presented for a galaxy with Mini = 5 × 10¹¹ M⊙. Total dust masses Md(t) are shown for “high” SN dust production efficiency ϵhigh(m). Dust destruction is taken into account for Mcl = 100 M⊙ (left column) and 0 M⊙ (right column). Maximum dust masses exceeding 108 M⊙ are indicated as yellow shaded zones. The grey horizontal dashed line marks the limit of 108 M⊙ of dust. The grey vertical dashed lines indicate epochs at 400 and 500 Myr after the onset of starburst. The black solid, green dotted, cyan dashed, magenta dashed-dotted, and blue dashed-dot-dotted lines represent the Salpeter, mass-heavy, top-heavy, Larson 1, and Larson 2 IMF, respectively. |
In Fig. 7 the results of Md(t) are shown for WW95M (top row) and N06M (bottom row) for a galaxy with Mini = 5 × 10¹¹ M⊙ and “high” SN efficiency ϵhigh(m). The amount of dust in N06M early in the evolution is greater than for WW95M for the IMFs favouring massive stars, but flattens later, leading to slightly lower dust masses than achieved with WW95M. The dust masses achieved with either the “maximum” or the “low” SN dust production efficiencies are nearly identical to EIT08M and are therefore not shown. Generally, the evolution of these models is similar to EIT08M.
4.1.3. Very high Mini and the case of constant SFR
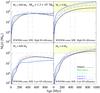 |
Fig. 8 Evolution of the total dust mass for WW95M with constant SFR. WW95M is presented for a galaxy with Mini = 1.3 × 10¹² M⊙. Total dust masses Md(t) are shown for “high” (top row) and a “low” (bottom row) SN dust production efficiency ϵi(m). Dust destruction is taken into account for Mcl = 800 M⊙ (left column) and 0 M⊙ (right column). Maximum dust masses exceeding 108 M⊙ are indicated as yellow shaded zones. The grey horizontal dashed line marks the limit of 108 M⊙ of dust. The grey vertical dashed lines indicate epochs at 400 and 500 Myr after the onset of starburst. The black solid, green dotted, cyan dashed, magenta dashed-dotted, and blue dashed-dot-dotted lines represent the Salpeter, mass-heavy, top-heavy, Larson 1, and Larson 2 IMF, respectively. |
In Fig. 8 the results are displayed for a case with constant SFR ψ(t) = 1 × 10³ M⊙ yr-1 and a galaxy with a high initial gas mass of Mini = 1.3 × 10¹² M⊙. Such a high Mini is necessary when assuming a constant SFR, since in the lower mass galaxies the available mass for star formation gets exhausted before an age of 1 Gyr is reached.
We find that a build up of high dust masses also for such massive galaxies is greatly suppressed with a high amount of destruction. With none of the IMFs, 108 M⊙ of dust is attained, apart from the models with ϵmax. High dust masses with either ϵhigh or ϵlow are only possible in case of modest or no dust destruction. For the latter the results are shown in the right column of Fig. 8. Interestingly, also for “low” SN dust production efficiency, dust masses > 108 M⊙ are possible after ~300–400 Myr.
The results are very similar to an EIT08M with such high Mini and an evolving SFR. A slight difference appears for Md(t) and IMFs that favour low-mass stars. These models remain close to constant after 500–600 Myr, while the models for constant SFR slowly decline. The similarity between these models can be explained by the very high mass of the galaxy. In neither model does the ISM mass get significantly reduced.
4.2. Evolution of dust production rates, SFR and metallicity
In Fig. 9 we present the evolution of quantities such as the total dust injection rates Ed,SN(t), Ed,AGB(t), the AGB and SNe rates RAGB(t), RSN(t), the SFR and the metallicity Z(t) for a range of initial galaxy gas masses. The rates and the metallicities are independent of the assumed dust formation efficiency and can be discussed for each initial mass Mini. The results for these quantities, which come from EIT08M, WW95M, and N06M with identical parameter setting, are very similar. Consequently these quantities are discussed based on EIT08M. The upper row of Fig. 9 shows the dust injection rates of AGB stars Ed,AGB(t) and SNe Ed,SN(t). For supernovae Ed,SN(t) is highest for a Larson 2 IMF and lowest for a Salpeter IMF.
The SN dust production rates are approximately one order of magnitude lower for ϵlow(m) than for ϵhigh(m). Similar difference is the case between ϵhigh(m) and ϵmax(m). In all cases a clear separation of the values of Ed,SN(t) amongst the various IMFs is pronounced throughout the evolution.
The dust injection rates for AGB stars, Ed,AGB(t), are considerably influenced by the long lifetimes. After ~200 Myr the AGB dust production rates Md,AGB(t) are comparable to the dust injection rates for SNe with ϵhigh(m). This is caused by the higher dust production efficiency for AGB stars between ~3–4 M⊙, leading to larger amounts of dust produced than for AGB stars in the mass range of 4–8 M⊙ (see Sect. 3.4). The small variations in Ed,AGB(t) are mainly due to alteration of the stellar yields and dust formation efficiencies at different metallicities.
The SNe and AGB dust injection rates decline as a consequence of decreasing SNe and AGB rates, as shown in Fig. 9 (second row). Both rates exhibit a faster decline for the lower massive galaxies and for IMFs biased towards the intermediate and low mass stars.
This behaviour is determined by the slope of the SFR, which depends on the initial mass of the galaxy (see Fig. 9 third row). The decline in the SFR for systems with Mini ≥ 3 × 10¹¹ M⊙ is shallower. For these galaxies, a high SFR of a few hundred M⊙ yr-1 can be sustained over at least 1 Gyr of evolution. For the lower mass galaxies, the SFR declines faster and exhibits a strong dependence on the IMFs. At a time of 400 Myr the SFR for a galaxy with Mini = 1 × 10¹¹ M⊙ is between 60 (Salpeter) to 500 (Larson 2) M⊙ yr-1. When Mini = 5 × 10¹⁰ M⊙, ψ(t) = 20–400 M⊙ yr-1. After ~1 Gyr the difference between the SFRs obtained with a Larson 2 IMF and a Salpeter IMF is more than an order of magnitude.
In Fig. 9 (bottom row) it is seen that the metallicity Z(t) in the two lower mass galaxies rises quickly within the first 100–200 Myr up to values of more than 5 Z⊙ for either a top-heavy or a Larson 2 IMF. Thereafter it remains rather constant. For the system with Mini = 5 × 10¹¹ M⊙, the metallicity increases more slowly than in the lower mass galaxies. At an epoch of 400 Myr, a metallicity of 2–3 Z⊙ can be observed for the top-heavy and Larson 2 IMFs, while the Salpeter IMF achieves only a bit less than half solar. In the most massive galaxies, the metallicity exceeds Z⊙ only in case of the top-heavy IMFs before an age of 400–500 Myr, but remains below Z⊙ for the IMFs favouring lower mass stars.
4.3. Evolution of gas, metals and stellar masses
The evolution of quantities, such as the gas mass, mass of metals, and stellar masses is discussed based on EIT08M. Figure 10 illustrates the evolution of the H + He gas mass MG(t). As a consequence of the scaling of the SFR with the mass of the ISM, MISM(t) ≡ MG(t) + MZ(t), the progression of MG(t) is identical to the SFR described in Sect. 4.2.
The most massive galaxy with Mini = 1.3 × 10¹² M⊙ has a residual gas mass MG(t) of ~1012 M⊙ after 1 Gyr. This explains the very low dust-to-gas ratio for such a system even though very high dust masses can be reached. The galaxy with Mini = 5 × 10¹¹ M⊙ gets more exhausted, but also retains a gas mass MG(t) of 3–4 × 10¹¹ M⊙ after ~400–500 Myr.
In analogy with the curves of the SFR, the curves of the gas mass for the system with Mini = 1 × 10¹¹ M⊙ feature a pronounced separation between the IMFs. A Larson 2 IMF shows a flat evolution leading to a slower depletion of the gas than for the Salpeter IMF and after 400–500 Myr ~ 5 × 10¹⁰ M⊙ of gas is still present. The lowest mass system (Mini = 5 × 10¹⁰ M⊙) exhibits the strongest dependence on the IMF. After 400 Myr, MG(t) is ~2 × 10¹⁰ M⊙ for a Larson 2 IMF. The difference between a Salpeter IMF and a Larson 2 IMF after one Gyr is an order of magnitude. The residual gas mass with a Salpeter IMF is a few times 108 M⊙ at this time.
 |
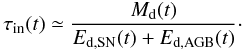
Fig. 9 Evolution of total dust injection rates for AGB stars and SNe, the AGB and SNe rates, the SFR, and the metallicity. Results are shown for Mini = 1.3 × 10¹² M⊙ (first column), 5 × 10¹¹ M⊙ (second column), 1 × 10¹¹ M⊙ (third column), and 5 × 10¹⁰ M⊙ (fourth column). The solid, dotted, dashed, dashed-dotted, and dashed-dot-dotted lines represent the Salpeter, mass-heavy, top-heavy, Larson 1, and Larson 2 IMF, respectively. First row: total SN dust injection rates Ed,SN(t) for a “low” (black lines), “high” (blue lines), and “maximum” (green lines) SN efficiency ϵi(m), and AGB dust injection rates Ed,AGB(t) (red lines). SN dust injection rates are only shown for a Salpeter (solid) and a Larson 2 (dashed-dot-dotted) IMF. Second row: SNe rates RSN(t) (black lines) and AGB rates RAGB(t) (red lines). SN rates are only shown for a Salpeter (solid), mass-heavy (dotted), and a Larson 2 (dashed-dot-dotted) IMF. Third row: evolution of the SFR. The blue area marks the region between a SFR of 100–1000 M⊙ yr-1. Fourth row: evolution of the metallicity Z(t). The green regions mark a metallicity between 1–2 Z⊙ (light green), 2–3 Z⊙ (dark green), 3–4 Z⊙ (grass green). The grey vertical dashed lines indicate epochs at 400 and 500 Myr after the onset of starburst. |
The steepness of the decline in the progression of MG(t) is influenced by the stellar feedback. For either a Larson 2 or a top-heavy IMF, more massive stars are formed. Such stars live short lives and release most of their mass back into the ISM, through either stellar winds or in explosive events. The IMFs favouring lower masses, however, lock most of the gas used for star formation into intermediate-to-low-mass stars. These stars are formed at higher rates than massive stars. The low-mass stars live a long time and also do not inject much material back into the ISM during our considered time span of 1 Gyr. As a consequence, the material available for star formation gets more rapidly depleted for the IMFs favouring low-mass stars than for the top-heavy IMFs. Hence, the evolution of the gas mass and the SFR results in a steeper decline.
This contrasts with the stellar masses M ∗ (t) (Fig. 11 top row) obtained from the relation M ∗ (t) = Mini − MISM(t). For the IMFs favouring lower mass stars, M ∗ (t) rises steeply and approaches the initial mass of this galaxy in the case of the lower massive galaxy systems. The slope of M ∗ (t) for the top-heavy IMFs is shallower, and lower stellar masses M ∗ (t) are achieved.
Figure 11 (bottom row) depicts the mass of the ejected heavy elements MZ(t). For systems with Mini > 1 × 10¹¹ M⊙, the metal enrichment in the ISM is considerable. The mass of the heavy elements increases up to a few times 1010 M⊙.
In the lower mass galaxies Mini ≤ 1 × 10¹¹ M⊙, the amount of metals MZ(t) attained reaches a maximum within the first 200 Myr whereafter MZ(t) declines. This is caused by astration. The maximum mass of metals obtained with a Salpeter IMF is only a few times 108 M⊙. For the lowest mass galaxy the amount of metals after ~600 Myr for a Salpeter IMF is less than 108 M⊙. This implies that dust masses Md(t) in excess of 108 M⊙ for this IMF are unfeasible, even if dust-grain growth in the ISM is invoked.
4.4. Comparison to other dust evolution models for high-z galaxies
The models with a “maximum” SN dust production efficiency for a system with Mini of 5 × 10¹⁰ M⊙ (Fig. 4 two left columns, first row) can be compared to models of Dwek et al. (2007). For this efficiency the AGB dust production is negligible and the SN dust yields are similar to the dust yields used by Dwek et al. (2007). Our results for a top-heavy IMF and Mcl = 0 at an epoch of 400 Myr agrees with their results, while they disagree for a Salpeter IMF and for cases with Mcl = 100 M⊙.
The origin of this disagreement can be traced to the neglect of the lifetime-dependent mass injection of stars and a different treatment of the mass recycled into the ISM in the models of Dwek et al. (2007). The latter is approximated as 0.5ψ(t) in their models, which leads to an IMF-independent evolution of the ISM mass. In the case of a Salpeter IMF, this simple approximation has consequences for the evolution of all physical properties. It implicitly presupposes that even stars, which are formed between the lower mass limit of the IMF and the lower SN mass limit, immediately return half of their stellar mass back into the ISM. However, stars between 3–8 M⊙ eject their elements up to a few 100 Myr delayed and stars ≲ 3 M⊙ do not eject a significant amount of elements within the first Gyr. For a Salpeter IMF, where more low-mass stars than high-mass stars are formed, we have shown that the mass of the ISM gets exhausted more rapidly than for the IMFs favouring higher masses (see Sect. 4.3). This results in a steeper decline in the SFR, the SN rates and the SN dust injection rates. Thus, our models lead to lower dust masses than the models by Dwek et al. (2007) for a Salpeter IMF.
The model for a system with Mini = 1.3 × 10¹² M⊙ and Mcl = 800 M⊙ (Fig. 8 top left), a Larson 1 IMF and the “high” SN efficiency is directly comparable to Valiante et al. (2009). Our results are in good agreement with their results, although our model does not quite reach 108 M⊙. This discrepancy may stem from differences in the SN dust yields used. Additionally, the treatment of stars between 40–100 M⊙ by Valiante et al. (2009) is not unambiguously traceable.
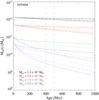 |
Fig. 10 Evolution of the gas mass MG(t) based on EIT08M. Results are shown for Mini = 1.3 × 10¹² M⊙ (black lines), 5 × 10¹¹ M⊙ (red lines), 1 × 10¹¹ M⊙ (green lines), and 5 × 10¹⁰ M⊙ (magenta lines). The grey vertical dashed lines indicate epochs at 400 and 500 Myr after the onset of starburst. The solid, dotted, dashed, dashed-dotted, and dashed-dot-dotted lines represent the Salpeter, mass-heavy, top-heavy, Larson 1, and Larson 2 IMF, respectively. |
4.5. Results for models including a SMBH
We have investigated whether including the formation of the SMBH leads to differences in the evolution of either the total amount of dust or the physical properties of a galaxy. Based on the observed SMBH masses ≥ 109 M⊙ for high-redshift QSOs (e.g., Willott et al. 2003; Vestergaard 2004; Jiang et al. 2006; Wang et al. 2010), we studied two cases for the SMBH mass, MSMBH = 3 × 10⁹ M⊙ and MSMBH = 5 × 10⁹ M⊙. According to Kawakatu & Wada (2009), the final SMBH mass takes up approximately 1–10% of the supply mass MSMBHsup. This implies that to grow a SMBH of 3(5) × 109 M⊙ the minimum required supply mass ranges between 3(5) × 1010 to 3(5) × 1011 M⊙. In view of our assumption that MSMBHsup ≡ Mini, we included the SMBH formation in galaxies with Mini = 5 × 10¹⁰ M⊙ and Mini = 1 × 10¹¹ M⊙.
In Fig. 12 we show the results of Md(t) for a Salpeter and Larson 1 IMF for an EIT08M and Mini = 5 × 10¹⁰ M⊙ where the SMBH formation has been included. These results are compared to those of a model with the same Mini, but without a SMBH.
Taking the SMBH into account leads to a steeper decline in Md(t) and therefore to a lower amount of dust than for the model without a SMBH after ~100 Myr. All models are similar within the first ~100 Myr. For MSMBH = 5 × 10⁹ M⊙ the difference is at most ~50% for a Salpeter IMF and ~30% for a Larson 1 IMF at an epoch of 400 Myr. At the same epoch but for MSMBH = 3 × 10⁹ M⊙, the dust mass for a Salpeter IMF is reduced by only about 30%, and 20% for the Larson 1 IMF. In cases of IMFs biased towards higher masses and in the more massive galaxy systems, the formation of the SMBH, as introduced here, does not noticeably effect the progression of Md(t) and the physical properties of a galaxy.
5. Discussion
We have shown that, depending on the assumptions for certain model parameters, dust masses in excess of 108 M⊙ can be obtained in our model. All models leading to dust masses ≥ 108 M⊙ within the first 400 Myr are listed in Table 4. In Fig. 13 we show the resulting relations between the dust mass and stellar mass, SFR, and metallicity at 400 Myr.
It is evident that the dust yields are related to the mass of the galaxy. For a given combination of IMF, SN dust production efficiency and Mcl higher dust yields are obtained with increasing Mini. In the discussion below we consider ϵhigh with Mcl = 100 M⊙ as the reference case.
The left panel in Fig. 13 depicts the dust mass versus the stellar mass. For a given IMF the stellar masses increase with Mini. However for a given Mini, a wide spread of the stellar mass is found with varying IMF. We find that for the reference case, galaxies with Mini ≳ 5 × 10¹¹ M⊙ and an IMF biased towards higher masses reproduce dust masses >108 M⊙, while this is only possible in the most massive system with a Salpeter IMF. The stellar masses for these galaxies and with the more top-heavy IMFs are in good agreement with observations of galaxies at high-z. Santini et al. (2010) and Michałowski et al. (2010a) shows that, out of a sample of high-z submillimetre galaxies and local ULIRGs, most of these are assembled at stellar masses around 1011 M⊙ and have dust masses of 108 − 10 M⊙.
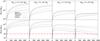 |
Fig. 11 Evolution of the stellar mass and mass of metals based on EIT08M. Results are shown for Mini = 1.3 × 10¹² M⊙ (first column), 5 × 10¹¹ M⊙ (second column), 1 × 10¹¹ M⊙ (third column), and 5 × 10¹⁰ M⊙ (fourth column). Top row: stellar mass M ∗ (t). Bottom row: mass of metals MZ(t). The red lines mark a metal mass of 108 M⊙. The solid, dotted, dashed, dashed-dotted, and dashed-dot-dotted lines represent the Salpeter, mass-heavy, top-heavy, Larson 1, and Larson 2 IMF, respectively. |
Alternatively, a “maximum” SN dust production efficiency can account for the required dust mass. For this SN efficiency, even a higher dust destruction in the ISM of Mcl = 800 M⊙ can be accomodated. However, assumptions of either ϵmax or Mcl = 800 M⊙ are both controversial. So far only in the SN remnants Cas A (Wilson & Batrla 2005; Dunne et al. 2009) and Kepler (Gomez et al. 2009) have dust masses been claimed that are consistent with “maximum” SN efficiency, ϵmax. Most SN dust observations reveal dust masses implying efficiencies in the range of ϵlow–ϵhigh (see GAH11). Additionally, theoretical models (Nozawa et al. 2010) predict that depending on the density and geometry of the CSM and shocks, only a part of the dust may survive the destructive reverse shock.
The uncertainty of dust destruction through SN shocks has been discussed in Sect. 3.5. The results obtained in this work strengthen the concerns of a high value for Mcl. Apart from the “maximum” SN efficiency, for a high value of Mcl = 800 M⊙, only the combination of a “high” SN efficiency ϵhigh with Mini = 1.3 × 10¹² M⊙ leads to dust masses close to 108 M⊙, regardless of the IMF. However the remaining gas mass MG(t) is > 1012 M⊙, implying dust-to-gas mass ratios ηd(t) < 10-4, is not supported by observations. The low dust-to-gass mass ratio is also, why dust destruction in the ISM is less efficient than in the lower mass galaxy systems.
In principle, the fairly sensitive interplay between dust-to-gas ratio ηd(t) and SN rates might be important when contemplating additional dust source in less massive galaxies. As long as SN rates are high, any increase in the dust mass, and hence in ηd(t), leads to higher destruction rates. This shows that for Mcl = 800 M⊙ it is difficult to reach high amounts of dust, unless a rapid enrichment with high dust masses from either stellar sources or grain growth in the ISM takes place. In the latter case, grain growth rates must be comparable to SN dust injection rates for ϵmax. Alternatively, a lowering of the dust-to-gas ratio ηd(t) due to, for example, infalling gas might be an option. However this alternative results in an increased total mass of the galaxy anyway.
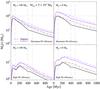 |
Fig. 12 Comparison of the evolution of the dust mass between EIT08M including and without the SMBH formation. The initial gas mass of the galaxy Mini = 5 × 10¹⁰ M⊙. Calculations are shown for a “maximum” (top row) and a “high” (bottom row) SN dust production efficiency ϵi(m). Dust destruction is taken into account for Mcl = 100 M⊙ (left column) and 0 M⊙ (right column). Calculations including the SMBH are performed for a SMBH mass MSMBH = 5 × 10⁹ M⊙ (solid curves) and for MSMBH = 3 × 10⁹ M⊙ (dotted curves). The calculations without the SMBH are illustrated as dot-dashed curves. The black lines represent the Salpeter IMF and the magenta lines the Larson 2 IMF. The grey horizontal dashed line marks the limit of 108 M⊙ of dust. The grey vertical dashed lines indicate epochs at 100, 400, and 500 Myr after the onset of starburst. |
EIT08M exceeding 108M⊙ of dust within ~400–500 Myr.
Given these uncertainties, we find that the reference case constitutes the most likely scenario. In Fig. 13 (middle panel) we have plotted the dust mass versus SFR. The highest SFRs can be sustained for the high-mass weighted IMFs in the more massive galaxies. For the less massive systems, also with top-heavy IMFs, the SFR declines rather fast. In comparison to observations of galaxies containing high dust masses at z > 6, we find that all systems more massive than 1 × 10¹¹ M⊙ can be brought into agreement with the SFRs derived from observations (e.g., Bertoldi et al. 2003a; Dwek et al. 2007; Wang et al. 2010). The SFRs inferred from the observed far-infrared luminosities are naturally uncertain and sensitively dependent on assumptions about the IMF, the duration of the starburst, and the contribution of the active galactic nucleus (AGN) (e.g., Omont et al. 2001). Commonly a Salpeter IMF is used, leading to high SFRs up to a few times 103 M⊙ yr-1 (e.g., Walter et al. 2004; Wang et al. 2010). As pointed out by Dwek et al. (2007), the inferred SFR however decreases to about 400 M⊙ yr-1 if a top-heavy IMF is assumed. In Fig. 13 (middle panel) it is evident that galaxies between 1–5 × 10¹¹ M⊙, and top-heavy IMFs result in SFRs between about 300–700 M⊙ yr-1.
The right panel of Fig. 13 shows that the metallicity decreases with increasing dust mass. IMFs favouring low masses lead to lower metallicities than the more top-heavy IMFs. The IMFs favouring low masses lock most material used for star formation in low-mass stars. These stars, however, do not recycle material back into the ISM, which therefore gets rapidly exhausted. In turn this leads to a high stellar mass M∗(t). The more top-heavy IMFs form more short lived massive stars at higher rates. These stars recycle a copious amount of their mass back into the ISM. Therefore these IMFs lead to lower stellar masses M∗(t), since the remnant mass of SNe is low. In addition, massive stars enrich the ISM with metals, while owing to their longer lifetimes, low-mass stars do not eject a significant amount, if any at all, of heavy elements back into the ISM within 1 Gyr. This leads to lower metallicity for the lower mass star weighted IMFs, and higher metallicity for the top-heavy IMFs.
Metallicities > Z⊙ have been found in strong star-forming galaxies, such as ULIRGs or submillimetre galaxies, as well as in high-z QSOs (e.g., Fan et al. 2003; Freudling et al. 2003; Kawara et al. 2010). In comparison to our calculated models, such metallicities can only be reached with the IMFs biased towards higher masses. In the lowest mass systems with these IMFs, the metallicity reaches values of ~5 × Z⊙.
5.1. Caveats in our approach
The presented models are based on rather simple assumptions, such as a closed box environment, a common constant initial SFR of the starburst, and a very simple treatment of the SMBH growth. With these assumptions the models are comparable to similar works (e.g., Dwek et al. 2007; Valiante et al. 2009), and diverse evolutionary trends could be investigated in more detail, as discussed in previous sections.
However, such models usually do not capture possible impacts on the evolution of the galaxy arising from galaxy mergers or gas flows powered by, for example, SNe or the SMBH. Different evolutionary paths likely caused by these effects and the mass of the galaxy possibly result in starburst intensities different from our assumption, in turn leading to a different temporal progression of various quantities. Furthermore, the growth of the SMBH is linked to several physical processes, e.g., the energy feedback of SNe, and realistically may not take place at a constant growth rate. Despite the neglect of these effects in our model, some general remarks about their influence can be made based on our results.
For example, infall rates that could affect the systems might have to be unrealistically high because of the very high SFRs. However, merging galaxies might have an effect. The same applies to outflows in the host galaxy or the feedback from the SMBH into the ISM. In our models the loss of material to fuel the SMBH can in principle be interpreted as some constant “outflow” of the host galaxy. Although we introduced a rough treatment for the SMBH growth, we could show that “outflow” rates of the host galaxy of about 7.5–12.5 M⊙ yr-1 on a timescale of 400 Myr only affect the amount of dust in the least massive systems (and IMFs biased towards low-mass stars), but are negligible in the larger galaxies. In this regard, it remains to be investigated whether the energy deposition by SNe/AGNs in the ISM could be high enough to initiate sufficiently higher outflow rates to impact the total amount of dust in a galaxy.
 |
Fig. 13 Relation between dust mass, stellar mass, SFR, and metallicity in correlation with the total mass of the galaxy and the IMF for an epoch at 400 Myr. Left panel: dust mass Md(t) versus stellar mass M∗(t). Middle panel: dust mass Md(t) versus SFR ψ(t). Right panel: dust mass Md(t) versus metallicity Z(t). The dark grey shaded area marks the dust masses Md(t) obtained with a “maximum” SN dust production efficiency ϵmax(m) and no dust destruction in the ISM (Mcl = 0 M⊙). The light grey shaded area marks dust masses Md(t) for the “low” SN dust production efficiency ϵlow(m) with dust destruction in the ISM (Mcl = 800 M⊙). Cross points of the thin white lines indicate the data points for each IMF and mass Mini of the galaxy. The coloured filled circles signify the dust masses obtained for a “high” SN efficiency ϵhigh(m) and a dust destruction in the ISM with Mcl = 100 M⊙. The size of the circles is scaled by the initial mass Mini of the galaxy. The black, green, cyan, magenta, and blue colors denote the Salpeter, mass-heavy, top-heavy, Larson 1, and Larson 2 IMF, respectively. |
A change in the evolution of the dust mass and other properties may also result from quasar winds, in which dust formation has also been suggested (Elvis et al. 2002). According to Elvis et al. (2002), the estimated mass-loss rates of about > 10 M⊙ yr-1 in the most luminous quasars with luminosities > 1047 erg s-1 (e.g., Omont et al. 2001, 2003; Carilli et al. 2001; Bertoldi & Cox 2002) imply an amount of ~107 M⊙ of dust produced over 108 yr. Comparing these rates to our model results, we find that neither the mass-loss rates nor the dust mass seem to be high enough to be relevant for the evolution of dust and other properties.
We find that a strong impact on the evolution of dust is caused by the dust sources. Despite the included detailed treatment of the dust contribution from stellar sources in the developed model, the poorly understood dust production by SNe, but also dust destruction by SN shock interactions, very likely constitute the largest uncertainties in the evolution of dust. Although not included in the model, alternative dust sources such as dust grain growth in the ISM might be relevant (e.g., Dwek et al. 2007; Draine 2009; Michałowski et al. 2010b).
6. Conclusions
In this work we have developed a chemical evolution model for starburst galaxies at high redshift. The main purpose is to investigate the evolution of the dust content arising from SNe and AGB stars on timescales less than 1 Gyr. In addition, we elaborated on the evolution of several physical properties of galaxies. The model allows the exploration of a wide range of parameters. The main parameters varied in this work are the mass of the galaxy, the IMF, SN dust production efficiencies, and dust destruction in the ISM through SN shocks and stellar yields. The main results can be summarized as follows.
-
1.
The total amount of dust and the physical properties of a galaxyare strongly dependent on the IMF and correlate with the mass ofthe galaxy. For many properties we find an increasing disparitybetween the IMFs with decreasing mass of the galaxy. Higherdust masses are obtained with increasing mass of the galaxy.
-
2.
The maximum dust masses can be obtained with IMFs biased towards higher mass stars and a “maximum” SN dust production efficiency in galaxies with masses between 5 × 10¹⁰ M⊙ and 1.3 × 10¹² M⊙. This is found independently of the strength of dust destruction in the ISM. The case of “maximum” SN efficiency and no destruction constitute the maximum possible dust masses attainable with SNe and AGB dust production. The case with “low” SN efficiency and a high dust destruction (Mcl = 800 M⊙) gives the lowest possible dust masses.
-
3.
The contribution by AGB stars is most visible in cases where a “low” SN dust formation efficiency is considered. In this case the mass-heavy IMF dominates in all considered initial masses Mini, and leads to the highest dust masses. However, dust production with this efficiency is found to be insufficient to fully account for dust masses in excess of 108 M⊙ within 400 Myr. In the galaxies with Mini ≳ 5 × 10¹¹ M⊙, this limit can be reached at epochs ≳ 400 Myr if there is no dust destruction in the ISM.
-
4.
The total dust mass is considerably reduced when destruction by SN shock waves is taken into account. The strength of destruction in the ISM is given in terms of the mass Mcl, which is the mass of the ISM that is swept up and cleared of the containing dust through one SN remnant. Top-heavy IMFs are sensitive to dust destruction, while IMFs favouring lower masses are more resistent to destruction due to lower SN rates. This leads to a significantly greater reduction and, in some cases, to a lower amount of dust with the top-heavy IMFs.
-
5.
At early epochs (<200 Myr) SNe are primarily responsible for a significant enrichment by dust. For a “high” SN dust production efficiency SNe can generate 108 M⊙ within the first 100 Myr. In comparison, for “low” SN dust production efficiency, SNe are only able to increase the dust mass up to a few times 106 M⊙ in the first 100–150 Myr.
-
6.
Taking the growth of the SMBH into account leads to a reduction of the amount of dust of at most ~50%. This is achieved for a SMBH mass MSMBH = 5 × 10⁹ M⊙ in a galaxy with Mini = 5 × 10¹⁰ M⊙ and only for IMFs favouring low-mass stars. In more massive systems and for top-heavy IMFs no variation in the dust mass and properties of the galaxy is encountered.
-
7.
To account for dust masses > 108 M⊙ we find that galaxies with an initial gas mass of Mini = 1–5 × 10¹¹ M⊙ in connection with top-heavy IMFs, “high” SN dust production efficiency ϵhigh, and dust destruction in the ISM of Mcl = 100 M⊙ are favoured. Models with the highest amount of Mini = 1.3 × 10¹² M⊙ and lowest of Mini = 5 × 10¹⁰ M⊙ are discouraged.
More refined models including diverse flow scenarios tracing self-consistent SF histories, detailed SMBH growth scenarios, and several plausible dust sources are major future developments.
Acknowledgments
We would like to thank John Eldridge for providing tabulated values of his stellar evolution models. We also thank Justyn R. Maund, Darach Watson, and Marianne Vestergaard for informative discussions. The Dark Cosmology Centre is funded by the DNRF.
References
- Barlow, M. J., Krause, O., Swinyard, B. M., et al. 2010, A&A, 518, L138 [NASA ADS] [CrossRef] [EDP Sciences] [Google Scholar]
- Beelen, A., Cox, P., Benford, D. J., et al. 2006, ApJ, 642, 694 [NASA ADS] [CrossRef] [Google Scholar]
- Bertoldi, F., & Cox, P. 2002, A&A, 384, L11 [NASA ADS] [CrossRef] [EDP Sciences] [Google Scholar]
- Bertoldi, F., Carilli, C. L., Cox, P., et al. 2003a, A&A, 406, L55 [NASA ADS] [CrossRef] [EDP Sciences] [Google Scholar]
- Bertoldi, F., Cox, P., Neri, R., et al. 2003b, A&A, 409, L47 [NASA ADS] [CrossRef] [EDP Sciences] [Google Scholar]
- Bianchi, S., & Schneider, R. 2007, MNRAS, 378, 973 [NASA ADS] [CrossRef] [Google Scholar]
- Bouchet, P., De Buizer, J. M., Suntzeff, N. B., et al. 2004, ApJ, 611, 394 [NASA ADS] [CrossRef] [Google Scholar]
- Bromm, V., & Loeb, A. 2003, Nature, 425, 812 [NASA ADS] [CrossRef] [EDP Sciences] [PubMed] [Google Scholar]
- Calura, F., Pipino, A., & Matteucci, F. 2008, A&A, 479, 669 [NASA ADS] [CrossRef] [EDP Sciences] [Google Scholar]
- Carilli, C. L., Bertoldi, F., Rupen, M. P., et al. 2001, ApJ, 555, 625 [NASA ADS] [CrossRef] [Google Scholar]
- Carilli, C. L., Kohno, K., Kawabe, R., et al. 2002, AJ, 123, 1838 [NASA ADS] [CrossRef] [Google Scholar]
- Charbonnel, C., Meynet, G., Maeder, A., Schaller, G., & Schaerer, D. 1993, A&AS, 101, 415 [NASA ADS] [Google Scholar]
- Cox, P., Omont, A., Djorgovski, S. G., et al. 2002, A&A, 387, 406 [NASA ADS] [CrossRef] [EDP Sciences] [Google Scholar]
- Dabringhausen, J., Kroupa, P., & Baumgardt, H. 2009, MNRAS, 394, 1529 [NASA ADS] [CrossRef] [Google Scholar]
- de Jager, C., Nieuwenhuijzen, H., & van der Hucht, K. A. 1988, A&AS, 72, 259 [NASA ADS] [Google Scholar]
- Doane, J. S., & Mathews, W. G. 1993, ApJ, 419, 573 [NASA ADS] [CrossRef] [Google Scholar]
- Douvion, T., Lagage, P. O., & Pantin, E. 2001, A&A, 369, 589 [Google Scholar]
- Draine, B. T. 2009, ed. T. Henning, E. Grün, & J. Steinacker, ASP Conf. Ser., 414, 453 [Google Scholar]
- Dunne, L., Maddox, S. J., Ivison, R. J., et al. 2009, MNRAS, 394, 1307 [NASA ADS] [CrossRef] [Google Scholar]
- Dwek, E. 1998, ApJ, 501, 643 [NASA ADS] [CrossRef] [Google Scholar]
- Dwek, E., Galliano, F., & Jones, A. P. 2007, ApJ, 662, 927 [NASA ADS] [CrossRef] [Google Scholar]
- Eldridge, J. J., & Tout, C. A. 2004, MNRAS, 353, 87 [NASA ADS] [CrossRef] [Google Scholar]
- Eldridge, J. J., & Tout, C. A. 2005, in 1604–2004: Supernovae as Cosmological Lighthouses, ed. M. Turatto, S. Benetti, L. Zampieri, & W. Shea, ASP Conf. Ser., 342, 126 [Google Scholar]
- Eldridge, J. J., Izzard, R. G., & Tout, C. A. 2008, MNRAS, 384, 1109 (EIT08) [NASA ADS] [CrossRef] [Google Scholar]
- Elmhamdi, A., Danziger, I. J., Chugai, N., et al. 2003, MNRAS, 338, 939 [NASA ADS] [CrossRef] [Google Scholar]
- Elvis, M., Marengo, M., & Karovska, M. 2002, ApJ, 567, L107 [NASA ADS] [CrossRef] [Google Scholar]
- Fan, X., Strauss, M. A., Schneider, D. P., et al. 2003, AJ, 125, 1649 [NASA ADS] [CrossRef] [Google Scholar]
- Ferrarotti, A. S., & Gail, H. 2006, A&A, 447, 553 [NASA ADS] [CrossRef] [EDP Sciences] [Google Scholar]
- Frayer, D. T., Ivison, R. J., Scoville, N. Z., et al. 1999, ApJ, 514, L13 [NASA ADS] [CrossRef] [Google Scholar]
- Freudling, W., Corbin, M. R., & Korista, K. T. 2003, ApJ, 587, L67 [NASA ADS] [CrossRef] [Google Scholar]
- Gall, C., Andersen, A. C., & Hjorth, J. 2011, A&A, 528, A14 [NASA ADS] [CrossRef] [EDP Sciences] [Google Scholar]
- Georgy, C., Meynet, G., Walder, R., Folini, D., & Maeder, A. 2009, A&A, 502, 611 [NASA ADS] [CrossRef] [EDP Sciences] [Google Scholar]
- Gomez, H. L., Dunne, L., Ivison, R. J., et al. 2009, MNRAS, 397, 1621 [NASA ADS] [CrossRef] [Google Scholar]
- Green, D. A., Tuffs, R. J., & Popescu, C. C. 2004, MNRAS, 355, 1315 [NASA ADS] [CrossRef] [Google Scholar]
- Groenewegen, M. A. T., Wood, P. R., Sloan, G. C., et al. 2007, MNRAS, 376, 313 [NASA ADS] [CrossRef] [Google Scholar]
- Habergham, S. M., Anderson, J. P., & James, P. A. 2010, ApJ, 717, 342 [NASA ADS] [CrossRef] [Google Scholar]
- Heger, A., Fryer, C. L., Woosley, S. E., Langer, N., & Hartmann, D. H. 2003, ApJ, 591, 288 [NASA ADS] [CrossRef] [Google Scholar]
- Hines, D. C., Krause, O., Rieke, G. H., et al. 2006, ApJ, 641, L85 [NASA ADS] [CrossRef] [Google Scholar]
- Jiang, L., Fan, X., Hines, D. C., et al. 2006, AJ, 132, 2127 [NASA ADS] [CrossRef] [Google Scholar]
- Jones, A. P. 2004, in Astrophysics of Dust, ed. A. N. Witt, G. C. Clayton, & B. T. Draine, ASP Conf. Ser., 309, 347 [Google Scholar]
- Jones, A. P., Tielens, A. G. G. M., & Hollenbach, D. J. 1996, ApJ, 469, 740 [NASA ADS] [CrossRef] [Google Scholar]
- Kawakatu, N., & Wada, K. 2008, ApJ, 681, 73 [NASA ADS] [CrossRef] [Google Scholar]
- Kawakatu, N., & Wada, K. 2009, ApJ, 706, 676 [NASA ADS] [CrossRef] [Google Scholar]
- Kawara, K., Oyabu, S., Matsuoka, Y., et al. 2010, MNRAS, 402, 335 [NASA ADS] [CrossRef] [Google Scholar]
- Kennicutt, Jr., R. C. 1998, ApJ, 498, 541 [NASA ADS] [CrossRef] [Google Scholar]
- Kotak, R., Meikle, W. P. S., Farrah, D., et al. 2009, ApJ, 704, 306 [NASA ADS] [CrossRef] [Google Scholar]
- Krause, O., Birkmann, S. M., Rieke, G. H., et al. 2004, Nature, 432, 596 [NASA ADS] [CrossRef] [PubMed] [Google Scholar]
- Lagadec, E., Zijlstra, A. A., Matsuura, M., Whitelock, P. A., & van Loon, J. T. 2007, in Why Galaxies Care About AGB Stars: Their Importance as Actors and Probes, ed. F. Kerschbaum, C. Charbonnel, & R. F. Wing, ASP Conf. Ser., 378, 268 [Google Scholar]
- Larson, R. B. 1998, MNRAS, 301, 569 [NASA ADS] [CrossRef] [Google Scholar]
- Marchenko, S. V. 2006, in Stellar Evolution at Low Metallicity: Mass Loss, Explosions, Cosmology, ed. H. J. G. L. M. Lamers, N. Langer, T. Nugis, & K. Annuk, ASP Conf. Ser., 353, 299 [Google Scholar]
- Matsuura, M., Zijlstra, A. A., Bernard-Salas, J., et al. 2007, MNRAS, 382, 1889 [Google Scholar]
- Mattsson, L., Wahlin, R., Höfner, S., & Eriksson, K. 2008, A&A, 484, L5 [NASA ADS] [CrossRef] [EDP Sciences] [Google Scholar]
- McKee, C. 1989, in Interstellar Dust, ed. L. J. Allamandola, & A. G. G. M. Tielens, IAU Symp., 135, 431 [Google Scholar]
- Meikle, W. P. S., Mattila, S., Pastorello, A., et al. 2007, ApJ, 665, 608 [NASA ADS] [CrossRef] [Google Scholar]
- Meynet, G., & Maeder, A. 2003, A&A, 404, 975 [NASA ADS] [CrossRef] [EDP Sciences] [Google Scholar]
- Meynet, G., & Maeder, A. 2005, A&A, 429, 581 [Google Scholar]
- Michałowski, M., Hjorth, J., & Watson, D. 2010a, A&A, 514, A67 [NASA ADS] [CrossRef] [EDP Sciences] [Google Scholar]
- Michałowski, M. J., Murphy, E. J., Hjorth, J., et al. 2010b, A&A, 522, A15 [NASA ADS] [CrossRef] [EDP Sciences] [Google Scholar]
- Morgan, H. L., & Edmunds, M. G. 2003, MNRAS, 343, 427 [NASA ADS] [CrossRef] [EDP Sciences] [Google Scholar]
- Nomoto, K., Tominaga, N., Umeda, H., Kobayashi, C., & Maeda, K. 2006, Nuclear Physics A, 777, 424 (N06) [Google Scholar]
- Nozawa, T., Kozasa, T., Umeda, H., Maeda, K., & Nomoto, K. 2003, ApJ, 598, 785 [NASA ADS] [CrossRef] [Google Scholar]
- Nozawa, T., Kozasa, T., Habe, A., et al. 2007, ApJ, 666, 955 [NASA ADS] [CrossRef] [Google Scholar]
- Nozawa, T., Kozasa, T., Tominaga, N., et al. 2010, ApJ, 713, 356 [NASA ADS] [CrossRef] [MathSciNet] [Google Scholar]
- Nugis, T., & Lamers, H. J. G. L. M. 2000, A&A, 360, 227 [NASA ADS] [Google Scholar]
- Omont, A., Cox, P., Bertoldi, F., et al. 2001, A&A, 374, 371 [NASA ADS] [CrossRef] [EDP Sciences] [Google Scholar]
- Omont, A., Beelen, A., Bertoldi, F., et al. 2003, A&A, 398, 857 [NASA ADS] [CrossRef] [EDP Sciences] [Google Scholar]
- Rho, J., Kozasa, T., Reach, W. T., et al. 2008, ApJ, 673, 271 [NASA ADS] [CrossRef] [Google Scholar]
- Riechers, D. A., Walter, F., Bertoldi, F., et al. 2009, ApJ, 703, 1338 [NASA ADS] [CrossRef] [Google Scholar]
- Riechers, D. A., Walter, F., Carilli, C. L., & Bertoldi, F. 2007, ApJ, 671, L13 [NASA ADS] [CrossRef] [Google Scholar]
- Robson, I., Priddey, R. S., Isaak, K. G., & McMahon, R. G. 2004, MNRAS, 351, L29 [Google Scholar]
- Salpeter, E. E. 1955, ApJ, 121, 161 [Google Scholar]
- Sandstrom, K., Bolatto, A., Leroy, A., et al. 2008, in Infrared Diagnostics of Galaxy Evolution, ed. R.-R. Chary, H. I. Teplitz, & K. Sheth, ASP Conf. Ser., 381, 268 [Google Scholar]
- Santini, P., Maiolino, R., Magnelli, B., et al. 2010, A&A, 518, L154 [NASA ADS] [CrossRef] [EDP Sciences] [Google Scholar]
- Schaerer, D., & de Barros, S. 2010, A&A, 515, A73 [NASA ADS] [CrossRef] [EDP Sciences] [Google Scholar]
- Schaerer, D., Meynet, G., Maeder, A., & Schaller, G. 1993, A&AS, 98, 523 [NASA ADS] [Google Scholar]
- Schaller, G., Schaerer, D., Meynet, G., & Maeder, A. 1992, A&AS, 96, 269 [Google Scholar]
- Schneider, R., Omukai, K., Inoue, A. K., & Ferrara, A. 2006, MNRAS, 369, 1437 [NASA ADS] [CrossRef] [Google Scholar]
- Seab, C. G. 1987, in Astrophysics and Space Science Library, Interstellar Processes, ed. D. J. Hollenbach, & H. A. Thronson Jr., 134, 491 [Google Scholar]
- Sibthorpe, B., Ade, P. A. R., Bock, J. J., et al. 2010, ApJ, 719, 1553 [NASA ADS] [CrossRef] [Google Scholar]
- Sloan, G. C., Matsuura, M., Zijlstra, A. A., et al. 2009, Science, 323, 353 [NASA ADS] [CrossRef] [PubMed] [Google Scholar]
- Spergel, D. N., Verde, L., Peiris, H. V., et al. 2003, ApJS, 148, 175 [NASA ADS] [CrossRef] [Google Scholar]
- Tecza, M., Baker, A. J., Davies, R. I., et al. 2004, ApJ, 605, L109 [NASA ADS] [CrossRef] [Google Scholar]
- Temim, T., Gehrz, R. D., Woodward, C. E., et al. 2006, AJ, 132, 1610 [NASA ADS] [CrossRef] [Google Scholar]
- Tinsley, B.-M. 1980, in Fundamentals of Cosmic Physics 5, ed. C. W. Gordon, & V. Canuto, 287 [Google Scholar]
- Todini, P., & Ferrara, A. 2001, MNRAS, 325, 726 [NASA ADS] [CrossRef] [Google Scholar]
- Tumlinson, J. 2006, ApJ, 641, 1 [NASA ADS] [CrossRef] [Google Scholar]
- Valiante, R., Schneider, R., Bianchi, S., & Andersen, A. C. 2009, MNRAS, 397, 1661 [NASA ADS] [CrossRef] [Google Scholar]
- van den Hoek, L. B., & Groenewegen, M. A. T. 1997, A&AS, 123, 305 [NASA ADS] [CrossRef] [EDP Sciences] [Google Scholar]
- Vestergaard, M. 2004, ApJ, 601, 676 [NASA ADS] [CrossRef] [Google Scholar]
- Vink, J. S., de Koter, A., & Lamers, H. J. G. L. M. 2001, A&A, 369, 574 [NASA ADS] [CrossRef] [EDP Sciences] [Google Scholar]
- Wachter, A., Winters, J. M., Schröder, K., & Sedlmayr, E. 2008, A&A, 486, 497 [NASA ADS] [CrossRef] [EDP Sciences] [Google Scholar]
- Walter, F., Bertoldi, F., Carilli, C., et al. 2003, Nature, 424, 406 [NASA ADS] [CrossRef] [PubMed] [Google Scholar]
- Walter, F., Carilli, C., Bertoldi, F., et al. 2004, ApJ, 615, L17 [CrossRef] [Google Scholar]
- Wang, R., Carilli, C. L., Neri, R., et al. 2010, ApJ, 714, 699 [NASA ADS] [CrossRef] [Google Scholar]
- Williams, B. J., Borkowski, K. J., Reynolds, S. P., et al. 2008, ApJ, 687, 1054 [NASA ADS] [CrossRef] [Google Scholar]
- Willott, C. J., McLure, R. J., & Jarvis, M. J. 2003, ApJ, 587, L15 [NASA ADS] [CrossRef] [Google Scholar]
- Wilson, T. L., & Batrla, W. 2005, A&A, 430, 561 [NASA ADS] [CrossRef] [EDP Sciences] [Google Scholar]
- Wooden, D. H., Rank, D. M., Bregman, J. D., et al. 1993, ApJS, 88, 477 [NASA ADS] [CrossRef] [Google Scholar]
- Woosley, S. E., & Weaver, T. A. 1995, ApJS, 101, 181 (WW95) [NASA ADS] [CrossRef] [Google Scholar]
- Zijlstra, A. A., Matsuura, M., Wood, P. R., et al. 2006, MNRAS, 370, 1961 [NASA ADS] [CrossRef] [Google Scholar]
All Tables
All Figures
|
Fig. 1 Dust-production efficiencies of massive stars. The dashed line represents the “maximum” SN efficiency ϵmax(m) and the dashed dotted line the “high” SN efficiency ϵhigh(m). The solid line is the “low” SN efficiency ϵlow(m). The left dotted line represents the metallicity-averaged AGB efficiency ϵAGB(m). The vertical line marks the least massive (3 M⊙) AGB star considered. |
| In the text | |
|
Fig. 2 Evolution of the total dust mass and dust destruction rates for EIT08M. The initial gas mass of the galaxy Mini = 5 × 10¹¹ M⊙. Calculations are performed for a “maximum” (top row), a “high” (middle row), and a “low” (bottom row) SN dust production efficiency ϵi(m). Dust destruction is taken into account for Mcl = 800 M⊙ (left column), 100 M⊙ (middle column), and 0 M⊙ (right column). The bottom group of curves in the light blue area represents the total dust destruction rate ED(t), which is based on Eq. (16). The upper group of curves in the green or yellow zones displays the evolution of the total amount of dust Md(t) in the galaxy. The yellow area marks dust masses exceeding 108 M⊙ of dust. The grey horizontal dashed line marks the limit of 108 M⊙ of dust. The grey vertical dashed lines indicate epochs at 100, 170, 400, and 500 Myr after the onset of starburst. The black solid, green dotted, cyan dashed, magenta dashed-dotted, and blue dashed-dot-dotted lines represent the Salpeter, mass-heavy, top-heavy, Larson 1 and Larson 2 IMF, respectively. |
| In the text | |
|
Fig. 3 Evolution of the dust-to-gas and dust-to-metal mass ratios for EIT08M. The initial gas mass of the galaxy Mini = 5 × 10¹¹ M⊙. Calculations are performed for a “maximum” (top row), a “high” (middle row), and a “low” (bottom row) SN dust production efficiency ϵi(m). Dust destruction is taken into account for Mcl = 800 M⊙ (left column), 100 M⊙ (middle column), and 0 M⊙ (right column). The upper group of curves signifies the dust-to-metal mass ratio ηZd(t). The lower group of curves represents the dust-to-gas mass ratio ηd(t). The gas-to-dust ratio displayed in the figures is calculated for a Larson 2 IMF at an epoch of 400 Myr. The grey vertical dashed lines indicate epochs at 100, 400, and 500 Myr after the onset of starburst. The black solid, green dotted, cyan dashed, magenta dashed-dotted, and blue dashed-dot-dotted lines represent the Salpeter, mass-heavy, top-heavy, Larson 1 and Larson 2 IMF, respectively. |
| In the text | |
|
Fig. 4 Evolution of the total dust mass for EIT08M. Calculations for galaxies with initial gas masses of Mini = 5 × 10¹⁰ M⊙ are presented in the first and second columns and for Mini = 1 × 10¹¹ M⊙ in the third and fourth columns. Total dust masses Md(t) are shown for a “maximum” (top row), a “high” (middle row), and a “low” (bottom row) SN dust production efficiency ϵI(m). Dust destruction is taken into account for Mcl = 100 M⊙ (first and third columns) and 0 M⊙ (second and fourth columns). Maximum dust masses exceeding 108 M⊙ are indicated as yellow shaded zones. The grey horizontal dashed line marks the limit of 108 M⊙ of dust. The grey vertical dashed lines indicate epochs at 400, and 500 Myr after the onset of starburst. The black solid, green dotted, and blue dashed-dot-dotted lines represent the Salpeter, mass-heavy and Larson 2 IMF, respectively. |
| In the text | |
|
Fig. 5 Evolution of the dust-to-gas and dust-to-metal mass ratios for EIT08M. Calculations for galaxies with initial gas masses of Mini = 5 × 10¹⁰ M⊙ are presented in the first and second columns and for Mini = 1 × 10¹¹ M⊙ in the third and fourth columns. Results are presented for a “maximum” (top row), a “high” (middle row), and a “low” (bottom row) SN dust production efficiency ϵi(m). Dust destruction is taken into account for Mcl = 100 M⊙ (first and third columns) and 0 M⊙ (second and fourth columns). The upper group of thick curves signifies the dust-to-metal mass ratio ηZd(t). The lower group of thin curves represents the dust-to-gas mass ratio ηd(t). The gas-to-dust ratio displayed in the figures is calculated for a Larson 2 IMF at an epoch of 400 Myr. The grey vertical dashed lines indicate epochs at 400, and 500 Myr after the onset of starburst. The black solid, green dotted, and blue dashed-dot-dotted lines represent the Salpeter, mass-heavy and Larson 2 IMF, respectively. |
| In the text | |
|
Fig. 6 Evolution of the total dust mass for G09M, presented for a galaxy with Mini = 5 × 10¹¹ M⊙. Total dust masses Md(t) are shown for a “high” (top row) and a “low” (bottom row) SN dust production efficiency ϵi(m). Dust destruction is taken into account for Mcl = 800 M⊙ (left column) and 0 M⊙ (right column). Maximum dust masses exceeding 108 M⊙ are indicated as yellow shaded zones. The grey horizontal dashed line marks the limit of 108 M⊙ of dust. The grey vertical dashed lines indicate epochs at 400 and 500 Myr after the onset of starburst. The black solid, green dotted, cyan dashed, magenta dashed-dotted, and blue dashed-dot-dotted lines represent the Salpeter, mass-heavy, top-heavy, Larson 1, and Larson 2 IMF, respectively. |
| In the text | |
|
Fig. 7 Evolution of the total dust mass for WW95M (top row) and N06M (bottom row). Both models are presented for a galaxy with Mini = 5 × 10¹¹ M⊙. Total dust masses Md(t) are shown for “high” SN dust production efficiency ϵhigh(m). Dust destruction is taken into account for Mcl = 100 M⊙ (left column) and 0 M⊙ (right column). Maximum dust masses exceeding 108 M⊙ are indicated as yellow shaded zones. The grey horizontal dashed line marks the limit of 108 M⊙ of dust. The grey vertical dashed lines indicate epochs at 400 and 500 Myr after the onset of starburst. The black solid, green dotted, cyan dashed, magenta dashed-dotted, and blue dashed-dot-dotted lines represent the Salpeter, mass-heavy, top-heavy, Larson 1, and Larson 2 IMF, respectively. |
| In the text | |
|
Fig. 8 Evolution of the total dust mass for WW95M with constant SFR. WW95M is presented for a galaxy with Mini = 1.3 × 10¹² M⊙. Total dust masses Md(t) are shown for “high” (top row) and a “low” (bottom row) SN dust production efficiency ϵi(m). Dust destruction is taken into account for Mcl = 800 M⊙ (left column) and 0 M⊙ (right column). Maximum dust masses exceeding 108 M⊙ are indicated as yellow shaded zones. The grey horizontal dashed line marks the limit of 108 M⊙ of dust. The grey vertical dashed lines indicate epochs at 400 and 500 Myr after the onset of starburst. The black solid, green dotted, cyan dashed, magenta dashed-dotted, and blue dashed-dot-dotted lines represent the Salpeter, mass-heavy, top-heavy, Larson 1, and Larson 2 IMF, respectively. |
| In the text | |
|
Fig. 9 Evolution of total dust injection rates for AGB stars and SNe, the AGB and SNe rates, the SFR, and the metallicity. Results are shown for Mini = 1.3 × 10¹² M⊙ (first column), 5 × 10¹¹ M⊙ (second column), 1 × 10¹¹ M⊙ (third column), and 5 × 10¹⁰ M⊙ (fourth column). The solid, dotted, dashed, dashed-dotted, and dashed-dot-dotted lines represent the Salpeter, mass-heavy, top-heavy, Larson 1, and Larson 2 IMF, respectively. First row: total SN dust injection rates Ed,SN(t) for a “low” (black lines), “high” (blue lines), and “maximum” (green lines) SN efficiency ϵi(m), and AGB dust injection rates Ed,AGB(t) (red lines). SN dust injection rates are only shown for a Salpeter (solid) and a Larson 2 (dashed-dot-dotted) IMF. Second row: SNe rates RSN(t) (black lines) and AGB rates RAGB(t) (red lines). SN rates are only shown for a Salpeter (solid), mass-heavy (dotted), and a Larson 2 (dashed-dot-dotted) IMF. Third row: evolution of the SFR. The blue area marks the region between a SFR of 100–1000 M⊙ yr-1. Fourth row: evolution of the metallicity Z(t). The green regions mark a metallicity between 1–2 Z⊙ (light green), 2–3 Z⊙ (dark green), 3–4 Z⊙ (grass green). The grey vertical dashed lines indicate epochs at 400 and 500 Myr after the onset of starburst. |
| In the text | |
|
Fig. 10 Evolution of the gas mass MG(t) based on EIT08M. Results are shown for Mini = 1.3 × 10¹² M⊙ (black lines), 5 × 10¹¹ M⊙ (red lines), 1 × 10¹¹ M⊙ (green lines), and 5 × 10¹⁰ M⊙ (magenta lines). The grey vertical dashed lines indicate epochs at 400 and 500 Myr after the onset of starburst. The solid, dotted, dashed, dashed-dotted, and dashed-dot-dotted lines represent the Salpeter, mass-heavy, top-heavy, Larson 1, and Larson 2 IMF, respectively. |
| In the text | |
|
Fig. 11 Evolution of the stellar mass and mass of metals based on EIT08M. Results are shown for Mini = 1.3 × 10¹² M⊙ (first column), 5 × 10¹¹ M⊙ (second column), 1 × 10¹¹ M⊙ (third column), and 5 × 10¹⁰ M⊙ (fourth column). Top row: stellar mass M ∗ (t). Bottom row: mass of metals MZ(t). The red lines mark a metal mass of 108 M⊙. The solid, dotted, dashed, dashed-dotted, and dashed-dot-dotted lines represent the Salpeter, mass-heavy, top-heavy, Larson 1, and Larson 2 IMF, respectively. |
| In the text | |
|
Fig. 12 Comparison of the evolution of the dust mass between EIT08M including and without the SMBH formation. The initial gas mass of the galaxy Mini = 5 × 10¹⁰ M⊙. Calculations are shown for a “maximum” (top row) and a “high” (bottom row) SN dust production efficiency ϵi(m). Dust destruction is taken into account for Mcl = 100 M⊙ (left column) and 0 M⊙ (right column). Calculations including the SMBH are performed for a SMBH mass MSMBH = 5 × 10⁹ M⊙ (solid curves) and for MSMBH = 3 × 10⁹ M⊙ (dotted curves). The calculations without the SMBH are illustrated as dot-dashed curves. The black lines represent the Salpeter IMF and the magenta lines the Larson 2 IMF. The grey horizontal dashed line marks the limit of 108 M⊙ of dust. The grey vertical dashed lines indicate epochs at 100, 400, and 500 Myr after the onset of starburst. |
| In the text | |
|
Fig. 13 Relation between dust mass, stellar mass, SFR, and metallicity in correlation with the total mass of the galaxy and the IMF for an epoch at 400 Myr. Left panel: dust mass Md(t) versus stellar mass M∗(t). Middle panel: dust mass Md(t) versus SFR ψ(t). Right panel: dust mass Md(t) versus metallicity Z(t). The dark grey shaded area marks the dust masses Md(t) obtained with a “maximum” SN dust production efficiency ϵmax(m) and no dust destruction in the ISM (Mcl = 0 M⊙). The light grey shaded area marks dust masses Md(t) for the “low” SN dust production efficiency ϵlow(m) with dust destruction in the ISM (Mcl = 800 M⊙). Cross points of the thin white lines indicate the data points for each IMF and mass Mini of the galaxy. The coloured filled circles signify the dust masses obtained for a “high” SN efficiency ϵhigh(m) and a dust destruction in the ISM with Mcl = 100 M⊙. The size of the circles is scaled by the initial mass Mini of the galaxy. The black, green, cyan, magenta, and blue colors denote the Salpeter, mass-heavy, top-heavy, Larson 1, and Larson 2 IMF, respectively. |
| In the text | |
Current usage metrics show cumulative count of Article Views (full-text article views including HTML views, PDF and ePub downloads, according to the available data) and Abstracts Views on Vision4Press platform.
Data correspond to usage on the plateform after 2015. The current usage metrics is available 48-96 hours after online publication and is updated daily on week days.
Initial download of the metrics may take a while.