Fig. 4
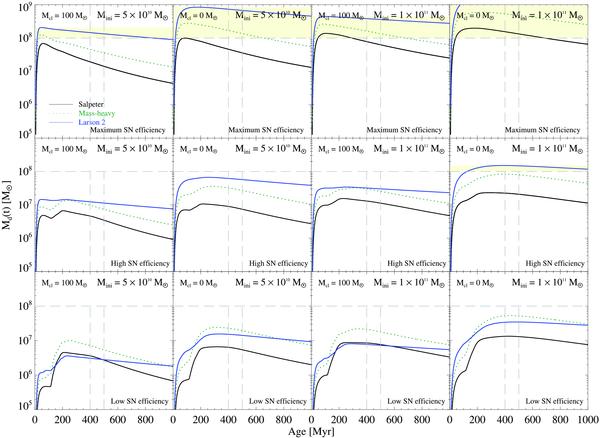
Evolution of the total dust mass for EIT08M. Calculations for galaxies with initial gas masses of Mini = 5 × 10¹⁰ M⊙ are presented in the first and second columns and for Mini = 1 × 10¹¹ M⊙ in the third and fourth columns. Total dust masses Md(t) are shown for a “maximum” (top row), a “high” (middle row), and a “low” (bottom row) SN dust production efficiency ϵI(m). Dust destruction is taken into account for Mcl = 100 M⊙ (first and third columns) and 0 M⊙ (second and fourth columns). Maximum dust masses exceeding 108 M⊙ are indicated as yellow shaded zones. The grey horizontal dashed line marks the limit of 108 M⊙ of dust. The grey vertical dashed lines indicate epochs at 400, and 500 Myr after the onset of starburst. The black solid, green dotted, and blue dashed-dot-dotted lines represent the Salpeter, mass-heavy and Larson 2 IMF, respectively.
Current usage metrics show cumulative count of Article Views (full-text article views including HTML views, PDF and ePub downloads, according to the available data) and Abstracts Views on Vision4Press platform.
Data correspond to usage on the plateform after 2015. The current usage metrics is available 48-96 hours after online publication and is updated daily on week days.
Initial download of the metrics may take a while.