Fig. 3
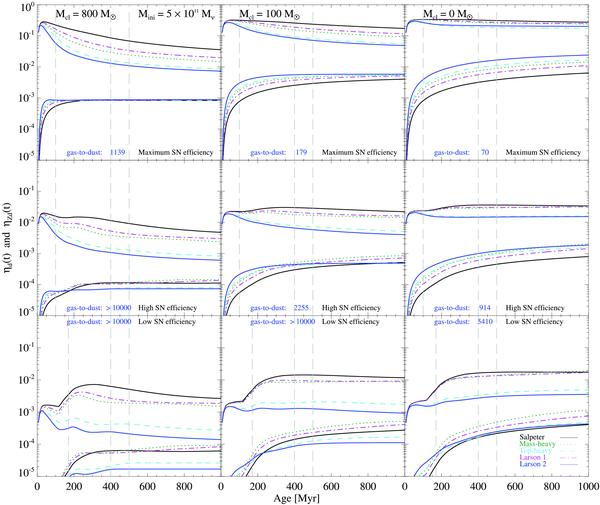
Evolution of the dust-to-gas and dust-to-metal mass ratios for EIT08M. The initial gas mass of the galaxy Mini = 5 × 10¹¹ M⊙. Calculations are performed for a “maximum” (top row), a “high” (middle row), and a “low” (bottom row) SN dust production efficiency ϵi(m). Dust destruction is taken into account for Mcl = 800 M⊙ (left column), 100 M⊙ (middle column), and 0 M⊙ (right column). The upper group of curves signifies the dust-to-metal mass ratio ηZd(t). The lower group of curves represents the dust-to-gas mass ratio ηd(t). The gas-to-dust ratio displayed in the figures is calculated for a Larson 2 IMF at an epoch of 400 Myr. The grey vertical dashed lines indicate epochs at 100, 400, and 500 Myr after the onset of starburst. The black solid, green dotted, cyan dashed, magenta dashed-dotted, and blue dashed-dot-dotted lines represent the Salpeter, mass-heavy, top-heavy, Larson 1 and Larson 2 IMF, respectively.
Current usage metrics show cumulative count of Article Views (full-text article views including HTML views, PDF and ePub downloads, according to the available data) and Abstracts Views on Vision4Press platform.
Data correspond to usage on the plateform after 2015. The current usage metrics is available 48-96 hours after online publication and is updated daily on week days.
Initial download of the metrics may take a while.