Fig. 9
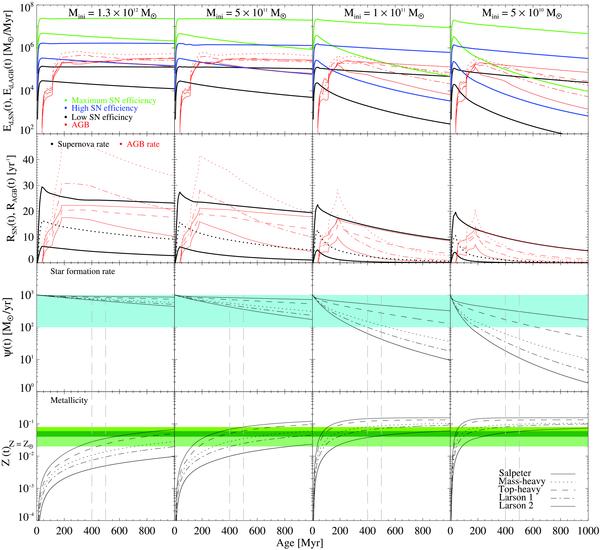
Evolution of total dust injection rates for AGB stars and SNe, the AGB and SNe rates, the SFR, and the metallicity. Results are shown for Mini = 1.3 × 10¹² M⊙ (first column), 5 × 10¹¹ M⊙ (second column), 1 × 10¹¹ M⊙ (third column), and 5 × 10¹⁰ M⊙ (fourth column). The solid, dotted, dashed, dashed-dotted, and dashed-dot-dotted lines represent the Salpeter, mass-heavy, top-heavy, Larson 1, and Larson 2 IMF, respectively. First row: total SN dust injection rates Ed,SN(t) for a “low” (black lines), “high” (blue lines), and “maximum” (green lines) SN efficiency ϵi(m), and AGB dust injection rates Ed,AGB(t) (red lines). SN dust injection rates are only shown for a Salpeter (solid) and a Larson 2 (dashed-dot-dotted) IMF. Second row: SNe rates RSN(t) (black lines) and AGB rates RAGB(t) (red lines). SN rates are only shown for a Salpeter (solid), mass-heavy (dotted), and a Larson 2 (dashed-dot-dotted) IMF. Third row: evolution of the SFR. The blue area marks the region between a SFR of 100–1000 M⊙ yr-1. Fourth row: evolution of the metallicity Z(t). The green regions mark a metallicity between 1–2 Z⊙ (light green), 2–3 Z⊙ (dark green), 3–4 Z⊙ (grass green). The grey vertical dashed lines indicate epochs at 400 and 500 Myr after the onset of starburst.
Current usage metrics show cumulative count of Article Views (full-text article views including HTML views, PDF and ePub downloads, according to the available data) and Abstracts Views on Vision4Press platform.
Data correspond to usage on the plateform after 2015. The current usage metrics is available 48-96 hours after online publication and is updated daily on week days.
Initial download of the metrics may take a while.