Fig. 13
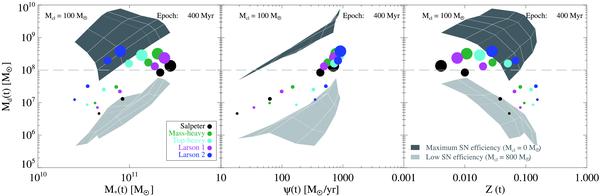
Relation between dust mass, stellar mass, SFR, and metallicity in correlation with the total mass of the galaxy and the IMF for an epoch at 400 Myr. Left panel: dust mass Md(t) versus stellar mass M∗(t). Middle panel: dust mass Md(t) versus SFR ψ(t). Right panel: dust mass Md(t) versus metallicity Z(t). The dark grey shaded area marks the dust masses Md(t) obtained with a “maximum” SN dust production efficiency ϵmax(m) and no dust destruction in the ISM (Mcl = 0 M⊙). The light grey shaded area marks dust masses Md(t) for the “low” SN dust production efficiency ϵlow(m) with dust destruction in the ISM (Mcl = 800 M⊙). Cross points of the thin white lines indicate the data points for each IMF and mass Mini of the galaxy. The coloured filled circles signify the dust masses obtained for a “high” SN efficiency ϵhigh(m) and a dust destruction in the ISM with Mcl = 100 M⊙. The size of the circles is scaled by the initial mass Mini of the galaxy. The black, green, cyan, magenta, and blue colors denote the Salpeter, mass-heavy, top-heavy, Larson 1, and Larson 2 IMF, respectively.
Current usage metrics show cumulative count of Article Views (full-text article views including HTML views, PDF and ePub downloads, according to the available data) and Abstracts Views on Vision4Press platform.
Data correspond to usage on the plateform after 2015. The current usage metrics is available 48-96 hours after online publication and is updated daily on week days.
Initial download of the metrics may take a while.