| Issue |
A&A
Volume 525, January 2011
|
|
|---|---|---|
| Article Number | A148 | |
| Number of page(s) | 10 | |
| Section | Astrophysical processes | |
| DOI | https://doi.org/10.1051/0004-6361/201014462 | |
| Published online | 09 December 2010 | |
Testing Newtonian gravity with distant globular clusters: NGC 1851 and NGC 1904 ⋆,⋆⋆
1
Instituto de Astrofísica de Canarias,
Spain
e-mail: riccardo.scarpa@gtc.iac.es
2
European Southern Observatory,
Chile
3
Osservatorio Astonomico di Padova,
Italy
4
Universidad de Concepcion, Departamento de
Astronomia, Concepcion, Chile
Received: 18 March 2010
Accepted: 19 August 2010
Context. Globular clusters are useful for testing the validity of Newtonian dynamics in the low acceleration regime typical of galaxies, without the complications of non-baryonic dark matter. In the absence of disturbing effects, such as tidal heating, the velocity dispersion of globular clusters is expected to vanish at large radii. If this is not observed, and in particular if, as observed in elliptical galaxies, the dispersion is found to be constant at large radii below a certain threshold acceleration, this might indicate a breakdown of Newtonian dynamics.
Aims. To minimize the effects of tidal heating that can increase the velocity dispersion at large radii, we study the velocity dispersion profile of two distant globular clusters, NGC 1851 and NGC 1904.
Methods. The velocity dispersion profile is derived from accurate radial velocity measurements, obtained at the ESO 8m VLT telescope with the FLAMES multi-object spectrograph. Reliable data for 184 and 146 bona fide cluster star members were obtained for NGC 1851 and NGC 1904, respectively.
Results. These data allow us to trace the velocity dispersion profile to ~2r0, where r0 is the radius at which the cluster internal acceleration of gravity is a0 ~ 10-8 cm s-2. It is found that in both clusters the velocity dispersion is maximal at the center, decreases moving outward, and then becomes constant beyond ~r0. Since the distance of these clusters from the Milky Way is large, the observed flattening of the velocity dispersion profile cannot be ascribed to tidal heating effects, as proposed in the case of nearer globular clusters.
Conclusions. These results are in full agreement with those found for another five globular clusters previously investigated as part of this project. Taken together, our results for these 7 clusters support the claim that the velocity dispersion is constant beyond r0, irrespectively of the specific physical properties of the clusters: mass, size, dynamical history, and distance from the Milky Way. The strong similarity to the constant velocity dispersion observed in elliptical galaxies beyond r0 is indicative of a common origin for this phenomenon in the two class of objects, and possibly a breakdown of Newtonian dynamics below a0.
Key words: gravitation / globular clusters: general
Tables 2 and 3 are only available in electronic form at http://www.aanda.org
© ESO, 2010
1. Introduction
Stars within galaxies, and galaxies within clusters of galaxies are very far apart from each other. As a consequence, the typical gravitational accelerations governing their dynamics are orders of magnitude smaller than those probed in our laboratories or in the solar system. Thus, any time Newton’s law of gravity is applied to galaxies (e.g., to infer the existence of dark matter), its validity is severely extrapolated.
Although there are plenty of reasons to trust Newton’s law in this very weak acceleration regime, it is well known that spiral galaxy rotation curves (see review by Sofue et al. 2001, and reference therein) systematically deviate from prediction of Newtonian dynamics. In a similar way elliptical galaxy (e.g., Carollo et al. 1995; Mehlert et al. 2000; Pu et al. 2010) and cluster of galaxy velocity dispersion profiles (e.g., Lokas et al. 2006), exibits a remarkable flattenings at large radii where a Keplerian falloff would be expected. These deviations, ascribed to the existence of large amounts of non-baryonic dark matter (DM), appears to exhibit systematic (but not yet understood) behaviors (cf., findings of Gentile et al. 2010; Donato et al. 2009). The most remarkable (e.g., Binney 2004) is that DM is needed to reconcile predictions with observations when and only when the acceleration of gravity goes below the critical value a0 ~ 10-8 cm s-2 (Begeman et al. 1991).
These results imply that we are witnessing a breakdown of Newton’s law rather than the effects of DM. If this were the case, one should observe the same phenomenology in all systems where the acceleration decreases below a0. In particular, the detection of a systematic flattening of the velocity dispersion profile in the external region of globular clusters, which are known to contain negligible quantities of DM, would represent a strong indication of a failure of the adopted law rather than the effects of unseen matter.
Scarpa et al. (2003) presented the results of a pilot study of the dynamics of the external region of the globular cluster ω Cen. The velocity dispersion was traced out to 45 pc from the center, probing acceleration as small as ~7 × 10⁻⁹ cm s-2. Clear evidence was found that as soon as the internal acceleration of gravity approaches a0, the velocity dispersion does not vanish, converging toward a constant value. This claim was disputed by Sollima et al. (2009), but reconfirmed by Scarpa & Falomo (2010) by reanalyzing all available data.
This property of ω Cen is not unique and appears to occur in all globular clusters for which an adequate analysis of the velocity dispersion profile has been performed: NGC 6171 and NGC 7078 (Scarpa et al. 2004a,b), and NGC 7099 and NGC 6341 (Scarpa et al. 2007a,b).
The low concentration cluster NGC288 appears to be even more interesting. This cluster has internal accelerations of gravity every where below a0 and thus is a tiny version of a low surface brightness spheroidal galaxy. As for galaxies (Mateo 1997; Wilkinson et al. 2006; Koch et al. 2007), NGC 288 has within its measurements errors the same velocity dispersion at all radii (Scarpa et al. 2007b). Another low-density cluster for which deviations from Newtonian dynamics are possible found is Palomar 14 (Gentile et al. 2010).
These results highlight an interesting correspondence between elliptical galaxies and globular clusters. Dense globular clusters have the same accelerations as and behave like high surface brightness elliptical galaxies, while loose clusters have the same accelerations as and behave like low surface brightness elliptical galaxies. What is different is the interpretation of the data. It is commonly accepted that in galaxies dark matter alters the dynamics, while in globular clusters something else does.
NGC 1851 and NGC 1904 basic properties from Harris 1996.
The most viable explanation for globular clusters appears to be tidal heating, the increase in the stellar velocity dispersion caused by the differential acceleration produced by the Milky Way in different position of the globular cluster. It would be, however, more logic to invoke a common origin of the phenomenon, that is a failure of Newtonian dynamics below a0 as claimed within the framework of MOND (Milgrom 1983).
To generalize our investigation, we present new accurate radial velocity measurements for NGC 1851 and NGC 1904 (Table 1). These clusters were selected for being located at r = 16.7 and 18.8 kpc from the Galactic center, respectively, which is approximately twice as distant from the Milky Way center as the other globular clusters studied so far. Thus these clusters are experiencing a tidal heating, proportional to r-3, about one order of magnitude smaller, making its effects negligible.
2. Observation and data analysis
The initial selection of targets was based on their color, as derived from the analysis of ESO Imaging Survey frames and ESO 2.2 m Wide Field Imager data. Targets were selected if their color difference from the cluster main sequence was V − I < 0.05 and V − I < 0.1, and apparent magnitude 19 > m > 18 and 19 > m > 17, for NGC 1851 and 1904, respectively. The cut in luminosity was made close to the base of the giant branch to probe the cluster stellar population in a well populated region to ensure a high probability of finding cluster members at large distances from the cluster. According to Milky Way stellar population models (Vanhollebeke et al. 2009) we expect a contamination of only 0.029 and 0.118 stars per arcmin squared in the selected color-luminosity range, corresponding to about 1.8% and 7.5% of our initial target list, for NGC 1851 and 1904, respectively.
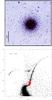 |
Fig. 1 The distribution of the selected stars in the cluster NGC1851 (north on the top, east on the left), and the color–magnitude diagram with the selected targets highlighted in red. For reference, the radius where the acceleration of gravity is a0 is 2.9 arcmin. |
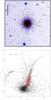 |
Fig. 2 The distribution of the selected stars in the cluster NGC 1904 (north on the top, east on the left), and the color-magnitude diagram with the selected targets highlighted in red. For reference, the radius where the internal acceleration of gravity is a0 is 2.1 arcmin. |
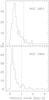 |
Fig. 3 Distribution of velocity uncertainties derived from the comparison of repeated velocities measurements of the same target. The peak of the distribution is at ~0.4 and ~0.2 km s-1 in NGC 1841 and 1904, respectively. This difference is due to targets in NGC 1904 being on average 0.4 mag brighter than those in NGC 1851. The dashed vertical line is the adopted threshold for rejecting objects. |
In Figs. 1 and 2, we show the color-magnitude diagram (CMD) of the clusters highlighting the positions of the 199 and 173 stars that were actually observed in NGC 1851 and 1904, respectively. The final distribution of the targets around the cluster center is also shown.
Because of the moderately high Galactic latitude and the high quality photometric data, we did expect little contamination and a very high success rate in identifying cluster members.
Spectroscopic observations were obtained with FLAMES+GIRAFFE (Pasquini et al. 2002) at the ESO 8 meter VLT telescope. FLAMES is a fiber multi-object spectrograph, allowing the simultaneous observation of up to 130 objects. We selected the HR9B setup that includes the magnesium triplet covering the wavelength range 5143 Å < λ < 5346 Å at resolution R = 25 900. Stellar astrometry was derived using data from the US Naval Observatory (USNO) catalog, which proved to have the required accuracy (0.3 arcsec) for FLAMES observations. Two different fiber configurations were necessary to allocate all the selected stars. For each configuration five separate 3200 s exposures were obtained on different night from November 2007 to March 2008, under good atmospheric conditions (clear sky, airmass < 1.5, and seeing ~1 arcsec).
Data were automatically pre-reduced using the GIRAFFE pipeline GIRBLDRS1, in which the spectra have been debiased, flat-field corrected, extracted, and wavelength-calibrated, using both prior and simultaneous calibration-lamp spectra. A sky correction was applied to each stellar spectrum by subtracting the average sky spectra obtained through dedicated fibers. The resulting spectra have a dispersion of 0.05 Å/pixel.
Radial velocities were obtained from the IRAF fxcor cross-correlation task. Stellar spectra were cross-correlated with a synthetic template calculated by SPECTRUM, the LTE spectral synthesis program freely distributed by Richard O. Gray2, for the mean temperature, gravity log g, and metallicity of our stars. We verified on the Kurucz solar flux atlas and UVES solar spectra that the template was accurate at the level of 50 m/s or less. The accuracy of the data reduction procedure and the radial velocity measurement was extensively tested in previous works (e.g. Milone et al. 2006; Sommariva et al. 2009).
Each spectrum was treated independently from the others, so that we ended up with 5 independent measurements of the radial velocity for each star. For a limited number of stars, we have fewer than 5 spectra because some were rejected for being affected by strong cosmic rays and other defects. The exact number of spectra available for each star is given in Tables 2 and 3. These radial velocities were then used to determine the effects of any intrinsic variation in the radial velocity (e.g., due to binary stars, stellar photospheric winds, measurement errors, etc.) finding for the vast majority of the targets a dispersion of less than 2.0 and 1.5 km s-1 in the case of NGC 1851 and NGC 1904, respectively (Fig. 3). This corresponds to a statistical uncertainty of less than 1 km s-1 in the average radial velocity of each target, small enough to not affect the measurement of the velocity dispersion of the cluster even in the most external regions. In the following, we define our most reliable estimate of the true radial velocity to be the weighted average of the 5 independent measurements.
A number of stars (5 in NGC 1851 and 8 in NGC 1904) were included in both FLAMES fiber setup to double check whether a velocity shift could exists between the two data sets. No statistically significant shift was detected down to 100 m/s. All velocities presented here are heliocentric.
3. Results
To derive the velocity dispersion profile (VDP), we first separated members from non-members in the velocity space. There was little ambiguity because the distribution of radial velocities was found to be bimodal, with separation of ~100 km s-1. In total, 4 non-members (2% of the sample) were found in NGC 1851 and 14 (8% of the sample) in NGC 1904, confirming a posteriori the high efficiency of our color selection criteria and in agreement with the expectations of galaxy stellar population models (see Sect. 2).
The median of the radial velocity error distribution for all members is 0.43 and 0.29 km s-1 (Fig. 3), significantly smaller than the expected velocity dispersion we are trying to measure (see next section). The radial velocity errors for a small fraction of the targets deviate significantly from those of the rest of the distribution. Thus we decided to retain only measurements with errors smaller than four times the semi-interquartile range of the error distribution (i.e., 1.2 and 1.0 km s-1 for NGC 1851 and 1904).
3.1. NGC 1851
From the initial sample of 199 stars, after eliminating 4 non-members cutting on radial velocity, and retaining only stars with a velocity accuracy higher than 1.2 km s-1 , we are left with 184 reliable radial velocities that represent the final sample used to constrain the cluster dynamics. The cluster average radial velocity is 320.0 ± 0.4 km s-1, with rms of 4.9 km s-1, in good agreement with the value 320.5 ± 0.6 km s-1 (Harris 1996). The average radial velocity within each bin shows no systematic trends as a function of distance from the cluster center (Fig. 4).
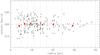 |
Fig. 4 The distribution of the 184 targets with radial-velocity uncertainty < 1.2 km s-1 as a function of distance from the center of NGC 1851 (Points with error bar). The large squares with error bar represent the average velocity in the bins indicated by vertical lines. The horizontal dashed line represents the cluster mean radial velocity. |
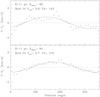 |
Fig. 5 Rotation in the inner and outer regions of NGC 1851. The plotted value is the average radial velocity of stars in a 180 degree sector, minus the average velocity of the whole cluster. The half cluster sector has been moved by 10 degrees from one point to the next. The maximum rotational velocity in km s-1 is derived from the best sinusoidal fit of the data. The position angle (in degrees from North toward East) of the rotation axis is also shown. |
The cluster is slowly rotating, with a maximum ordered rotation velocity of less than 0.8 km s-1, in both the inner and external regions (Fig. 5). Such a small rotational velocity cannot contribute significantly to support the structure of the cluster and is therefore neglected in the following discussion.
The velocity dispersion was computed in a number of selected bins following the procedure described in (Scarpa & Falomo 2010). Since the shape of the VDP might depend on the choice of the binning, we investigated the effects of different binning on the VDP. Two representative cases are shown. The first (Fig. 6) was obtained grouping the data using integer numbers in radial distance. The binning limits, the number of objects in each bin, and the corresponding velocity dispersion are given in Table 4. In the second case (Fig. 7), data were grouped by assigning a fixed number of objects to each bin, 20 in this case, and moving by 5 objects from one bin to the next. This ensures a much higher sampling of the profile, because data are partially reused moving from one bin to the other, at the expenses of having statistically correlated values. While it is clear that because of the limited amount of data the velocity dispersion fluctuates quite significantly, the general trend is well defined. Toward the center, the velocity dispersion naturally extrapolates to the central velocity dispersion available in the literature (10.4 km s-1, Harris 1996). In the external regions, the dispersions flattens out converging toward a constant value of ~4.0 ± 0.5 km s-1. Moving from the center outward, the VDP exhibits fluctuations of up to ~2 km s-1, making it difficult to identify the radius at which the flattening first occurs. This can be as close as 10 arcmin from the center, or as far as 15 arcmin. Assuming M/L = 1 in solar units, a total V-band absolute magnitude for the cluster of M = − 8.33, and distance from the Sun 12.1 kpc (Harris 1996), the internal acceleration of gravity is a0 at r = 14.5 pc from the center. Thus, data are consistent with a flattening of the dispersion profile where a < a0.
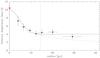 |
Fig. 6 NGC 1851 velocity dispersion computed binning the data as in Fig. 4. Error bars along the X axis represent the dispersion of the data within the bin; along the Y axis they give the 1-σ uncertainty in the dispersion. The central velocity dispersion as given in Harris (1996) is also shown (diamond). The vertical line marks the radius where the acceleration is a0. Overplotted on the data is a Gaussian plus a constant, which is not a fit to the data, but is meant to highlight the flattening of the velocity dispersion that occurs well within the cluster tidal radius of 41 pc (Harris 1996). The dotted line falls as r − 1/2. |
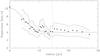 |
Fig. 7 The velocity dispersion profile of NGC 1851, derived considering the 184 members with radial velocity accuracy better than 1.2 km s-1. Data have been binned in groups of 20 each, moving by 5 from one group to the next. The dotted and solid lines give the 66 and 90 percent confidence regions for the dispersion. The central velocity dispersion as reported in Harris (1996) is also shown (diamond). The vertical line marks the radius where the internal acceleration of gravity is a0 (assuming M/L = 1). Overplotted on the data is a Gaussian plus a constant (not a fit to the data) to highlight the flattening of the VDP that occurs well within the cluster tidal radius of 41 pc (Harris 1996). |
Radial velocity dispersion for NGC 1851.
3.2. NGC 1904
From the initial sample of 173 stars, the cut on radial velocity and a velocity accuracy higher than 1.0 km s-1 left us with 146 targets used to study the cluster dynamics. The average radial velocity of NGC 1904 is 206.1 ± 0.3 km, with an rms of 3.1 km s-1, in good agreement with the value available in the literature (206 ± 0.4, Harris 1996). No systematic trend is seen in the average radial-velocity distribution as a function of distance from the cluster center (Fig. 8).
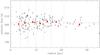 |
Fig. 8 The radial velocity distribution of the 146 targets with radial-velocity accuracy higher than 1.0 km s-1 (dots) as a function of distance in parsecs from the center of NGC 1904. The squares with error bars represent the average velocity in each bin indicated by the vertical lines. The horizontal dashed line indicates the cluster mean radial velocity. |
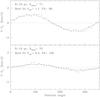 |
Fig. 9 Rotation in the inner and outer regions of NGC 1904. The plotted values represent the difference between the average radial velocity of stars in a 180 degree sector and the systemic velocity of the whole cluster. The maximum rotational velocity in km s-1 is derived from the best sinusoidal fit of the data. The position angle (in degrees from North toward East) of the rotation axis is also shown. |
The cluster is slowly rotating (Fig. 9). Within 3 arcmin from the center, we measured a rotation velocity of 1.1 km s-1, at a position angle 85 degrees (from North toward East). At larger radii, the best sinusoidal fit is consistent with no rotation at all. We can therefore neglect rotation in the outer part of the cluster, the most relevant to this study.
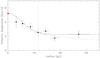 |
Fig. 10 The velocity dispersion of NGC 1904 computed with the same binning used in Fig. 8. Error bars along the x axis represent the dispersion of the data within each bin, along the y axis they give the 1-sigma uncertainty in the dispersion. The central velocity dispersion as given in Harris (1996) is also shown (diamond). The vertical dotted line marks the radius where the acceleration is a0. Overplotted on the data is a Gaussian plus a constant, not a fit to the data, meant to highlight the flattening of the velocity dispersion that occurs well within the cluster tidal radius of 31 pc (Harris 1996). The dotted line falls as r−1/2. |
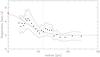 |
Fig. 11 Velocity dispersion profile of NGC 1904 as derived binning data in groups of 20 each, moving by 5 from one group to the next. The dotted and solid lines give the 66 and 90 percent confidence regions for the dispersion. The central velocity dispersion as reported in Harris (1996) is also shown (diamond). The vertical line indicates the radius where the internal acceleration of gravity is a0 (assuming M/L = 1). Overplotted on the data is a Gaussian plus a constant, not a fit to the data, used to highlight the flattening of the VDP that occurs well within the cluster tidal radius of 31 pc (Harris 1996). |
As for NGC 1851, we present the VDP derived with two different binning approaches (See Table 5, Figs. 10 and 11). Because of the low mass of NGC 1904 cluster, the dispersion is quite small and it is difficult with the present data set to derive a compelling result. All binning approaches used, however, appear to show that toward the center the profile might be consistent with a central velocity dispersion of 5.2 km s-1 reported in the literature (Harris 1996), Moving outward, the dispersion both increases and decreases a couple of times before converging toward a constant value of 2.25 ± 0.3 km s-1. Starting from 10 pc away from the center, the dispersion varies within the range 1.8 < σ < 2.6 km s-1.
Assuming M/L = 1 in solar units, a total V-band absolute magnitude for the cluster of M = −7.86, and distance from the Sun 12.9 kpc (Harris 1996), the internal acceleration of gravity is a0 at r = 11.6 pc from the center. Thus, also in this cluster data suggest a flattening of the VDP might occur at this particular value of the acceleration.
Radial velocity dispersion for NGC 1904.
4. Discussion
We have reported radial velocity measurements for two moderately distant globular clusters, NGC 1851 and 1904, located at 16.7 and 18.8 kpc from the Galactic center, respectively. The analysis of these data indicates that in these clusters the velocity dispersion remains constant beyond r = 12.5 ± 2.5 and r = 12 ± 2 pc from the center, respectively. These values are very similar to and statistically fully consistent with the radius r0 where the acceleration is a0.
Moreover, the two clusters are moving in a rapidly receding orbit. Assuming a logarithmic gravitational potential for the Milky Way, Dinescu et al. (1999) computed the most probable orbits of both NGC 1851 and NGC 1904. Integration of these orbits shows that they passed perigalacticon about 51 and 86 Myr ago, respectively. According to our velocity dispersion measurements, even in the outermost regions of the clusters the stellar velocity dispersion is 3.4 and 2.3 km s-1. With this velocity dispersion, stars in NGC 1851 and NGC 1904 cover a distance of twice the tidal radius in ~24 and ~32 Myr, respectively, less than the time since last perigalacticon. Hence these clusters had enough time to revirialise. Moreover, these two clusters experience a tidal action due to the Milky Way about one order of magnitude smaller than that acting on the clusters previously studied as part of this project, making it unlikely that the flattening of the VDP is the result of tidal heating.
Thus, these new observations bring to 7 out of 7 the number of high concentration globular clusters showing constant velocity dispersion at large radii (Table 6).
Clusters with velocity dispersion data probing accelerations below a0.
While differing in many respects (mass, dynamical history, concentration, position in the Milky Way halo, etc.), these clusters do share the property of being sufficiently concentrated to have internal accelerations of gravity above a0 at their centers, and thus behave in a asimilar way to high surface brightness elliptical galaxies (e.g., Carollo et al. 1995; Mehlert et al. 2000).
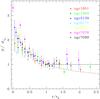 |
Fig. 12 Normalized velocity dispersion profile for all high density clusters studied so far as part of this program. Radii are in units of r0, the radius where the acceleration is a0, computed assuming M/L = 1 for all clusters. The dispersion is normalized to the value at r0 to ensure in the region r > r0 profiles from different clusters are comparable. The solid line at d = 1 represent a constant velocity dispersion, while the dashed line gives the Keplerian falloff. Data for NGC 1851 and NGC 1904 are from this work, for NGC 5139 from Scarpa & Falomo (2010), for NGC 6171 from Scarpa et al. (2004a,b), and for NGC 7099 and NGC 6343 from Scarpa et al. (2007a). |
The available velocity dispersion data, however, in no case probe radii larger than 2.5r0. At this radius the hypothesis that the velocity dispersion is constant, predicts a dispersion 60% higher than what Newtonian dynamics predicts, assuming the two coincide at r0. This difference is small enough that taken singularly none of these clusters represents a compelling case in favor (or against) a Keplerian falloff of the velocity dispersion. Therefore Newtonian dynamics remains a viable explanation to describe the data of individual objects (e.g., Moffat & Toth 2008). To increase the strength of the signal, we then combine the VDP of all the clusters. Data are normalized by plotting distance in units of r0, and dispersions in units of σ0, the dispersion at r0. We note that compared to the full cluster size, r0 corresponds to a very large radius, within which virtually all the cluster mass is contained. Thus, regardless of the exact mass distribution within the clusters, for r > r0 the dispersion should follow closely a Keplerian decline (unless external effects alters it).
The systematic deviation of the VDP from the Newtonian prediction is now more evident, for all the points but one are above the Keplerian falloff (Fig. 12). To quantify the difference between the two models, we first notice that they must coincide for r = r0. Therefore we limit the comparison to the 16 points at r > 1.2r0. The hypothesis σ/σ0 = 1 is statistically acceptable (χ2 = 12.0 for 15 degrees of freedom, probability 67%), while a curve falling as x − 1/2 has χ2 = 26.9 and can be rejected at the 97% confidence level.
The comparison of a K-S test between the observed data and the theoretical models show the constant dispersion hypothesis is about 15 times more probable then the Keplerian falloff.
The main conclusion of our work is that all globular clusters exhibit a flattening of the VDP at large radii. The explanation for this phenomenon cannot be the tidal action of the Milky Way,
but has to be something else that applies to all clusters, independently of their location in the Milky Way halo.
This picture would be in good agreement with the prediction of the MOND hypothesis, in the case of no strong gravitational external field (Milgrom 1983). However, according to the MOND original formulation in none of these clusters we should observe deviations from Newtonian dynamics, because the external field of the Milky Way is close to or above a0. Therefore, our results appear formally in disagreement with MOND predictions.
Online material
Radial velocities of stars NGC 1851.
Radial velocities of stars in NGC 1904.
Blecha et al. (2000); see http://girbldrs.sourceforge.net for the GIRAFFE pipeline software and documentation
Program and documentation available at www.phys.appstate.edu/spectrum/spectrum.html.
Acknowledgments
We thank Y. Momany for providing the photometry of NGC 1851, D. Bettoni for useful comments, and the Italian Space Agency for economical support by ASI-COFIC contract n. I/016/07/0 “Studi di Cosmologia e Fisica Fondamentale”.
References
- Begeman, K. G., Broeils, A. H., & Sanders, R. H. 1991, MNRAS, 249, 523 [NASA ADS] [CrossRef] [Google Scholar]
- Binney, J. 2004, in Dark Matter in Galaxies, ed. S. D. Ryder, D. J. Pisano, M. A. Walker, & K. C. Freeman, IAUS, 220, 3 [Google Scholar]
- Carollo, C. M., de Zeeuw, P. T., van der Marel, R. P., Danziger, I. J., & Qian, E. E. 1995, ApJ, 441, L25 [NASA ADS] [CrossRef] [Google Scholar]
- Donato, F., Gentile, G., Salucci, P., et al. 2009, MNRAS, 397, 1169 [NASA ADS] [CrossRef] [Google Scholar]
- Gentile, G., Famaey, B., Angus, G., & Kroupa, P. 2010, A&A, 509, A97 [NASA ADS] [CrossRef] [EDP Sciences] [Google Scholar]
- Harris, W. E. 1996, AJ, 112, 1487 [NASA ADS] [CrossRef] [Google Scholar]
- Koch, A., Kleyna, J. T., Wilkinson, M. I., et al. 2007, ApJ, 134, 566 [Google Scholar]
- Lokas, E. L., Wojtak, R., Gottlöber, S., Mamon, G. A., & Prada, F. 2006, MNRAS, 367, 1463 [NASA ADS] [CrossRef] [Google Scholar]
- Mateo M. 1997, on The nature of Elliptical Galaxies, ed. M. Arnaboldi, ASPC, 116, 259 [Google Scholar]
- Mehlert, D., Saglia, R. P., Bender, R., & Wegner, G. 2000, A&AS, 141, 449 [NASA ADS] [CrossRef] [EDP Sciences] [Google Scholar]
- Milgrom, M. 1983, ApJ, 270, 365 [NASA ADS] [CrossRef] [Google Scholar]
- Milone, A. P., Villanova, S., Bedin, L. R., et al. 2006, A&A, 456, 517 [NASA ADS] [CrossRef] [EDP Sciences] [Google Scholar]
- Moffat, J. W., & Toth, V. T. 2008, ApJ, 680, 1158 [Google Scholar]
- Pasquini, L., Avila, G., Blecha, A., et al. 2002, The Messenger, 110, 1 [NASA ADS] [Google Scholar]
- Pu, S. B., Saglia, R. P., Fabricius, M. H., et al. 2010, A&A, 516, A4 [NASA ADS] [CrossRef] [EDP Sciences] [Google Scholar]
- Sollima, A., Bellazini, M., Smart, R. L., et al. 2009, MNRAS, 396, 2183 [NASA ADS] [CrossRef] [Google Scholar]
- Scarpa, R., & Falomo, R. 2010, MNRAS, in press [Google Scholar]
- Scarpa, R., Marconi, G., & Gilmozzi, R. 2003, A&A, 405, L15 [Google Scholar]
- Scarpa, R., Marconi, G., & Gilmozzi, R. 2004a, IAUS, 220, 215 [NASA ADS] [Google Scholar]
- Scarpa, R., Marconi, G., & Gilmozzi, R. 2004b, in Baryons in Dark Matter Halos, ed. R. Dettmar, P. Klein, & P. Salucci, SISSA, Proceedings of Science, 55 [Google Scholar]
- Scarpa, R., Marconi, G., Gilmozzi, R., & Carraro, G. 2007a, A&A, 462, L9 [NASA ADS] [CrossRef] [EDP Sciences] [Google Scholar]
- Scarpa, R., Marconi, G., Gilmozzi, R., & Carraro, G. 2007b, the Messenger, 128, 41 [Google Scholar]
- Sofue, Y., & Rubin, V. 2001, ARA&A, 39, 137 [NASA ADS] [CrossRef] [Google Scholar]
- Sollima, A., Bellazzini, M., Smart, R. L., et al. 2009, MNRAS, 396, 2183 [NASA ADS] [CrossRef] [Google Scholar]
- Sommariva, V., Piotto, G., Rejkuba, M., et al. 2009, A&A, 493, 947 [NASA ADS] [CrossRef] [EDP Sciences] [Google Scholar]
- Vanhollebeke, E., Groenewegen, M. A. T., & Girardi, L. 2009, A&A, 498, 95 [NASA ADS] [CrossRef] [EDP Sciences] [Google Scholar]
- Wilkinson, M. I., Kleyna, J. T., Gilmore, G. F., et al. 2006, the Messenger, 124, 25 [Google Scholar]
All Tables
All Figures
|
Fig. 1 The distribution of the selected stars in the cluster NGC1851 (north on the top, east on the left), and the color–magnitude diagram with the selected targets highlighted in red. For reference, the radius where the acceleration of gravity is a0 is 2.9 arcmin. |
| In the text | |
|
Fig. 2 The distribution of the selected stars in the cluster NGC 1904 (north on the top, east on the left), and the color-magnitude diagram with the selected targets highlighted in red. For reference, the radius where the internal acceleration of gravity is a0 is 2.1 arcmin. |
| In the text | |
|
Fig. 3 Distribution of velocity uncertainties derived from the comparison of repeated velocities measurements of the same target. The peak of the distribution is at ~0.4 and ~0.2 km s-1 in NGC 1841 and 1904, respectively. This difference is due to targets in NGC 1904 being on average 0.4 mag brighter than those in NGC 1851. The dashed vertical line is the adopted threshold for rejecting objects. |
| In the text | |
|
Fig. 4 The distribution of the 184 targets with radial-velocity uncertainty < 1.2 km s-1 as a function of distance from the center of NGC 1851 (Points with error bar). The large squares with error bar represent the average velocity in the bins indicated by vertical lines. The horizontal dashed line represents the cluster mean radial velocity. |
| In the text | |
|
Fig. 5 Rotation in the inner and outer regions of NGC 1851. The plotted value is the average radial velocity of stars in a 180 degree sector, minus the average velocity of the whole cluster. The half cluster sector has been moved by 10 degrees from one point to the next. The maximum rotational velocity in km s-1 is derived from the best sinusoidal fit of the data. The position angle (in degrees from North toward East) of the rotation axis is also shown. |
| In the text | |
|
Fig. 6 NGC 1851 velocity dispersion computed binning the data as in Fig. 4. Error bars along the X axis represent the dispersion of the data within the bin; along the Y axis they give the 1-σ uncertainty in the dispersion. The central velocity dispersion as given in Harris (1996) is also shown (diamond). The vertical line marks the radius where the acceleration is a0. Overplotted on the data is a Gaussian plus a constant, which is not a fit to the data, but is meant to highlight the flattening of the velocity dispersion that occurs well within the cluster tidal radius of 41 pc (Harris 1996). The dotted line falls as r − 1/2. |
| In the text | |
|
Fig. 7 The velocity dispersion profile of NGC 1851, derived considering the 184 members with radial velocity accuracy better than 1.2 km s-1. Data have been binned in groups of 20 each, moving by 5 from one group to the next. The dotted and solid lines give the 66 and 90 percent confidence regions for the dispersion. The central velocity dispersion as reported in Harris (1996) is also shown (diamond). The vertical line marks the radius where the internal acceleration of gravity is a0 (assuming M/L = 1). Overplotted on the data is a Gaussian plus a constant (not a fit to the data) to highlight the flattening of the VDP that occurs well within the cluster tidal radius of 41 pc (Harris 1996). |
| In the text | |
|
Fig. 8 The radial velocity distribution of the 146 targets with radial-velocity accuracy higher than 1.0 km s-1 (dots) as a function of distance in parsecs from the center of NGC 1904. The squares with error bars represent the average velocity in each bin indicated by the vertical lines. The horizontal dashed line indicates the cluster mean radial velocity. |
| In the text | |
|
Fig. 9 Rotation in the inner and outer regions of NGC 1904. The plotted values represent the difference between the average radial velocity of stars in a 180 degree sector and the systemic velocity of the whole cluster. The maximum rotational velocity in km s-1 is derived from the best sinusoidal fit of the data. The position angle (in degrees from North toward East) of the rotation axis is also shown. |
| In the text | |
|
Fig. 10 The velocity dispersion of NGC 1904 computed with the same binning used in Fig. 8. Error bars along the x axis represent the dispersion of the data within each bin, along the y axis they give the 1-sigma uncertainty in the dispersion. The central velocity dispersion as given in Harris (1996) is also shown (diamond). The vertical dotted line marks the radius where the acceleration is a0. Overplotted on the data is a Gaussian plus a constant, not a fit to the data, meant to highlight the flattening of the velocity dispersion that occurs well within the cluster tidal radius of 31 pc (Harris 1996). The dotted line falls as r−1/2. |
| In the text | |
|
Fig. 11 Velocity dispersion profile of NGC 1904 as derived binning data in groups of 20 each, moving by 5 from one group to the next. The dotted and solid lines give the 66 and 90 percent confidence regions for the dispersion. The central velocity dispersion as reported in Harris (1996) is also shown (diamond). The vertical line indicates the radius where the internal acceleration of gravity is a0 (assuming M/L = 1). Overplotted on the data is a Gaussian plus a constant, not a fit to the data, used to highlight the flattening of the VDP that occurs well within the cluster tidal radius of 31 pc (Harris 1996). |
| In the text | |
|
Fig. 12 Normalized velocity dispersion profile for all high density clusters studied so far as part of this program. Radii are in units of r0, the radius where the acceleration is a0, computed assuming M/L = 1 for all clusters. The dispersion is normalized to the value at r0 to ensure in the region r > r0 profiles from different clusters are comparable. The solid line at d = 1 represent a constant velocity dispersion, while the dashed line gives the Keplerian falloff. Data for NGC 1851 and NGC 1904 are from this work, for NGC 5139 from Scarpa & Falomo (2010), for NGC 6171 from Scarpa et al. (2004a,b), and for NGC 7099 and NGC 6343 from Scarpa et al. (2007a). |
| In the text | |
Current usage metrics show cumulative count of Article Views (full-text article views including HTML views, PDF and ePub downloads, according to the available data) and Abstracts Views on Vision4Press platform.
Data correspond to usage on the plateform after 2015. The current usage metrics is available 48-96 hours after online publication and is updated daily on week days.
Initial download of the metrics may take a while.