Fig. 9
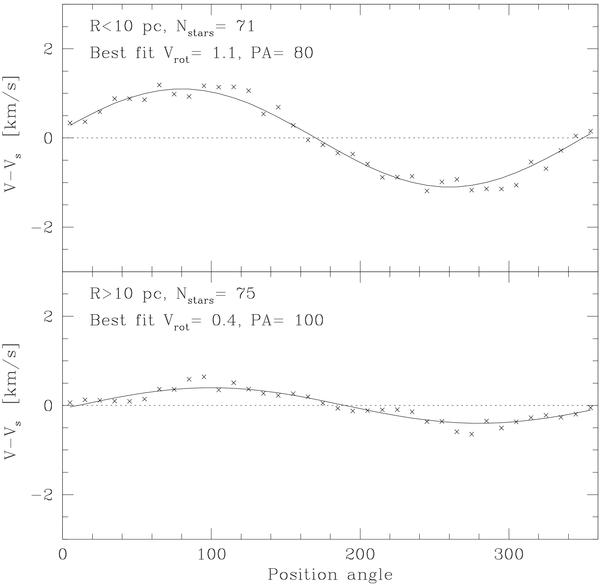
Rotation in the inner and outer regions of NGC 1904. The plotted values represent the difference between the average radial velocity of stars in a 180 degree sector and the systemic velocity of the whole cluster. The maximum rotational velocity in km s-1 is derived from the best sinusoidal fit of the data. The position angle (in degrees from North toward East) of the rotation axis is also shown.
Current usage metrics show cumulative count of Article Views (full-text article views including HTML views, PDF and ePub downloads, according to the available data) and Abstracts Views on Vision4Press platform.
Data correspond to usage on the plateform after 2015. The current usage metrics is available 48-96 hours after online publication and is updated daily on week days.
Initial download of the metrics may take a while.