Fig. 10
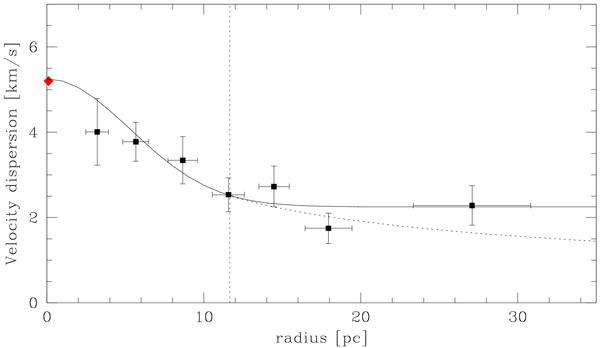
The velocity dispersion of NGC 1904 computed with the same binning used in Fig. 8. Error bars along the x axis represent the dispersion of the data within each bin, along the y axis they give the 1-sigma uncertainty in the dispersion. The central velocity dispersion as given in Harris (1996) is also shown (diamond). The vertical dotted line marks the radius where the acceleration is a0. Overplotted on the data is a Gaussian plus a constant, not a fit to the data, meant to highlight the flattening of the velocity dispersion that occurs well within the cluster tidal radius of 31 pc (Harris 1996). The dotted line falls as r−1/2.
Current usage metrics show cumulative count of Article Views (full-text article views including HTML views, PDF and ePub downloads, according to the available data) and Abstracts Views on Vision4Press platform.
Data correspond to usage on the plateform after 2015. The current usage metrics is available 48-96 hours after online publication and is updated daily on week days.
Initial download of the metrics may take a while.