Fig. 8
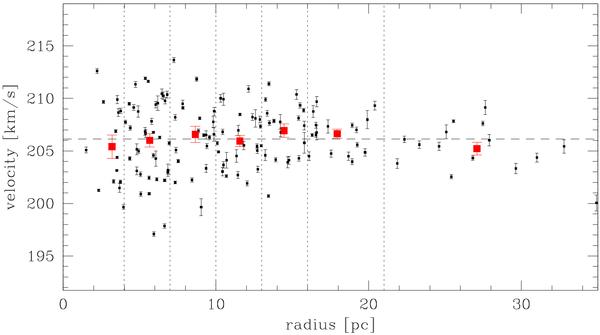
The radial velocity distribution of the 146 targets with radial-velocity accuracy higher than 1.0 km s-1 (dots) as a function of distance in parsecs from the center of NGC 1904. The squares with error bars represent the average velocity in each bin indicated by the vertical lines. The horizontal dashed line indicates the cluster mean radial velocity.
Current usage metrics show cumulative count of Article Views (full-text article views including HTML views, PDF and ePub downloads, according to the available data) and Abstracts Views on Vision4Press platform.
Data correspond to usage on the plateform after 2015. The current usage metrics is available 48-96 hours after online publication and is updated daily on week days.
Initial download of the metrics may take a while.