Fig. 3
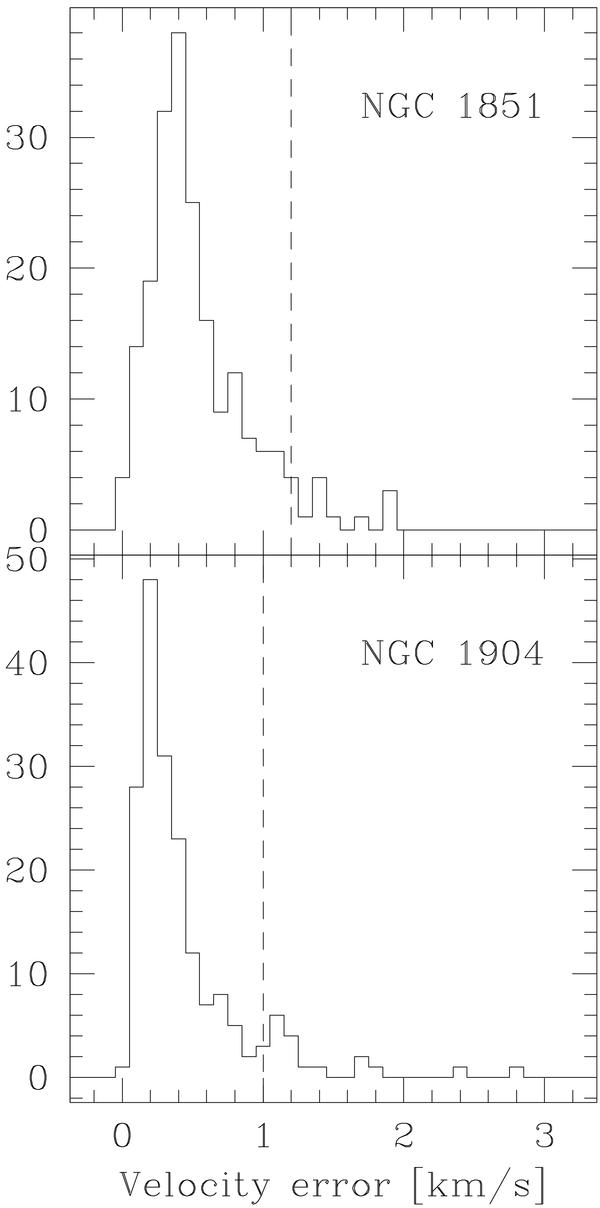
Distribution of velocity uncertainties derived from the comparison of repeated velocities measurements of the same target. The peak of the distribution is at ~0.4 and ~0.2 km s-1 in NGC 1841 and 1904, respectively. This difference is due to targets in NGC 1904 being on average 0.4 mag brighter than those in NGC 1851. The dashed vertical line is the adopted threshold for rejecting objects.
Current usage metrics show cumulative count of Article Views (full-text article views including HTML views, PDF and ePub downloads, according to the available data) and Abstracts Views on Vision4Press platform.
Data correspond to usage on the plateform after 2015. The current usage metrics is available 48-96 hours after online publication and is updated daily on week days.
Initial download of the metrics may take a while.