Fig. 7
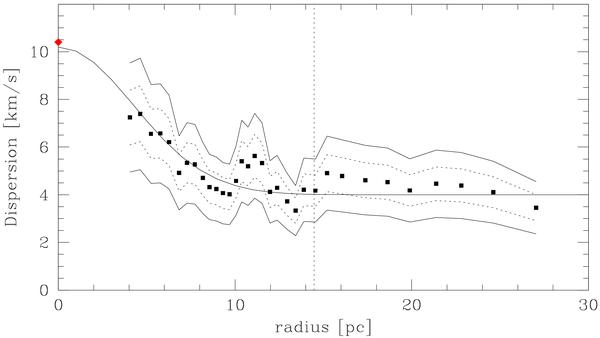
The velocity dispersion profile of NGC 1851, derived considering the 184 members with radial velocity accuracy better than 1.2 km s-1. Data have been binned in groups of 20 each, moving by 5 from one group to the next. The dotted and solid lines give the 66 and 90 percent confidence regions for the dispersion. The central velocity dispersion as reported in Harris (1996) is also shown (diamond). The vertical line marks the radius where the internal acceleration of gravity is a0 (assuming M/L = 1). Overplotted on the data is a Gaussian plus a constant (not a fit to the data) to highlight the flattening of the VDP that occurs well within the cluster tidal radius of 41 pc (Harris 1996).
Current usage metrics show cumulative count of Article Views (full-text article views including HTML views, PDF and ePub downloads, according to the available data) and Abstracts Views on Vision4Press platform.
Data correspond to usage on the plateform after 2015. The current usage metrics is available 48-96 hours after online publication and is updated daily on week days.
Initial download of the metrics may take a while.