Fig. 12
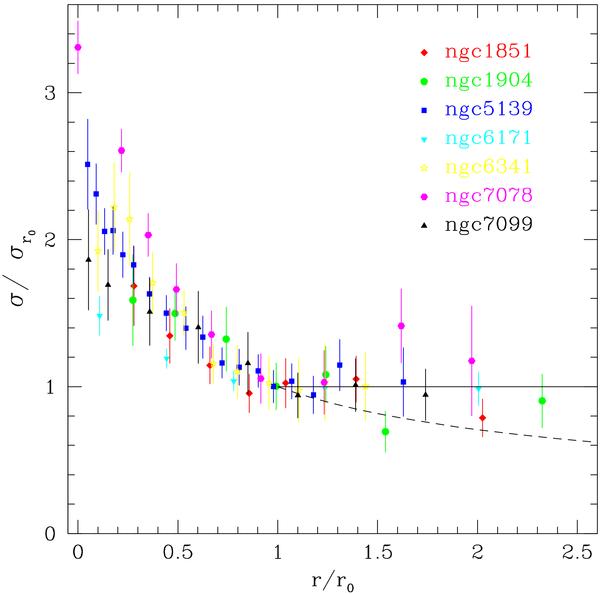
Normalized velocity dispersion profile for all high density clusters studied so far as part of this program. Radii are in units of r0, the radius where the acceleration is a0, computed assuming M/L = 1 for all clusters. The dispersion is normalized to the value at r0 to ensure in the region r > r0 profiles from different clusters are comparable. The solid line at d = 1 represent a constant velocity dispersion, while the dashed line gives the Keplerian falloff. Data for NGC 1851 and NGC 1904 are from this work, for NGC 5139 from Scarpa & Falomo (2010), for NGC 6171 from Scarpa et al. (2004a,b), and for NGC 7099 and NGC 6343 from Scarpa et al. (2007a).
Current usage metrics show cumulative count of Article Views (full-text article views including HTML views, PDF and ePub downloads, according to the available data) and Abstracts Views on Vision4Press platform.
Data correspond to usage on the plateform after 2015. The current usage metrics is available 48-96 hours after online publication and is updated daily on week days.
Initial download of the metrics may take a while.