| Issue |
A&A
Volume 522, November 2010
|
|
|---|---|---|
| Article Number | A33 | |
| Number of page(s) | 14 | |
| Section | Extragalactic astronomy | |
| DOI | https://doi.org/10.1051/0004-6361/201014807 | |
| Published online | 28 October 2010 | |
Environmental dependence of local luminous infrared galaxies
1
CEA Saclay/Service d’Astrophysique,
91191
Gif-sur-Yvette,
France
e-mail: hoseong.hwang@cea.fr
2
Astronomy Program, Department of Physics and Astronomy, Seoul
National University, Seoul
151-742,
Korea
3
Korea Astronomy & Space Science Institute,
Deajeon
305-348,
Korea
4
School of Physics, Korea Institute for Advanced Study,
Seoul
130-722,
Korea
Received:
16
April
2010
Accepted:
10
June
2010
Aims. We study the environmental dependence of local luminous infrared galaxies (LIRGs) and ultraluminous infrared galaxies (ULIRGs) found in the Sloan Digital Sky Survey (SDSS) data.
Methods. The LIRG and ULIRG samples are constructed by cross-correlating spectroscopic catalogs of galaxies of the SDSS Data Release 7 and the Infrared Astronomical Satellite Faint Source Catalog. We examine the effects of the large-scale background density (Σ5), galaxy clusters and the nearest neighbor galaxy on the properties of infrared galaxies (IRGs).
Results. We find that the fraction of LIRGs plus ULIRGs among IRGs (f(U)LIRGs) and the infrared luminosity (LIR) of IRGs strongly depend on the morphology of and the distance to the nearest neighbor galaxy: the probability of an IRG being a (U)LIRG (f(U)LIRGs) and its LIR both increases as it approaches a late-type galaxy, but decreases as it approaches an early-type galaxy (within half the virial radius of its neighbor). We find no dependence of f(U)LIRGs on the background density (surface galaxy number density) at a fixed stellar mass of galaxies. The dependence of f(U)LIRGs on the distance to galaxy clusters is also found to be very weak, but in the highest density regions, such as the center of galaxy clusters, few (U)LIRGs are found.
Conclusions. This environmental dependence of LIRGs and ULIRGs and the evolution of the star formation rate (SFR)-environment relation from high redshifts to low redshifts seem to support the idea that galaxy-galaxy interactions and merging play a critical role in triggering the star formation activity of LIRGs and ULIRGs.
Key words: galaxies: active / galaxies: evolution / galaxies: formation / galaxies: interactions / galaxies: starburst / infrared: galaxies
© ESO, 2010
1. Introduction
Since the launch of the Infrared Astronomical Satellite (Neugebauer et al. 1984, IRAS) in 1983, a great deal of effort has been put into understanding the nature of luminous infrared galaxies (LIRGs; 1011 ≤ LIR < 1012 L⊙) and ultraluminous infrared galaxies (ULIRGs; LIR ≥ 1012 L⊙): (1) what triggering mechanism is responsible for the enormous infrared (IR) luminosity (internally or externally driven); (2) what determines the relative importance between star formation (SF) and active galactic nuclei (AGN) activity within (U)LIRGs (see Sanders & Mirabel 1996; Genzel & Cesarsky 2000; Lonsdale et al. 2006; Soifer et al. 2008, and references therein). For example, most ULIRGs are found to be interacting systems between two or more late-type galaxies (e.g., Kim et al. 2002; Veilleux et al. 2002). Many LIRGs are also found associated to interacting systems, but a significant fraction of them do not show any definite features of major mergers (Ishida 2004; Wang et al. 2006; see also Shi et al. 2006, 2009; Elbaz et al. 2007; Lotz et al. 2008; Ideue et al. 2009). Thus, minor mergers and galaxy-galaxy interactions may also play an important role in triggering the star formation activity (SFA) of LIRGs.
As the Sloan Digital Sky Survey (SDSS; York et al. 2000) and Two Degree Field Galaxy Redshift Survey (2dFGRS; Colless et al. 2001) have produced unprecedented photometric and spectroscopic data of nearby galaxies, the important role of the environment in determining the SFA of galaxies in the local universe has been revealed and extensively studied (e.g., Lewis et al. 2002; Gómez et al. 2003; Kauffmann et al. 2004; Balogh et al. 2004; Tanaka et al. 2004; Owers et al. 2007; Park et al. 2007; Li et al. 2008; Park & Choi 2009; Park & Hwang 2009; Hwang & Lee 2009; Blanton & Moustakas 2009; Lee et al. 2010). However, there are a few studies that focus on how (U)LIRGs, showing much larger SFA than normal galaxies, are affected by the environment.
Goto (2005) investigated the optical properties of IR galaxies in the SDSS Data Release 3 (DR3) and finds that more luminous IR galaxies tend to be located in lower density regions. Koulouridis et al. (2006) studied the local environment of bright IRAS galaxies (BIRGs) and find that the fraction of BIRGs with a close neighbor is significantly higher than that of their control sample of nonactive galaxies. They also find that BIRGs have a similar environment to that of Seyfert 2 galaxies. Later, Zauderer et al. (2007) studied the environment of local ULIRGs at z < 0.3 using the spatial correlation amplitude parameter Bgc. The environment of most ULIRGs was found to be similar to the field, but few ULIRGs were found in high-density regions such as galaxy clusters. They also found no significant difference in the Bgc distribution of local ULIRGs with those of local Seyferts, local QSOs, and intermediate-z QSOs. Recently, Wang & Rowan-Robinson (2010) have used the Imperial IRAS-FSC redshift catalog (Wang & Rowan-Robinson 2009) to investigate the spatial clustering of galaxies as a function of several galaxy properties. They find that cirrus-type galaxies (dust emission due to the interstellar radiation field) show a stronger clustering than M 82-like starbursts (interaction-induced starbursts), which indicates that the latter resides primarily in low-density environments. They also find a correlation between the correlation strength and the IR luminosity for M 82-like actively star-forming galaxies except in high-density regions such as the center of galaxy clusters.
The environment of (U)LIRGs beyond the local universe has recently started to be explored. Farrah et al. (2006) have studied a spatial clustering of ULIRGs at 1.5 < z < 3 and find that these ULIRGs cluster more strongly than other galaxies at these epochs. Similarly, Gilli et al. (2007) suggest that 24 μm-selected, star-forming galaxies at z ~ 1 in the Great Observatories Origins Deep Survey (GOODS) appear to be more clustered than optically selected galaxies at similar redshifts and that more luminous IR galaxies have a larger correlation length. Marcillac et al. (2008) investigated the environment of LIRGs and ULIRGs at 0.7 < z < 1 in the Extended Groth Strip (EGS). They find that the local environment of (U)LIRGs is intermediate between those of red and blue galaxies. If they compare (U)LIRGs with non-IR galaxies whose stellar mass, color, or luminosity are similar to those of the (U)LIRGs, they see no significant difference in the environment between the two.
Since LIRGs and ULIRGs dominate the SFA at high redshifts (e.g., Le Floc’h et al. 2005; Magnelli et al. 2009), the understanding of the nature of (U)LIRGs is closely related to the study of the evolution of the star formation rate (SFR)-environment relation. For example, Elbaz et al. (2007) used the GOODS data and find that the SFR-density relation observed locally is reversed at z ~ 1, in the sense that the “average” SFR of galaxies over a given volume increases with the local galaxy density (see also Cooper et al. 2008; Ideue et al. 2009; Tran et al. 2010). In contrast, Patel et al. (2009) observed the galaxies in a galaxy cluster (RX J0152.7 − 1357) at z = 0.834 and find that the SFR-density relation at that redshift is not similar to those in Elbaz et al. (2007) and Cooper et al. (2008), but is similar to the one in the local universe (see also Feruglio et al. 2010). The SFR in their study is the “median” SFR in a given mass bin, which is different from the spatially “averaged” SFR of the nearby galaxies in Elbaz et al. (2007) and Cooper et al. (2008). Patel et al. (2009) argue that the contradictory results may be caused by the different environment that they investigate and by the different sample selection. They observed the central region of galaxy clusters (that is not well resolved by the other studies). Moreover, they used a mass-limited sample of galaxies that is different from the luminosity-limited sample of galaxies used in other studies, and the latter can be affected by the contribution of low-mass, blue star-forming galaxies.
In this paper, we study the environmental dependence of (U)LIRGs found in the recent SDSS data to improve understanding of the triggering mechanism of (U)LIRGs’ SFA and of the evolution of the SFR-environment relation. Section 2 describes the data and the environmental indicators used in this study. Environmental dependence of the physical properties is given in Sect. 3. Discussions and conclusions are given in Sects. 4 and 5, respectively. Throughout, we adopt h = 0.7 and a flat ΛCDM cosmology with density parameters ΩΛ = 0.73 and Ωm = 0.27.
2. Data
2.1. Observational data set
To identify LIRGs, we first cross-correlated the largest available IR source catalog and redshift catalog. For the IR source catalog, we used the IRAS Faint Sources Catalog – Version 2 (Moshir et al. 1992, hereafter FSC92), which contains 173 044 IR sources at | b | > 10deg with measured fluxes at 12, 25, 60, and 100 μm.
For the redshift catalog, we used a spectroscopic sample of galaxies including the main galaxy sample (mr < 17.77) and faint galaxies (mr > 17.77) whose spectroscopic redshifts are available in the SDSS DR7 (Abazajian et al. 2009). Completeness of the spectroscopic data in SDSS is poor for bright galaxies with mr < 14.5 because of the problems of saturation and cross-talk in the spectrograph and for the galaxies located in high-density regions such as galaxy clusters caused by the fiber collision. Thus, it is necessary to supplement the missing galaxy data to reduce the possible effects of the incompleteness problem. Therefore, we also used a photometric sample of galaxies with mr < 17.77 whose redshift information is available in the literature. We downloaded the photometric sample of galaxies with mr < 17.77 and matched it with the redshift catalogs of galaxies such as Updated Zwicky Catalog (UZC; Falco et al. 1999), MX northern Abell cluster redshift survey (Slinglend et al. 1998), EFAR survey (Wegner et al. 1996, 1999), and the redshift survey of Abell clusters (Hill & Oegerle 1993, 1998). Furthermore, we add redshift information of the photometric sample of galaxies located within ten times the virial radius of some galaxy clusters from the NASA Extragalactic Database (NED) (Park & Hwang 2009). In total, the redshift information for 184 845 galaxies in the photometric sample has been compiled, which is overlapped with 173 828 galaxies in the spectroscopic sample. Finally, we have added 11 017 galaxies to the spectroscopic sample of galaxies, which yields a final sample of 929 234 galaxies. In the result, the spectroscopic completeness of our sample is higher than 85% at all magnitudes with mr < 17.77, even in the center of galaxy clusters (see Fig. 1 in Park & Hwang 2009). The final sample also contains the galaxies whose spectral classifications provided in the SDSS are as QSOs.
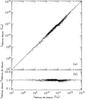 |
Fig. 1 Comparison of IR luminosities (LIR) computed from the IRAS 60 μm fluxes only (LIR(from 60 μm)) with those from the IRAS 60 and 100 μm (LIR(from 60100 μm)). We only show 30% of the total sample. |
To investigate the physical parameters of galaxies, we used several value-added galaxy catalogs (VAGCs) drawn from SDSS data. Photometric and structure parameters were adopted from SDSS pipeline (Stoughton et al. 2002). The velocity dispersion of galaxies was adopted from DR7 release of VAGC (Blanton et al. 2005). The stellar mass estimates were obtained from MPA/JHU DR7 VAGC1, which is based on the fit of SDSS five-band photometry with the model of Bruzual & Charlot (2003) (Kauffmann et al. 2003; Gallazzi et al. 2005). The Hα fluxes were also taken from MPA/JHU DR7 VAGC, which are computed from Gaussian fit to the continuum subtracted spectra (Tremonti et al. 2004).
We adopted the galaxy morphology information from Korea Institute for Advanced Study (KIAS) DR7 VAGC (Park & Choi 2005; Choi et al. 2007; Choi 2010, in prep.), which contains 697,320 main galaxy sample in NYU VAGCs, as well as 10 497 photometric sample of galaxies with the redshift information from various existing redshift catalogs. We performed additional visual classification for the galaxies in DR7 that are not included in KIAS DR7 VAGC. During the visual inspection of color images of galaxies, we eliminated 403 spurious sources (e.g., faint fragments of bright galaxies, diffraction spikes of bright stars), and they were not included in the final sample of 929 234 galaxies.
2.2. The cross-correlation
The positional uncertainties of the IRAS sources are different depending on the scan direction (typically 5′′ in-scan direction and 16′′ for the cross-scan direction, 1σ), and vary from source to source (1′′ − 13′′ for the in-scan direction, or minor axis of positional uncertainty ellipse and 3′′ − 55′′ for the cross-scan direction, or major axis of positional uncertainty ellipse, 1σ). The positional uncertainties of the optical counterparts are negligible in comparison. If a galaxy in SDSS lies within the 3σ positional uncertainty ellipse of the IRAS source, we regard it as a match. It gave us 15 611 IRAS sources having optical counterparts in the SDSS. When there were more than one SDSS galaxy within the IRAS ellipse (10% of the total number of matchings), we chose the one closest to the center of the IRAS source.
We used the spectral energy distribution (SED) models of Chary & Elbaz (2001) to compute the IR luminosity of galaxies. We restricted the computation to 15 547 sources whose IRAS 60 μm fluxes are reliable, which means that the flux quality flags are either “high quality” or “moderate quality”. Fluxes at 60 and 100 μm were used for the SED fit when their fluxes are reliable. If 100 μm flux is not reliable, we used only 60 μm flux for the SED fit. It has been pointed out that 100 μm flux of some IRAS sources could be overestimated (Jeong et al. 2007), but its effect on the estimation of IR luminosity is expected to be less than a factor of two. Since flux quality flags are different depending on the sources, we show how the derived IR luminosities agree with each other in Fig. 1. It shows that IR luminosities computed from the IRAS 60 and 100 μm (LIR(from 60,100 μm)) and those from the IRAS 60 μm fluxes only (LIR(from 60 μm)) agree well with rms = 0.08 in a logarithmic scale. We further rejected 40 galaxies whose redshift confidence parameters (zConf) are smaller than 0.65, and finally have a sample of 15 507 IR galaxies.
Since our sample is constructed by the cross-correlation based on the position alone, it may contain spurious sources due to the chance presence of a galaxy within the positional uncertainty of IR sources. In order to secure the sample of highly reliable association between IR sources and the optical counterparts, we compute the likelihood ratio (LR) for each association (Sutherland & Saunders 1992). The LR is defined by the ratio of the probability of a true association to that of a chance association2
where n( ≤ m) is the local surface density of objects brighter than the candidate. The “normalized distance” r is given by
where d1 and d2 are positional differences along the two axes of an error ellipse for an IR source, and σ1, σ2 are the lengths of these axes. Since the positional uncertainties of SDSS galaxies are negligible compared to those of IRAS sources, we define σ as the length of the error axes of the IRAS sources, and Q( ≤ m) is a multiplicative factor, which is a prior probability that a “true” optical counterpart brighter than the magnitude limit exists in the association. For simplicity we set Q = 1 in this study.
We compute n( ≤ m) using the photometric sample of galaxies within 3σ error ellipses,
where N( ≤ m) represents the number of galaxies of which magnitudes are less than or equal to that of a candidate, and α = 3. We then obtain the LR for our sample
We compute LR values for all IRAS sources that have optical counterparts in SDSS using the photometric sample of galaxies. To calculate the reliability of the association using the LR values, we perform random associations by offsetting the positions of IRAS sources by ≈ 30′, and recompute LR values for each random association (e.g., Hwang et al. 2007). Using the distribution of LR values for true and random associations, the reliability of each association with a given LR is defined by
where Ntrue(LR) and Nrandom(LR) are the number of true and random associations with a given LR. In Fig. 2, we present the distribution of LR values and the reliability of our cross-correlation as a function of LR. It appears that the reliability for IRAS sources decreases as LR decreases. Therefore, we made a final sample of 13,470 IR galaxies by selecting IRAS sources whose reliability is greater than 90% (LR ≥ 0.55).
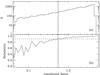 |
Fig. 2 a) Distribution of likelihood ratio (LR). b) Reliability of our cross-correlation vs. LR. Vertical dashed line represents the critical LR values (90%) of reliable identification for IRAS sources adopted in this study. |
In the present study, we assign a single optical counterpart to a given IRAS source. However, there can be multiple optical sources within the 3σ positional uncertainty ellipse of the IRAS source, which may contribute to the measured IR flux. This may result in overestimation of LIR for the optical source, with a stronger effect in high-density regions such as galaxy groups/clusters (Allam et al. 1996; Le Floc’h et al. 2002; Bitsakis et al. 2010). To investigate this effect on our galaxy sample, we checked the ratio of the IR luminosity (LIR) to the optical luminosity in r-band (Lr) as a function of the background density and the distance to galaxy clusters for galaxies in the volume-limited sample of L1 (to defined in the next section). IR luminosity is known to correlate with the optical luminosity (see Fig. 5a). If we had overestimated LIR for galaxies in high-density regions, the ratio LIR/Lr would be expected to be artificially larger in high-density regions. Instead, we find that this ratio does not change with the background density and the distance to galaxy clusters, which suggests that this effect is not significant here. The AKARI satellite is going to provide new all-sky maps with a better spatial resolution than IRAS, which will definitely solve this issue (Murakami et al. 2007).
From now on, we call galaxies with LIR ≥ 1010L⊙ infrared galaxies (IRGs), those with 1010 ≤ LIR < 1010.5L⊙ lower-luminosity infrared galaxies (LLIRGs), those with 1010.5 ≤ LIR < 1011L⊙ moderately luminous infrared galaxies (MLIRGs), those with 1011 ≤ LIR < 1012L⊙ LIRGs, those with 1012 ≤ LIR < 1013L⊙ ULIRGs, and those with LIR ≥ 1013L⊙ hyperluminous infrared galaxies (HLIRGs) (Goto 2005). In the final sample, we have 11 964 IRGs including 3049 LLIRGs, 4362 MLIRGs, 4266 LIRGs, 268 ULIRGs, and 19 HLIRGs.
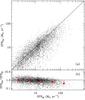 |
Fig. 3 Comparison of SFRs determined from LIR with those from LHα. We only plot galaxies whose spectral type is classified as star-forming (see Sect. 3.1). Filled circles in b) are median values of the ratios (SFRHα/SFRIR) at each bin, and the error bars indicate the dispersion of the ratios. |
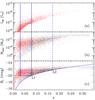 |
Fig. 4 a) IR luminosity, b) stellar mass, and c) absolute r-band magnitude vs. redshift. Red dots indicate IRGs (only 30% of IRGs are shown), and black dots denote galaxies without IR detection in the spectroscopic sample (only 1% of galaxies in the total sample are shown). Solid and dashed lines in c) define the volume limited samples, L1 and L2, respectively. The bottom curve corresponds to the apparent magnitude limit (mr = 17.77) for the main galaxy sample in SDSS. |
Since the IRGs in this study have IR luminosities and Hα emission line fluxes provided by SDSS, we compared the two SFR measurements for further analysis. We converted the IR luminosity into SFRIR using the relation in Kennicutt (1998): SFRIR (M⊙ yr-1) = 1.72 × 10⁻¹⁰LIR(L⊙). The Hα luminosity (LHα) was computed from the flux measurement given in the MPA/JHU VAGCs by applying aperture corrections following the method given in appendix A of Hopkins et al. (2003). Obscuration correction was also applied using the reddening curve of Cardelli et al. (1989). Thus, SFRHα was converted from the LHα using the relation in Kennicutt (1998): SFRHα (M⊙ yr-1) = 7.9 × 10-42LHα (ergs s-1). Figure 3 represents the comparison between SFRHα and SFRIR, and shows that the two measurements seem to agree well, although with a larger scatter than in other studies limited to local galaxies (Kewley et al. 2002; Kennicutt et al. 2009) most probably due to including more distant galaxies here. It is also seen that SFRHα tends to underestimate the SFR for IR luminous galaxies probably because of the increasing uncertainty on the obscuration correction, which is also seen in other studies (Kewley et al. 2002; Hopkins et al. 2003; Kennicutt et al. 2009).
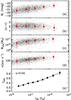 |
Fig. 5 Physical parameters of IRGs as a function of LIR. a) Absolute magnitude Mr; b) (u − r) color; c) stellar mass Mstar; and d) velocity dispersion σ. Filled circles are median values of each bin, and error bars indicate the dispersion of the data; e) AGN fraction (Seyferts, LINERs and composite galaxies). We show only 30% of IRGs in the plot, but median values and AGN fraction are computed using the whole IRG sample. |
2.3. Galaxy environment
We define a volume-limited sample of galaxies selected by absolute magnitude and redshift limits as shown in Fig. 4c. We define two samples, L1 and L2, that were chosen to maximize the number of target IRGs (to be discussed in the end of this section) and the number of ULIRGs in the volume, respectively: L1 (0.03 ≤ z < 0.0788 and Mr ≤ − 19.91) having 134 272 galaxies including 5513 IRGs (6 ULIRGs) and L2 (0.03 ≤ z < 0.17 and Mr ≤ − 21.68) having 129 851 galaxies including 2157 IRGs (38 ULIRGs). The apparent magnitude limit line (mr = 17.77) for the SDSS main galaxy sample shown in Fig. 4c is obtained using the mean K-correction relation given by Eq. (2) of Choi et al. (2007).
We consider three kinds of environment indicators: a surface galaxy number density estimated from the five nearest neighbor galaxies (Σ5) as a large-scale environmental parameter, a distance to the nearest neighbor galaxy (Rn) as a small-scale environmental parameter, and a distance to a galaxy cluster (R).
The background density, Σ5, is defined by  , where
Dp,5 is the projected distance to the
5th-nearest neighbor. The fifth-nearest neighbor to each target galaxy is identified in
the volume-limited sample of L1 among the neighbor galaxies that have relative velocities
to the target galaxy less than 1500 km s-1 to exclude foreground and background
galaxies. The Σ5 for L2 galaxies is computed with the same method as for L1
galaxies.
, where
Dp,5 is the projected distance to the
5th-nearest neighbor. The fifth-nearest neighbor to each target galaxy is identified in
the volume-limited sample of L1 among the neighbor galaxies that have relative velocities
to the target galaxy less than 1500 km s-1 to exclude foreground and background
galaxies. The Σ5 for L2 galaxies is computed with the same method as for L1
galaxies.
To investigate the environment of galaxy clusters in detail, we computed the distance to galaxy clusters as a second environmental parameter using the method given in Park & Hwang (2009). We use the Abell clusters and the sample of 929 234 galaxies in this study. The radius of r200,cl (usually called the virial radius) for each cluster where the mean overdensity drops to 200 times the critical density of the universe ρc is computed with the formula given by Carlberg et al. (1997):
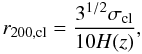
where
σcl is the velocity dispersion of a cluster, the Hubble
parameter at z is ![$H^2(z)=H^2_0 [\Omega_{\rm m}(1+z)^3 +\Omega_k(1+z)^2+\Omega_\Lambda]$](/articles/aa/full_html/2010/14/aa14807-10/aa14807-10-eq88.png) (Peebles 1993), and Ωm, Ωk, and
ΩΛ are the dimensionless density parameters.
(Peebles 1993), and Ωm, Ωk, and
ΩΛ are the dimensionless density parameters.
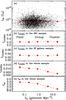 |
Fig. 6 a) LIR of IRGs in L1 as a function of Σ5. Filled circles are median values at each density bin. b) Fraction of LIRGs plus ULIRGs among IRGs as a function of Σ5. c) Fraction of LIRGs plus ULIRGs among SF galaxies in L1 (SFRHα ≥ 1 or SFRIR ≥ 1 M⊙ yr-1). d) Fraction of LIRGs plus ULIRGs among all galaxies in L1. e) Fraction of SF galaxies among all galaxies in L1. |
To define the small-scale environmental parameter attributed to the nearest neighbor, we first identified the nearest neighbor of a target galaxy that is the closest to the target galaxy on the projected sky and that satisfies the conditions of magnitude and relative velocity. We searched for the nearest neighbor galaxy among galaxies that have magnitudes brighter than Mr = Mr,target + 0.5 and have relative velocities less than Δυ = | υneighbors − υtarget | = 600 km s-1 for early-type target galaxies and less than Δυ = 400 km s-1 for late-type target galaxies. These velocity limits cover most close neighbors as seen in Fig. 1 of Park et al. (2008). Since we used a volume-limited sample of galaxies with Mr ≤ − 19.91 (for L1) and Mr ≤ − 21.68 (for L2), we often restrict our analysis to target galaxies brighter than Mr,target = − 20.41 (for L1) and Mr,target = − 22.18 (for L2) so that their neighbors are complete when we investigate the effects of the nearest neighbor galaxy.
The virial radius of a galaxy within which the mean mass density is 200 times the critical density of the universe (ρc) is computed by
where L is the galaxy luminosity, and γ the mass-to-light ratio. We assume that the mass-to-light ratio of early-type galaxies is on average twice as large as that of late-type galaxies at the same absolute magnitude Mr, which means γ(early) = 2γ(late) (see Sect. 2.5 of Park & Choi 2009 and Sect. 2 of Park et al. 2008).
Since we adopt Ωm = 0.27, 200ρc = 200ρ̅ / Ωm = 740ρ̅ where ρ̅ is the mean density of the universe. The value of mean density of the universe, ρ̅ = (0.0223 ± 0.0005)(γL)-20(h-1Mpc)-3, was adopted where (γL)-20 is the mass of a late-type galaxy with Mr = − 20 (Park et al. 2008). According to our formula the virial radii of galaxies with Mr = − 19.5, − 20.0, and − 20.5 are 260, 300, and 350 h-1 kpc for early types, and 210, 240, and 280 h-1 kpc for late types, respectively.
3. Results
3.1. Physical parameters as a function of IR luminosity
We show several physical parameters as a function of IR luminosity for IRGs in Fig. 5. In this plot, we use all the IRGs instead of the volume-limited sample of galaxies. It is seen that, as LIR increases, IRGs become more luminous in r-band (a), bluer in (u − r) color (b), and more massive (c, d). Interestingly, bluer colors for more IR luminous galaxies may be incompatible with the idea that IR luminous galaxies are dust-enshrouded systems. However, this can be explained by the idea that the optical colors of ULIRGs are dominated by the extended distribution of young blue stars, and the dust extinction is patchy (Chen et al. 2010). Veilleux et al. (1999) also found bluer optical colors for more IR luminous galaxies in the sample of ULIRGs, and suggested that the optical continuum was less affected by dust extinction than the emission-line gas near hot stars or AGNs.
We measured the fraction of galaxies showing AGN activity among emission-line galaxies in (e). We determined the spectral types of emission-line galaxies based on the criteria given by Kewley et al. (2006) using the emission line ratio diagram, commonly known as the Baldwin-Phillips-Terlevich (BPT) diagram (Baldwin et al. 1981): star-forming galaxies, Seyferts, LINERs, composite galaxies, and ambiguous galaxies. We regard Seyferts plus LINERs and composite galaxies as galaxies showing AGN activity, and restrict our analysis to the galaxies at z > 0.04 owing to the problem of small (3″) fixed-size aperture (Kewley et al. 2006). The uncertainties of the fraction represent 68% (1σ) confidence intervals that are determined by the bootstrap resampling method. Interestingly, the AGN fraction for IRGs keeps increasing as LIR increases over all the IR luminosity range, which is consistent with previous results (e.g., Veilleux et al. 1995, 2002; Yuan et al. 2010).
We wish to emphasize that the sample of (U)LIRGs used in this study is dominated by LIRGs (99.5% and 97.4% among (U)LIRGs in L1 and L2, respectively), so the results in the next sections are mostly determined by LIRGs (to be discussed in Sect. 4.1).
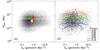 |
Fig. 7 a) Distributions of IRGs in L1 in the space of Mstar and Σ5. ULIRGs, LIRGs, MLIRGs, LLIRGs, and non-SF galaxies are plotted with star, circle, triangle, upside down triangle, and square, respectively. Non-SF galaxies are those with SFRHα = 0 and SFRIR = 0 (M⊙ yr-1). Error bars indicate the 1σ-dispersion of the distribution. Gray contour map is the number density of non-SF galaxies, and red dots are ULIRGs. b) f(U)LIRGs contours in the space of Mstar and Σ5. Dots are IRGs. |
3.2. Background density dependence of IRG properties
In Fig. 6, we present the IR luminosity of IRGs and the fraction of LIRGs plus ULIRGs among several galaxy samples (f(U)LIRGs) in L1 as a function of the background density (Σ5). It appears that neither the median LIR values (Fig. 6a) nor f(U)LIRGs (in the IRG sample, b) change with Σ5. Note that f(U)LIRGs in (b) is the fraction of LIRGs plus ULIRGs among IRGs, which is different from the fraction of SF galaxies that are usually found to decrease monotonously as the background density increases. This is due to the large contribution of non-SF galaxies in high-density regions (see e). When we compute f(U)LIRGs in the whole sample regardless of IR and Hα detections (Fig. 6d), it decreases as Σ5 increases. On the other hand, if we compute f(U)LIRGs in the SF galaxy sample as shown in (c), we find a similar trend of f(U)LIRGs to the case of IRGs in (b). We call SF galaxies those with SFRIR or SFRHα ≥ 1 M⊙ yr-1. We include galaxies having Hα measurements in order to account for SF galaxies that are not detected in IR bands because of the IR detection limit. Since IRGs can be regarded as a representative sample of SF galaxies (IRGs are by definition galaxies with SFRIR > 1.72 M⊙ yr-1 in this study) and we are interested in the triggering mechanism of (U)LIRGs that are extreme cases among IRGs, we focus on f(U)LIRGs in the IRG sample in further analysis. When we use only the sample of IRGs hosting AGNs in (b), no dependence of f(U)LIRGs on the background density is seen again.
Since the SFA of galaxies is strongly linked to the stellar mass (Brinchmann et al. 2004; Noeske et al. 2007a,b; Elbaz et al. 2007), it is important to quantify its effect in order to investigate the effects of environment. Thus we plot the distribution of IRGs in company with the non-SF galaxies in the two-dimensional space of the stellar mass (Mstar) and the background density (Σ5) in Fig. 7a. Non-SF galaxies are those with neither Hα line emissions nor IR emission (SFRHα = 0 and SFRIR = 0 M⊙ yr-1). It is clearly seen that the stellar mass of IRGs increases as LIR increase, while the median values of Σ5 do not change much with LIR. IRGs tend to be found in low-density regions compared to non-SF galaxies. Panel (b) shows constant f(U)LIRGs contours in the same parameter space. Interestingly, the f(U)LIRGs contours are nearly horizontal, which confirms that the dependence of f(U)LIRGs on the background density is much weaker than on the stellar mass. When we use galaxies in L2 that contain more ULIRGs than L1, no dependence of f(U)LIRGs is found again (see Fig. 8).
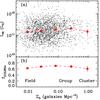 |
Fig. 8 a) LIR of IRGs in L2 as a function of Σ5. Filled circles are median values at each density bin. b) Fraction of LIRGs plus ULIRGs among IRGs as a function of Σ5 in L2. |
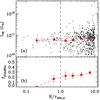 |
Fig. 9 a) LIR of IRGs in L1 as a function of the clustercentric radius normalized to the cluster virial radius (R / r200,cl). Filled circle is the median value of each density bin. b) f(U)LIRGs vs. R / r200,cl. |
3.3. Effect of galaxy clusters on IRG properties
In Fig. 9, we present LIR of IRGs and f(U)LIRGs as a function of the projected distance to the galaxy cluster (R). We restrict this plot to the IRGs whose clustercentric distances are measured in this study. Figure 9a shows that the median LIR values do not change much with the clustercentric distance. In panel (b), f(U)LIRGs appears to decrease with large error bars, as we approach the center of galaxy clusters. Moreover, in the very center of galaxy clusters (R < 0.5r200,cl), no (U)LIRGs are found.
We plot, in Fig. 10, the distribution of IRGs in the space of the stellar mass and the clustercentric radius. The right panel shows that f(U)LIRGs decreases as IRGs are located closer to the center of clusters. The dependence of f(U)LIRGs on the clustercentric radius is much weaker than the dependence on the stellar mass. According to our finding in the next section this dependence can appear because the typical morphology of the nearest neighbor changes from late type to early type. The IRGs near the central region are typically under the strong influence of early-type neighbors, so it is difficult to show (U)LIRGs behaviors.
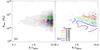 |
Fig. 10 a) Distributions of IRGs in L1 in the space of the stellar mass and the clustercentric radius. Symbols are same as in Fig. 7. b) f(U)LIRGs contours in the space of the stellar mass and the clustercentric radius. Dots are IRGs. |
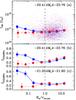 |
Fig. 11 a) LIR of IRGs in L1 plus L2 ( − 20.41 ≥ Mr ≥ − 23.76) as a function of the projected distance to the nearest neighbor galaxy (Rn / rvir,nei). Red and blue dots are the galaxies having early- and late-type nearest neighbor galaxies, respectively. Circle (early-type neighbor case) and square (late-type neighbor case) are median values of each density bin. f(U)LIRGs vs. Rn / rvir,nb) for IRGs in L1 plus L2 ( − 20.41 ≥ Mr ≥ − 23.76) and c) for IRGs with − 21.20 ≥ Mr ≥ − 21.80 among L1 plus L2. |
3.4. Nearest neighbor dependence of IRG properties
To measure the effect of the nearest neighbor galaxy on the SFA of IRGs, we plot LIR of IRGs and f(U)LIRGs as a function of the distance to the nearest neighbor in Fig. 11. In order to remain complete in terms of neighbor galaxies, we restrict our analysis to the galaxies having Mr ≤ − 20.41 and Mr ≤ − 22.18 in L1 and L2, respectively. Panels (a-b) show that LIR and f(U)LIRGs depend on the projected distance to the nearest neighbor, as well as on the neighbor’s morphology. When an IRG is located farther than 0.5 rvir,nei (virial radius of neighbor galaxy), f(U)LIRGs decreases as the distance to the neighbor decreases, but its dependence on the neighbor’s morphology is negligible. On the other hand, when an IRG is located at Rn ≲ 0.5rvir,nei, f(U)LIRGs increases as the target IRG approaches a late-type neighbor, but decreases as it approaches an early-type neighbor. It is important to note that the bifurcation of f(U)LIRGs depending on the neighbor’s morphology occurs at Rn ≈ 0.5rvir,nei, which is similarly seen in the plot of median LIR values along with the distance to the nearest neighbor.
To check whether the difference in f(U)LIRGs between IRGs with a late- and early-type close neighbor is real or if it could be explained by small number statistics, we made the following experiment. We produced 1000 Monte-Carlo realizations of the same number of galaxies with close neighbors by randomly selecting galaxies from the larger sample of galaxies with no neighbor closer than Rn = rvir,nei (24 and 7 galaxies with late- and early-type neighbors at Rn < 0.03rvir,nei, respectively). While in the real dataset, f(U)LIRGs is 3.8 times larger for IRGs with a late-type neighbor than for those with an early-type neighbor, such a large difference is found in only 6% of the random samples, which suggests that the difference is real. This experiment supports the robustness of the bifurcation of f(U)LIRGs depending on the neighbor’s morphology at Rn ≲ 0.5rvir,nei.
The trends seen in panel (b) of Fig. 11 with respect to Rn are actually coupled with luminosity dependence of f(U)LIRGs. To disentangle f(U)LIRGs from the coupling with luminosity and to see its dependence only on the neighbor environment, we fix the absolute magnitude of IRGs to a narrow range of − 21.20 ≥ Mr ≥ − 21.80 in panel (c) of Fig. 11. Now f(U)LIRGs remains nearly constant down to Rn ≈ 0.5rvir,nei, which indicates no direct neighbor effect at these separations. The bifurcation of f(U)LIRGs still occurs at Rn ≈ 0.5rvir,nei. We discuss these findings in more detail in Sect. 4.1.
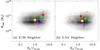 |
Fig. 12 Distributions of IRGs in L1 plus L2 in the space of the stellar mass and the distance to the nearest neighbor galaxy when the nearest galaxy is an early type a) and a late type b). Symbols are the same as in Fig. 7. Red dots are ULIRGs. |
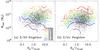 |
Fig. 13 f(U)LIRGs for IRGs in in L1 plus L2 in the space of Mstar and Rn / rvir,nei when the nearest galaxy is an early type a) and a late type b). Dots are IRGs. |
In Fig. 12, we present the distribution of IRGs in the space of the stellar mass and the distance to the nearest neighbor. When the nearest neighbor galaxy of IRGs is an early type (a), IRGs are primarily located farther away from their neighbor than non-SF galaxies, and more luminous IRGs are farther away from their neighbor. On the other hand, the median distance to the nearest neighbor for the late-type neighbor case (b) is not clearly distinguishable among IRGs including non-SF galaxies.
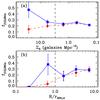 |
Fig. 14 a) f(U)LIRGs for IRGs in L1 as a function of Σ5. Circle (early-type neighbor case) and square (late-type neighbor case) are median values of each density bin. Vertical dashed line indicates the Σ5 that roughly corresponds to one virial radius of the clustercentric radius (R ~ r200,cl) determined from the comparison between Σ5 and the distance to galaxy clusters in L1. b) Same as above, but for f(U)LIRGs vs. R / r200,cl. |
The f(U)LIRGs contours in the same parameter space are plotted in Fig. 13 depending on the morphology of the nearest neighbor. Unlike the f(U)LIRGs contours in the space of Mstar and Σ5 seen in Fig. 7b, the constant f(U)LIRGs contours in Fig. 13 depend on both Mstar and Rn. When an IRG is located at Rn ≲ 0.5rvir,nei, the probability that IRGs become (U)LIRGs increases as IRGs are more massive and are farther away from their neighbor regardless of the morphology of the nearest neighbor. However, if an IRG is located at Rn ≲ 0.5rvir,nei, the dependence of f(U)LIRGs on Mstar and Rn is significantly different depending on the morphology of the nearest neighbor. For the early-type neighbor case, f(U)LIRGs increases as IRGs are more massive and are farther away from their neighbor, while f(U)LIRGs increases as IRGs are more massive and are closer to their neighbor for the late-type neighbor case. The different behavior of f(U)LIRGs depending on the morphology of the nearest neighbor indicates an important role for the nearest neighbor on the activity of IRGs.
Bearing in mind that there is a strong effect of the nearest neighbor galaxy on f(U)LIRGs, we re-investigate the dependence of f(U)LIRGs on the background density and the distance to galaxy clusters. Figure 14 shows f(U)LIRGs as a function of the background density and the distance to galaxy clusters as seen in Figs. 6, 8, and 9, but depending on the morphology of nearest neighbor galaxy. It is seen that f(U)LIRGs for the late-type neighbor case, on average, are larger than those for the early-type neighbor case. The difference in f(U)LIRGs are insignificant in low-density regions where the distance to the nearest neighbor is large. However, the difference of f(U)LIRGs becomes prominent in high-density regions (even in the cluster region of R ~ 0.6r200,cl) where the neighbor separation is less than in low-density regions so that IRGs experience the effect of the neighbor galaxy. These again confirm the strong effects of the nearest neighbor on f(U)LIRGs.
4. Discussions
4.1. What powers LIRGs and ULIRGs?
The strong dependence of f(U)LIRGs and median LIR values on the morphology of and the distance to the nearest neighbor galaxy seen in Sect. 3.4 supports the idea that LIRGs and ULIRGs are triggered by galaxy-galaxy interactions and merging. In particular, the bifurcation of f(U)LIRGs and median LIR values occurs at Rn ≈ 0.5rvir,nei where the effects of galaxy-galaxy interactions can significantly appear (Park & Choi 2009). The bifurcation of f(U)LIRGs and median LIR values at Rn ≈ 0.5rvir,nei depending on the morphology of the neighbor may imply that the hydrodynamic interactions with the nearest neighbor play critical roles in triggering SFA of IRGs in addition to the tidal interactions. If an IRG approaches a late-type neighbor within half of the virial radius of the neighbor, the inflow of cold gas from the neighbor into the target IRG increases and the SFA of IRGs can be boosted. On the other hand, if an IRG approaches an early-type neighbor within the virial radius of the neighbor, the hot gas of the early-type neighbor prevents the IRG from forming stars with cold gas, or there is no inflow of cold gas from its early-type neighbor, so the SFA of IRG is not boosted even if it has a close companion. The SF quenching mechanisms of hot gas in early-type neighbors could be similar to those of a hot intracluster medium of galaxy clusters acting on late-type galaxies in it, which are hydrodynamic processes such as thermal evaporation, strangulation, ram pressure stripping, or viscous stripping (Park & Choi 2009; Park & Hwang 2009). IRGs may not necessarily be late types. In fact, 4% of IRGs in this study are early types, which again shows the importance of hydrodynamic interactions with late-type neighbors for the SFA.
Interestingly, if we see Fig. 11 (a, b), f(U)LIRGs and median LIR values at the largest neighbor separations (Rn ~ 15rvir,nei) appear to be higher than those at the intermediate neighbor separation (Rn ~ 2rvir,nei), which may provide another hint of the evolution of (U)LIRGs. As an IRG experiences interactions and merging with its closest neighbor galaxy, the galaxies in a pair tend to be (U)LIRGs though the probability of becoming (U)LIRGs is different depending on the morphology of the neighbor. When two galaxies just finished merging, the end product of the merger will be bright due to the very recent SFA and/or the increase in mass, and the new nearest neighbor galaxy of the merger product will be far away. This seems to be related to the fact that some (U)LIRGs are in pairs and others are found as a single system (e.g., Kim et al. 2002; Veilleux et al. 2002), and to the variation in SFA of (U)LIRGs along with the merger stage (e.g., Murphy et al. 2001). The SFA then would decrease until the galaxy experiences new interactions or merging with the nearest neighbor galaxy. This scenario is consistent with there being no dependence of f(U)LIRGs and median LIR values on the neighbor’s morphology at this separation (Rn > 0.5rvir,nei), and could explain why f(U)LIRGs and median LIR values at the largest neighbor separation are greater than those at the intermediate neighbor separation. As we show in Fig. 11c, if we fix the absolute magnitude of IRGs (or stellar mass), the bifurcation of f(U)LIRGs depending on the morphology of the nearest neighbor at Rn ≲ 0.5rvir,nei is still seen, but f(U)LIRGs (and median LIR values) remains constant at large separations (Rn > 0.5rvir,nei), which is consistent with the interpretation above. These results seem to be compatible with recent studies focusing on the effects of the nearest neighbor galaxies on the evolution of “normal” galaxies (Park et al. 2008; Park & Choi 2009; Park & Hwang 2009; Hwang & Park 2009), and with the scenario of transformation of galaxy morphology and luminosity class through galaxy-galaxy interactions and merging (Park et al. 2008).
On the other hand, we find no dependence of f(U)LIRGs on the background density (see Figs. 6–8). When we use the distance to the nearest galaxy cluster instead of using Σ5, the results are similar: dependence of f(U)LIRGs on the clustercentric distance is weak except for the highest density region such as the center of galaxy clusters. If the SFA of IRGs is increased by interactions in general, one would expect to find an increase of f(U)LIRGs with the background density. The reason why such a trend is not seen can be explained by a selective effect of the neighboring galaxy when it is closer than the virial radius of the neighbor; i.e., only late types produce an increase of f(U)LIRGs. This can be understood by the need to provide cold gas together with the dynamical interaction. These results are compatible with the result from the study of Hickson compact groups of galaxies that specific SFRs of galaxies in dynamically “young (dominated by late-type galaxies)” groups are, on average, higher than those in dynamically “old (dominated by early-type galaxies)” groups (Bitsakis et al. 2010).
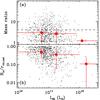 |
Fig. 15 a) Stellar mass ratio between IRGs and their nearest neighbor galaxy, and b) projected distance to the nearest neighbor galaxy of IRGs (Rn / rvir,nei) as a function of LIR of IRGs in L1 plus L2. IRGs (Mr ≤ − 21) having late-type neighbors at Rn ≤ rvir,nei are shown. Large filled circles and vertical error bars represent the median values and their errors in LIR bins that are represented by horizontal error bars . The dashed horizontal line in a) divides IRGs into major (mass ratio < 4) and minor (mass ratio > 4) mergers. |
As we mentioned in Sect. 3.1, the sample of (U)LIRGs used in this study is dominated by LIRGs. Thus these findings demonstrate that not only ULIRGs but also LIRGs are strongly affected by interactions and merging. To investigate what makes LIRGs and ULIRGs different in detail, we plot the ratio of the stellar mass between IRGs (MIRG) and their nearest neighbor galaxy (Mn) (i.e. max[MIRG,Mn]/min[MIRG,Mn]) as a function of LIR in Fig. 15a. We used all galaxies in L1 or L2 to find the nearest neighbor galaxy of IRGs without using the magnitude condition (Mr = Mr,target + 0.5) introduced in Sect. 2.3 in order to have no constraints on the mass range of neighbor galaxies. We show only IRGs with Mr ≤ − 21 to reduce the effect of absolute magnitude limit in L1 (Mr = − 19.91) on the lower limit of neighbor’s mass. In addition, we only plot IRGs interacting with a late-type nearest neighbor (i.e. IRGs with a late-type neighbor at Rn ≤ rvir,nei). It shows that the mass ratio between an IRG and its interacting pair appears to decrease as LIR increases. The fraction of minor merger system (i.e. mass ratio ≥ 4) is found to be 36, 34, and 14% for LLIRGs plus MLIRGs, LIRGs, and ULIRGs, respectively. Owing to the small number of ULIRGs in our sample, the fraction of minor merger system for ULIRGs is computed by including galaxies with LIR > 9 × 10¹¹L⊙. We checked the statistical significance of the difference in the fraction of minor merger system depending on LIR by Monte Carlo simulations. We constructed 1000 trial data sets by randomly selecting the same number of galaxies at each LIR bin from the real data, and computed the fraction of simulated data sets in which the median value of mass ratio is higher than 4 (i.e. minor merger system). We find 17, 18, and 2% for LLIRGs plus MLIRGs, LIRGs, and ULIRGs, respectively. These results indicate that a non-negligible fraction of LIRGs is related to the minor merger or interactions between two galaxies with a large mass difference, while few ULIRGs are minor merger systems (Ishida 2004; Wang et al. 2006; Dasyra et al. 2006; see also Shi et al. 2006, 2009; Elbaz et al. 2007; Lotz et al. 2008; Ideue et al. 2009).
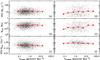 |
Fig. 16 a) SFRs of IRGs in L1, b) stellar mass of IRGs, Mstar, and c) specific SFRs of IRGs as a function of Σ5. (d)–f)) Same as (a)–c)), but for the high-redshift IRGs (0.8 < z < 1.2) studied in Elbaz et al. (2007). Median value and its error at each bin is shown by a filled circle and its error bar. |
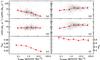 |
Fig. 17 a) Average SFR computed using all galaxies in L1, ⟨ aSFR ⟩ , b) average SFR computed with IRGs, ⟨ SFR ⟩ , and c) the fraction of IRGs among all galaxies as a function of Σ5. (d)–f)) Same as (a)–c)), but for the high-redshift IRGs (0.8 < z < 1.2) studied in Elbaz et al. (2007). Median value and its error at each bin is shown by filled circle and its error bar. |
Using the same sample as above, we show projected distances to the nearest neighbor galaxy of IRGs as a function of LIR in Fig. 15b. It is seen that distances to the nearest neighbor galaxies are less for ULIRGs than for LIRGs. If IRGs with Rn ≤ 0.1rvir,nei can be regarded as advanced merger systems, the fraction of advanced merger systems for LLIRGs plus MLIRGs, LIRGs, and ULIRGs is 6, 21, and 50%, respectively. We checked the statistical significance of the difference in median values of Rn / rvir,nei depending on LIR based on the Monte Carlo simulations with 1000 trial data sets made by randomly selecting the same number of galaxies at each LIR bin from the real data. We computed the fraction of simulated data sets in which the median value of Rn / rvir,nei is less than 0.1 (i.e. advanced merger), and find 0, 3, and 49% for LLIRGs plus MLIRGs, LIRGs, and ULIRGs, respectively. These results can suggest that ULIRGs are more advanced merger systems (or strong interaction) than LIRGs.
In summary, the SFA of both LIRGs and ULIRGs is triggered by the interaction and merging with late-type (gas-rich) neighbor galaxies, but they seem to differ in the sense that 1) stellar masses of ULIRGs are larger than those of LIRGs (see Figs. 5c and 12), 2) few ULIRGs are minor merger systems but a non-negligible fraction of LIRGs (~34%) is a minor merger system, and 3) ULIRGs are more advanced merger systems than LIRGs.
4.2. Evolution of SFR-environment relation
To investigate how the effects of the environment on the SFA of galaxies evolve with cosmic time, we plot, in Figs. 16 and 17, several SFA parameters of IRGs as a function of the background density (Σ5) in comparison with those at high redshifts studied in Elbaz et al. (2007). In Fig. 16, SFRs, stellar masses, and specific SFRs for local IRGs (a–c) do not show any significant change along with the background density, while SFRs and stellar masses for high-redshift IRGs (d–e) increase as the background density increases.
In Fig. 17, we show the spatially averaged SFRs for IRGs as a function of the background density. The average SFR is computed at the position of IRG using the neighbor galaxies that have velocities relative to the IRG less than 1500 km s-1 and the projected distance to the IRG less than 1 Mpc. ⟨ aSFR ⟩ in (a and d) is the average SFR computed using all neighbor galaxies regardless of IR detection, while ⟨ SFR ⟩ in (b and e) is the one computed using the neighbor IRGs. For the GOODS galaxies studied in Elbaz et al. (2007), we first computed the background density (Σ5,GOODS) by identifying the 5th-nearest neighbor of each IRG in the spectroscopic sample of galaxies with 0.8 < z < 1.2 and zAB ≤ 23.5 (see Elbaz et al. 2007 for details of the data). Secondly, we computed the average SFRs adopting the same method as above.
As seen in (a) and (d), the average SFR ( ⟨ aSFR ⟩ ) for local SDSS IRGs decreases as the background density increases, while the one for high-redshift IRGs increases as the background density increases. This is the reversal of the SF-density relation in the distant universe found by Elbaz et al. (2007). The different dependence of the average SFR on the background density might be caused by the different fraction of star-forming galaxies depending on the background density (see c and f): since the fraction of star-forming galaxies in the local universe is very low in high-density regions, the average SFRs in these regions are also small due to the large contribution of non-SF galaxies.
If we see the behavior of the average SFR ( ⟨ SFR ⟩ ) computed using the neighbor IRGs, ⟨ SFR ⟩ for local IRGs in (b) appears not to depend on the background density, while ⟨ SFR ⟩ for high-redshift galaxies in (e) still show an increase along with the background density. Since the average SFR ( ⟨ SFR ⟩ ) computed using the neighbor IRGs is not affected by the non-SF galaxies, it may provide important hints to what directly affects the SFA. Since the SFR of a galaxy shows a strong correlation with the galaxy mass as seen in §3 (see also Brinchmann et al. 2004; Elbaz et al. 2007; Noeske et al. 2007a,b), it is instructive to see the mass dependence of IRGs on the background density. It is seen in Fig. 16b and (e) that the median stellar masses for local IRGs do not show a significant change with the background density, while those for high-redshift galaxies increase as the background density increases, which are responsible for the difference in the average SFRs ( ⟨ SFR ⟩ ) between Fig. 17b and (e).
Finally, the key to the SF-density relation seems to be how the fraction of massive, star-forming galaxies changes with the background density. Then the reversal of SF-density relation can be understood by the idea that massive, star-forming galaxies are strongly clustered at high redshifts (e.g., Farrah et al. 2006; Gilli et al. 2007) as forming a larger structure such as a galaxy group or cluster, and that they evolve (or consume their gas) through galaxy-galaxy interactions and merging faster than those in the field. Thus, gas-exhausted, non-SF galaxies are mainly found in high-density regions of the local universe.
This environmental dependence of evolution of the SFA of galaxies is consistent with the results of recent studies of other galaxy properties such as galaxy morphology (e.g., Capak et al. 2007; Hwang & Park 2009). For example, Hwang & Park (2009) found that the early-type fraction evolves much faster in high-density regions than in low-density regions and that the morphology-density relation becomes weaker at z ≈ 1 (see their Fig. 8). It may be because the rate of galaxy-galaxy interactions is higher in high-density regions, and a series of interactions and merging over the course of galaxy life consume most of its cold gas and/or transform late types into early types.
5. Conclusions
By cross-correlating the spectroscopic sample of galaxies in the SDSS DR7 and the IRAS FSC92, we obtained a sample of nearby LIRGs and studied their environmental dependence. We examined the effects of the large-scale background density, galaxy clusters, and the nearest neighbor galaxy on the properties of IRGs. Our main results follow.
-
1.
We find no dependence of the fraction of LIRGs plus ULIRGs among IRGs (f(U)LIRGs) on the background density (Σ5), but find a strong dependence on stellar mass.
-
2.
When we use the distance to the nearest galaxy cluster instead of using Σ5, the results are similar to those based on Σ5: the dependence of f(U)LIRGs on the distance to the nearest galaxy cluster is weak except for the highest density region such as the center of galaxy clusters.
-
3.
We find that f(U)LIRGs and LIR of IRGs strongly depend on the morphology of and the distance to the nearest neighbor galaxy. When an IRG has a close neighbor galaxy, the probability for it to be a (U)LIRG (f(U)LIRGs) and its LIR increase as it approaches a late-type neighbor, but decrease as it approaches an early-type neighbor. The bifurcations of LIR and f(U)LIRGs are seen at Rn ≈ 0.5rvir,nei depending on the neighbor’s morphology.
-
4.
The median LIR values of IRGs and f(U)LIRGs at the largest neighbor separations seem to be higher than those at the intermediate neighbor separation. This supports the idea that (U)LIRGs are powered by the interaction and merging with late-type (gas-rich), nearest-neighbor galaxies as expected for unresolved advanced mergers.
-
5.
LIRGs and ULIRGs are found to differ in the sense that (1) stellar masses of ULIRGs are larger than those of LIRGs; (2) few ULIRGs are minor merger systems, but a non-negligible fraction of LIRGs (~34%) is a minor merger system; and (3) ULIRGs are more advanced merger systems than LIRGs.
-
6.
The environmental dependence of (U)LIRGs and the evolution of the SFR-environment relation from high redshifts to low redshifts seem to be consistent with the idea that galaxy-galaxy interactions and merging play a critical role in triggering the SFA of (U)LIRGs. Massive, star-forming galaxies at high redshifts are strongly clustered and evolve (or consume their gas) through galaxy-galaxy interactions and merging faster than those in the field. Thus, gas-exhausted, non-SF galaxies are mainly found in high-density regions of the local universe.
Acknowledgments
We would like to thank the anonymous referee for constructive comments that helped us improve the manuscript. We also thank C. Feruglio for helpful discussions. C.B.P. acknowledges the support of the National Research Foundation of Korea (NRF) grant funded by the Korea government (MEST) (No. 2009-0062868). M.G.L. is supported in part by a grant (R01-2007-000-20336-0) from the Basic Research Program of the Korea Science and Engineering Foundation. Funding for the SDSS and SDSS-II has been provided by the Alfred P. Sloan Foundation, the Participating Institutions, the National Science Foundation, the US Department of Energy, the National Aeronautics and Space Administration, the Japanese Monbukagakusho, the Max Planck Society, and the Higher Education Funding Council for England. The SDSS Web Site is http://www.sdss.org/. The SDSS is managed by the Astrophysical Research Consortium for the Participating Institutions. The Participating Institutions are the American Museum of Natural History, Astrophysical Institute Potsdam, University of Basel, Cambridge University, Case Western Reserve University, University of Chicago, Drexel University, Fermilab, the Institute for Advanced Study, the Japan Participation Group, Johns Hopkins University, the Joint Institute for Nuclear Astrophysics, the Kavli Institute for Particle Astrophysics and Cosmology, the Korean Scientist Group, the Chinese Academy of Sciences (LAMOST), Los Alamos National Laboratory, the Max-Planck-Institute for Astronomy (MPIA), the Max-Planck-Institute for Astrophysics (MPA), New Mexico State University, Ohio State University, University of Pittsburgh, University of Portsmouth, Princeton University, the United States Naval Observatory, and the University of Washington. This research has made use of the NASA/IPAC Extragalactic Database (NED) which is operated by the Jet Propulsion Laboratory, California Institute of Technology, under contract with the National Aeronautics and Space Administration.
References
- Abazajian, K. N., Adelman-McCarthy, J. K., Agüeros, M. A., et al. 2009, ApJS, 182, 543 [NASA ADS] [CrossRef] [Google Scholar]
- Allam, S., Assendorp, R., Longo, G., Braun, M., & Richter, G. 1996, A&AS, 117, 39 [NASA ADS] [CrossRef] [EDP Sciences] [Google Scholar]
- Baldwin, J. A., Phillips, M. M., & Terlevich, R. 1981, PASP, 93, 5 [NASA ADS] [CrossRef] [EDP Sciences] [Google Scholar]
- Balogh, M., Eke, V., Miller, C., et al. 2004, MNRAS, 348, 1355 [Google Scholar]
- Bitsakis, T., Charmandaris, V., Le Floc’h, E., et al. 2010, A&A, 517, A75 [NASA ADS] [CrossRef] [EDP Sciences] [Google Scholar]
- Blanton, M. R., & Moustakas, J. 2009, ARA&A, 47, 159 [NASA ADS] [CrossRef] [Google Scholar]
- Blanton, M. R., Schlegel, D. J., Strauss, M. A., et al. 2005, AJ, 129, 2562 [NASA ADS] [CrossRef] [Google Scholar]
- Brinchmann, J., Charlot, S., White, S. D. M., et al. 2004, MNRAS, 351, 1151 [NASA ADS] [CrossRef] [Google Scholar]
- Bruzual, G., & Charlot, S. 2003, MNRAS, 344, 1000 [NASA ADS] [CrossRef] [Google Scholar]
- Capak, P., Abraham, R. G., Ellis, R. S., et al. 2007, ApJS, 172, 284 [NASA ADS] [CrossRef] [Google Scholar]
- Cardelli, J. A., Clayton, G. C., & Mathis, J. S. 1989, ApJ, 345, 245 [NASA ADS] [CrossRef] [Google Scholar]
- Carlberg, R. G., Yee, H. K. C., & Ellingson, E. 1997, ApJ, 478, 462 [NASA ADS] [CrossRef] [EDP Sciences] [Google Scholar]
- Chary, R., & Elbaz, D. 2001, ApJ, 556, 562 [NASA ADS] [CrossRef] [Google Scholar]
- Chen, Y., Lowenthal, J. D., & Yun, M. S. 2010, ApJ, 712, 1385 [NASA ADS] [CrossRef] [Google Scholar]
- Choi, Y., Park, C., & Vogeley, M. S. 2007, ApJ, 658, 884 [NASA ADS] [CrossRef] [Google Scholar]
- Colless, M., Dalton, G., Maddox, S., et al. 2001, MNRAS, 328, 1039 [NASA ADS] [CrossRef] [Google Scholar]
- Cooper, M. C., Newman, J. A., Weiner, B. J., et al. 2008, MNRAS, 383, 1058 [Google Scholar]
- Dasyra, K. M., Tacconi, L. J., Davies, R. I., et al. 2006, ApJ, 638, 745 [NASA ADS] [CrossRef] [Google Scholar]
- Elbaz, D., Daddi, E., Le Borgne, D., et al. 2007, A&A, 468, 33 [NASA ADS] [CrossRef] [EDP Sciences] [Google Scholar]
- Falco, E. E., Kurtz, M. J., Geller, M. J., et al. 1999, PASP, 111, 438 [NASA ADS] [CrossRef] [Google Scholar]
- Farrah, D., Lonsdale, C. J., Borys, C., et al. 2006, ApJ, 641, L17 [NASA ADS] [CrossRef] [Google Scholar]
- Feruglio, C., Aussel, H., Le Floc’h, E., et al. 2010, ApJ, 721, 607 [NASA ADS] [CrossRef] [Google Scholar]
- Gallazzi, A., Charlot, S., Brinchmann, J., White, S. D. M., & Tremonti, C. A. 2005, MNRAS, 362, 41 [NASA ADS] [CrossRef] [Google Scholar]
- Genzel, R., & Cesarsky, C. J. 2000, ARA&A, 38, 761 [NASA ADS] [CrossRef] [Google Scholar]
- Gilli, R., Daddi, E., Chary, R., et al. 2007, A&A, 475, 83 [NASA ADS] [CrossRef] [EDP Sciences] [Google Scholar]
- Gómez, P. L., Nichol, R. C., Miller, C. J., et al. 2003, ApJ, 584, 210 [NASA ADS] [CrossRef] [Google Scholar]
- Goto, T. 2005, MNRAS, 360, 322 [NASA ADS] [CrossRef] [Google Scholar]
- Hill, J. M., & Oegerle, W. R. 1993, AJ, 106, 831 [NASA ADS] [CrossRef] [Google Scholar]
- Hill, J. M., & Oegerle, W. R. 1998, AJ, 116, 1529 [NASA ADS] [CrossRef] [Google Scholar]
- Hopkins, A. M., Miller, C. J., Nichol, R. C., et al. 2003, ApJ, 599, 971 [NASA ADS] [CrossRef] [Google Scholar]
- Hwang, H. S., & Lee, M. G. 2009, MNRAS, 397, 2111 [NASA ADS] [CrossRef] [Google Scholar]
- Hwang, H. S., & Park, C. 2009, ApJ, 700, 791 [NASA ADS] [CrossRef] [Google Scholar]
- Hwang, H. S., Serjeant, S., Lee, M. G., Lee, K. H., & White, G. J. 2007, MNRAS, 375, 115 [NASA ADS] [CrossRef] [Google Scholar]
- Ideue, Y., Nagao, T., Taniguchi, Y., et al. 2009, ApJ, 700, 971 [NASA ADS] [CrossRef] [Google Scholar]
- Ishida, C. M. 2004, PhD Thesis, AA, University of Hawai’i [Google Scholar]
- Jeong, W., Nakagawa, T., Yamamura, I., et al. 2007, PASJ, 59, 429 [Google Scholar]
- Kauffmann, G., Heckman, T. M., White, S. D. M., et al. 2003, MNRAS, 341, 33 [NASA ADS] [CrossRef] [Google Scholar]
- Kauffmann, G., White, S. D. M., Heckman, T. M., et al. 2004, MNRAS, 353, 713 [NASA ADS] [CrossRef] [Google Scholar]
- Kennicutt, R. C., Hao, C., Calzetti, D., et al. 2009, ApJ, 703, 1672 [NASA ADS] [CrossRef] [Google Scholar]
- Kennicutt, Jr., R. C. 1998, ARA&A, 36, 189 [Google Scholar]
- Kewley, L. J., Geller, M. J., Jansen, R. A., & Dopita, M. A. 2002, AJ, 124, 3135 [NASA ADS] [CrossRef] [Google Scholar]
- Kewley, L. J., Groves, B., Kauffmann, G., & Heckman, T. 2006, MNRAS, 372, 961 [NASA ADS] [CrossRef] [Google Scholar]
- Kim, D., Veilleux, S., & Sanders, D. B. 2002, ApJS, 143, 277 [NASA ADS] [CrossRef] [Google Scholar]
- Koulouridis, E., Chavushyan, V., Plionis, M., Krongold, Y., & Dultzin-Hacyan, D. 2006, ApJ, 651, 93 [NASA ADS] [CrossRef] [Google Scholar]
- Le Floc’h, E.,Charmandaris, V., Laurent, O., et al. 2002, A&A, 391, 417 [NASA ADS] [CrossRef] [EDP Sciences] [Google Scholar]
- Le Floc’h, E.,Papovich, C., Dole, H., et al. 2005, ApJ, 632, 169 [NASA ADS] [CrossRef] [Google Scholar]
- Lee, J. H., Lee, M. G., Park, C., & Choi, Y. 2010, MNRAS, 403, 1930 [NASA ADS] [CrossRef] [Google Scholar]
- Lewis, I., Balogh, M., De Propris, R., et al. 2002, MNRAS, 334, 673 [NASA ADS] [CrossRef] [Google Scholar]
- Li, C., Kauffmann, G., Heckman, T. M., Jing, Y. P., & White, S. D. M. 2008, MNRAS, 385, 1903 [NASA ADS] [CrossRef] [Google Scholar]
- Lonsdale, C. J., Farrah, D., & Smith, H. E. 2006, Ultraluminous Infrared Galaxies, ed. J. W. Mason (Springer Verlag), 285 [Google Scholar]
- Lotz, J. M., Davis, M., Faber, S. M., et al. 2008, ApJ, 672, 177 [NASA ADS] [CrossRef] [Google Scholar]
- Magnelli, B., Elbaz, D., Chary, R. R., et al. 2009, A&A, 496, 57 [NASA ADS] [CrossRef] [EDP Sciences] [Google Scholar]
- Marcillac, D., Rieke, G. H., Papovich, C., et al. 2008, ApJ, 675, 1156 [NASA ADS] [CrossRef] [Google Scholar]
- Moshir, M., Kopman, G., & Conrow, T. A. O. 1992, IRAS Faint Source Survey, Explanatory supplement version 2 [Google Scholar]
- Murakami, H., Baba, H., Barthel, P., et al. 2007, PASJ, 59, 369 [Google Scholar]
- Murphy, Jr., T. W.,Soifer, B. T., Matthews, K., & Armus, L. 2001, ApJ, 559, 201 [NASA ADS] [CrossRef] [Google Scholar]
- Neugebauer, G., Habing, H. J., van Duinen, R., et al. 1984, ApJ, 278, L1 [Google Scholar]
- Noeske, K. G., Faber, S. M., Weiner, B. J., et al. 2007a, ApJ, 660, L47 [NASA ADS] [CrossRef] [Google Scholar]
- Noeske, K. G., Weiner, B. J., Faber, S. M., et al. 2007b, ApJ, 660, L43 [Google Scholar]
- Owers, M. S., Blake, C., Couch, W. J., Pracy, M. B., & Bekki, K. 2007, MNRAS, 381, 494 [NASA ADS] [CrossRef] [Google Scholar]
- Park, C., & Choi, Y. 2005, ApJ, 635, L29 [NASA ADS] [CrossRef] [Google Scholar]
- Park, C., & Choi, Y. 2009, ApJ, 691, 1828 [NASA ADS] [CrossRef] [Google Scholar]
- Park, C., & Hwang, H. S. 2009, ApJ, 699, 1595 [NASA ADS] [CrossRef] [Google Scholar]
- Park, C., Choi, Y., Vogeley, M. S., Gott, J. R. I., & Blanton, M. R. 2007, ApJ, 658, 898 [NASA ADS] [CrossRef] [Google Scholar]
- Park, C., Gott, J. R. I., & Choi, Y. 2008, ApJ, 674, 784 [NASA ADS] [CrossRef] [Google Scholar]
- Patel, S. G., Holden, B. P., Kelson, D. D., Illingworth, G. D., & Franx, M. 2009, ApJ, 705, L67 [NASA ADS] [CrossRef] [Google Scholar]
- Peebles, P. J. E. 1993, Principles of physical cosmology, ed. P. J. E. Peebles [Google Scholar]
- Sanders, D. B., & Mirabel, I. F. 1996, ARA&A, 34, 749 [NASA ADS] [CrossRef] [Google Scholar]
- Shi, Y., Rieke, G. H., Papovich, C., Pérez-González, P. G., & Le Floc’h, E. 2006, ApJ, 645, 199 [NASA ADS] [CrossRef] [Google Scholar]
- Shi, Y., Rieke, G., Lotz, J., & Perez-Gonzalez, P. G. 2009, ApJ, 697, 1764 [NASA ADS] [CrossRef] [Google Scholar]
- Slinglend, K., Batuski, D., Miller, C., et al. 1998, ApJS, 115, 1 [NASA ADS] [CrossRef] [Google Scholar]
- Soifer, B. T., Helou, G., & Werner, M. 2008, ARA&A, 46, 201 [NASA ADS] [CrossRef] [Google Scholar]
- Stoughton, C., Lupton, R. H., Bernardi, M., et al. 2002, AJ, 123, 485 [NASA ADS] [CrossRef] [Google Scholar]
- Sutherland, W., & Saunders, W. 1992, MNRAS, 259, 413 [NASA ADS] [CrossRef] [Google Scholar]
- Tanaka, M., Goto, T., Okamura, S., Shimasaku, K., & Brinkmann, J. 2004, AJ, 128, 2677 [NASA ADS] [CrossRef] [Google Scholar]
- Tran, K., Papovich, C. J., Saintonge, A., et al. 2010, ApJ, 719, L126 [CrossRef] [Google Scholar]
- Tremonti, C. A., Heckman, T. M., Kauffmann, G., et al. 2004, ApJ, 613, 898 [NASA ADS] [CrossRef] [Google Scholar]
- Veilleux, S., Kim, D., Sanders, D. B., Mazzarella, J. M., & Soifer, B. T. 1995, ApJS, 98, 171 [NASA ADS] [CrossRef] [Google Scholar]
- Veilleux, S., Kim, D., & Sanders, D. B. 1999, ApJ, 522, 113 [NASA ADS] [CrossRef] [Google Scholar]
- Veilleux, S., Kim, D., & Sanders, D. B. 2002, ApJS, 143, 315 [NASA ADS] [CrossRef] [Google Scholar]
- Wang, J. L., Xia, X. Y., Mao, S., et al. 2006, ApJ, 649, 722 [NASA ADS] [CrossRef] [Google Scholar]
- Wang, L., & Rowan-Robinson, M. 2009, MNRAS, 398, 109 [NASA ADS] [CrossRef] [Google Scholar]
- Wang, L., & Rowan-Robinson, M. 2010, MNRAS, 401, 35 [NASA ADS] [CrossRef] [Google Scholar]
- Wegner, G., Colless, M., Baggley, G., et al. 1996, ApJS, 106, 1 [NASA ADS] [CrossRef] [Google Scholar]
- Wegner, G., Colless, M., Saglia, R. P., et al. 1999, MNRAS, 305, 259 [NASA ADS] [CrossRef] [Google Scholar]
- York, D. G., Adelman, J., Anderson, Jr., J. E., et al. 2000, AJ, 120, 1579 [Google Scholar]
- Yuan, T., Kewley, L. J., & Sanders, D. B. 2010, ApJ, 709, 884 [NASA ADS] [CrossRef] [Google Scholar]
- Zauderer, B. A., Veilleux, S., & Yee, H. K. C. 2007, ApJ, 659, 1096 [NASA ADS] [CrossRef] [Google Scholar]
All Figures
|
Fig. 1 Comparison of IR luminosities (LIR) computed from the IRAS 60 μm fluxes only (LIR(from 60 μm)) with those from the IRAS 60 and 100 μm (LIR(from 60100 μm)). We only show 30% of the total sample. |
| In the text | |
|
Fig. 2 a) Distribution of likelihood ratio (LR). b) Reliability of our cross-correlation vs. LR. Vertical dashed line represents the critical LR values (90%) of reliable identification for IRAS sources adopted in this study. |
| In the text | |
|
Fig. 3 Comparison of SFRs determined from LIR with those from LHα. We only plot galaxies whose spectral type is classified as star-forming (see Sect. 3.1). Filled circles in b) are median values of the ratios (SFRHα/SFRIR) at each bin, and the error bars indicate the dispersion of the ratios. |
| In the text | |
|
Fig. 4 a) IR luminosity, b) stellar mass, and c) absolute r-band magnitude vs. redshift. Red dots indicate IRGs (only 30% of IRGs are shown), and black dots denote galaxies without IR detection in the spectroscopic sample (only 1% of galaxies in the total sample are shown). Solid and dashed lines in c) define the volume limited samples, L1 and L2, respectively. The bottom curve corresponds to the apparent magnitude limit (mr = 17.77) for the main galaxy sample in SDSS. |
| In the text | |
|
Fig. 5 Physical parameters of IRGs as a function of LIR. a) Absolute magnitude Mr; b) (u − r) color; c) stellar mass Mstar; and d) velocity dispersion σ. Filled circles are median values of each bin, and error bars indicate the dispersion of the data; e) AGN fraction (Seyferts, LINERs and composite galaxies). We show only 30% of IRGs in the plot, but median values and AGN fraction are computed using the whole IRG sample. |
| In the text | |
|
Fig. 6 a) LIR of IRGs in L1 as a function of Σ5. Filled circles are median values at each density bin. b) Fraction of LIRGs plus ULIRGs among IRGs as a function of Σ5. c) Fraction of LIRGs plus ULIRGs among SF galaxies in L1 (SFRHα ≥ 1 or SFRIR ≥ 1 M⊙ yr-1). d) Fraction of LIRGs plus ULIRGs among all galaxies in L1. e) Fraction of SF galaxies among all galaxies in L1. |
| In the text | |
|
Fig. 7 a) Distributions of IRGs in L1 in the space of Mstar and Σ5. ULIRGs, LIRGs, MLIRGs, LLIRGs, and non-SF galaxies are plotted with star, circle, triangle, upside down triangle, and square, respectively. Non-SF galaxies are those with SFRHα = 0 and SFRIR = 0 (M⊙ yr-1). Error bars indicate the 1σ-dispersion of the distribution. Gray contour map is the number density of non-SF galaxies, and red dots are ULIRGs. b) f(U)LIRGs contours in the space of Mstar and Σ5. Dots are IRGs. |
| In the text | |
|
Fig. 8 a) LIR of IRGs in L2 as a function of Σ5. Filled circles are median values at each density bin. b) Fraction of LIRGs plus ULIRGs among IRGs as a function of Σ5 in L2. |
| In the text | |
|
Fig. 9 a) LIR of IRGs in L1 as a function of the clustercentric radius normalized to the cluster virial radius (R / r200,cl). Filled circle is the median value of each density bin. b) f(U)LIRGs vs. R / r200,cl. |
| In the text | |
|
Fig. 10 a) Distributions of IRGs in L1 in the space of the stellar mass and the clustercentric radius. Symbols are same as in Fig. 7. b) f(U)LIRGs contours in the space of the stellar mass and the clustercentric radius. Dots are IRGs. |
| In the text | |
|
Fig. 11 a) LIR of IRGs in L1 plus L2 ( − 20.41 ≥ Mr ≥ − 23.76) as a function of the projected distance to the nearest neighbor galaxy (Rn / rvir,nei). Red and blue dots are the galaxies having early- and late-type nearest neighbor galaxies, respectively. Circle (early-type neighbor case) and square (late-type neighbor case) are median values of each density bin. f(U)LIRGs vs. Rn / rvir,nb) for IRGs in L1 plus L2 ( − 20.41 ≥ Mr ≥ − 23.76) and c) for IRGs with − 21.20 ≥ Mr ≥ − 21.80 among L1 plus L2. |
| In the text | |
|
Fig. 12 Distributions of IRGs in L1 plus L2 in the space of the stellar mass and the distance to the nearest neighbor galaxy when the nearest galaxy is an early type a) and a late type b). Symbols are the same as in Fig. 7. Red dots are ULIRGs. |
| In the text | |
|
Fig. 13 f(U)LIRGs for IRGs in in L1 plus L2 in the space of Mstar and Rn / rvir,nei when the nearest galaxy is an early type a) and a late type b). Dots are IRGs. |
| In the text | |
|
Fig. 14 a) f(U)LIRGs for IRGs in L1 as a function of Σ5. Circle (early-type neighbor case) and square (late-type neighbor case) are median values of each density bin. Vertical dashed line indicates the Σ5 that roughly corresponds to one virial radius of the clustercentric radius (R ~ r200,cl) determined from the comparison between Σ5 and the distance to galaxy clusters in L1. b) Same as above, but for f(U)LIRGs vs. R / r200,cl. |
| In the text | |
|
Fig. 15 a) Stellar mass ratio between IRGs and their nearest neighbor galaxy, and b) projected distance to the nearest neighbor galaxy of IRGs (Rn / rvir,nei) as a function of LIR of IRGs in L1 plus L2. IRGs (Mr ≤ − 21) having late-type neighbors at Rn ≤ rvir,nei are shown. Large filled circles and vertical error bars represent the median values and their errors in LIR bins that are represented by horizontal error bars . The dashed horizontal line in a) divides IRGs into major (mass ratio < 4) and minor (mass ratio > 4) mergers. |
| In the text | |
|
Fig. 16 a) SFRs of IRGs in L1, b) stellar mass of IRGs, Mstar, and c) specific SFRs of IRGs as a function of Σ5. (d)–f)) Same as (a)–c)), but for the high-redshift IRGs (0.8 < z < 1.2) studied in Elbaz et al. (2007). Median value and its error at each bin is shown by a filled circle and its error bar. |
| In the text | |
|
Fig. 17 a) Average SFR computed using all galaxies in L1, ⟨ aSFR ⟩ , b) average SFR computed with IRGs, ⟨ SFR ⟩ , and c) the fraction of IRGs among all galaxies as a function of Σ5. (d)–f)) Same as (a)–c)), but for the high-redshift IRGs (0.8 < z < 1.2) studied in Elbaz et al. (2007). Median value and its error at each bin is shown by filled circle and its error bar. |
| In the text | |
Current usage metrics show cumulative count of Article Views (full-text article views including HTML views, PDF and ePub downloads, according to the available data) and Abstracts Views on Vision4Press platform.
Data correspond to usage on the plateform after 2015. The current usage metrics is available 48-96 hours after online publication and is updated daily on week days.
Initial download of the metrics may take a while.