Fig. 7
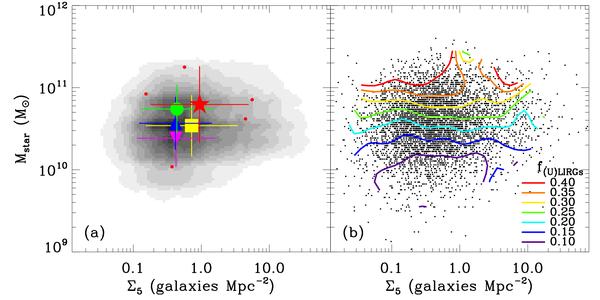
a) Distributions of IRGs in L1 in the space of Mstar and Σ5. ULIRGs, LIRGs, MLIRGs, LLIRGs, and non-SF galaxies are plotted with star, circle, triangle, upside down triangle, and square, respectively. Non-SF galaxies are those with SFRHα = 0 and SFRIR = 0 (M⊙ yr-1). Error bars indicate the 1σ-dispersion of the distribution. Gray contour map is the number density of non-SF galaxies, and red dots are ULIRGs. b) f(U)LIRGs contours in the space of Mstar and Σ5. Dots are IRGs.
Current usage metrics show cumulative count of Article Views (full-text article views including HTML views, PDF and ePub downloads, according to the available data) and Abstracts Views on Vision4Press platform.
Data correspond to usage on the plateform after 2015. The current usage metrics is available 48-96 hours after online publication and is updated daily on week days.
Initial download of the metrics may take a while.