Fig. 15
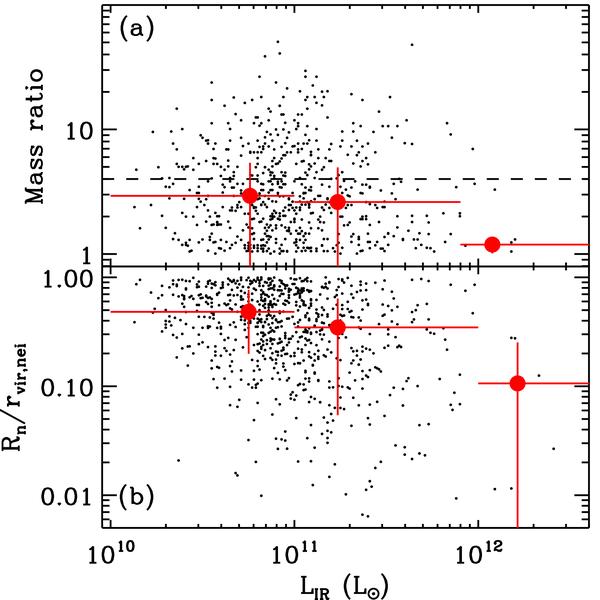
a) Stellar mass ratio between IRGs and their nearest neighbor galaxy, and b) projected distance to the nearest neighbor galaxy of IRGs (Rn / rvir,nei) as a function of LIR of IRGs in L1 plus L2. IRGs (Mr ≤ − 21) having late-type neighbors at Rn ≤ rvir,nei are shown. Large filled circles and vertical error bars represent the median values and their errors in LIR bins that are represented by horizontal error bars . The dashed horizontal line in a) divides IRGs into major (mass ratio < 4) and minor (mass ratio > 4) mergers.
Current usage metrics show cumulative count of Article Views (full-text article views including HTML views, PDF and ePub downloads, according to the available data) and Abstracts Views on Vision4Press platform.
Data correspond to usage on the plateform after 2015. The current usage metrics is available 48-96 hours after online publication and is updated daily on week days.
Initial download of the metrics may take a while.