Fig. 4
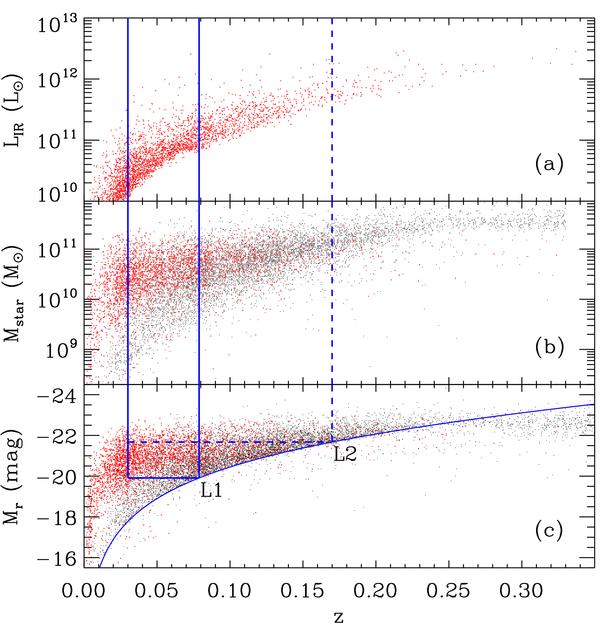
a) IR luminosity, b) stellar mass, and c) absolute r-band magnitude vs. redshift. Red dots indicate IRGs (only 30% of IRGs are shown), and black dots denote galaxies without IR detection in the spectroscopic sample (only 1% of galaxies in the total sample are shown). Solid and dashed lines in c) define the volume limited samples, L1 and L2, respectively. The bottom curve corresponds to the apparent magnitude limit (mr = 17.77) for the main galaxy sample in SDSS.
Current usage metrics show cumulative count of Article Views (full-text article views including HTML views, PDF and ePub downloads, according to the available data) and Abstracts Views on Vision4Press platform.
Data correspond to usage on the plateform after 2015. The current usage metrics is available 48-96 hours after online publication and is updated daily on week days.
Initial download of the metrics may take a while.