Free Access
Fig. 12
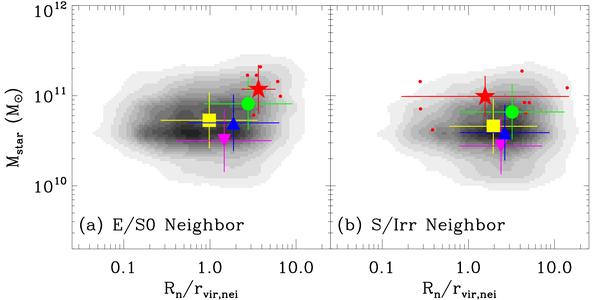
Distributions of IRGs in L1 plus L2 in the space of the stellar mass and the distance to the nearest neighbor galaxy when the nearest galaxy is an early type a) and a late type b). Symbols are the same as in Fig. 7. Red dots are ULIRGs.
Current usage metrics show cumulative count of Article Views (full-text article views including HTML views, PDF and ePub downloads, according to the available data) and Abstracts Views on Vision4Press platform.
Data correspond to usage on the plateform after 2015. The current usage metrics is available 48-96 hours after online publication and is updated daily on week days.
Initial download of the metrics may take a while.