


| Issue |
A&A
Volume 711, July 2026
|
|
|---|---|---|
| Article Number | A255 | |
| Number of page(s) | 22 | |
| Section | Interstellar and circumstellar matter | |
| DOI | https://doi.org/10.1051/0004-6361/202558778 | |
| Published online | 21 July 2026 | |
Chemistry and IR emission of acetylene in planet-forming regions of T Tauri disks
Impact of elemental abundances and dust properties
1
Université Paris-Saclay, CNRS, Institut d’Astrophysique Spatiale,
91405
Orsay,
France
2
Leiden Observatory, Leiden University,
2300
RA
Leiden,
The Netherlands
3
Max-Planck Institut für Extraterrestrische Physik (MPE),
Giessenbachstr. 1,
85748
Garching,
Germany
4
Kapteyn Astronomical Institute, Rijksuniversiteit Groningen,
Postbus 800,
9700AV
Groningen,
The Netherlands
★ Corresponding author: This email address is being protected from spambots. You need JavaScript enabled to view it.
Received:
23
December
2025
Accepted:
8
May
2026
Abstract
Context. JWST has revealed a broad diversity of spectra, pointing toward a wide range of physical or chemical conditions in the planet-forming regions of disks (<10 au) around T Tauri stars. In particular, acetylene (C2H2) is widely detected, but it remains unclear whether the spread in observed line flux is due to variation in the gas-phase C/O ratio or caused by other factors.
Aims. Our goal is to explore the parameters that influence the mid-infrared (MIR) emission of C2H2 and H2O, and if the spread observed in FC2H2/FH2O is tracing a variation in the C/O ratio.
Methods. Our work is based on the DALI 2D thermochemical model, which self-consistently computes the thermal and chemical structure of the disk, and predicts spectra readily comparable to JWST/MIRI observations. To robustly model organics in inner disks, several improvements have been made: (1) carbon chemistry adapted for warm environments, (2) updated UV shielding treatment, and (3) mutual line overlap in the ray-tracing.
Results. With the model improvements, we are able to reproduce the observed C2H2 fluxes of T Tauri disks with a realistic disk geometry and solar C/O ratio. Our models show that C2H2 is bright and detectable by JWST even with a solar C/O. Its abundance is primarily set by a balance between formation initiated by CO dissociation by X-rays and destruction of carbon chains by atomic oxygen, the latter being generated by X-ray-induced destruction of H2O and CO. The water UV shielding and hot temperatures (500–1000 K) of the inner disk also favor acetylene formation, as they prevent the destruction of carbon chains and allow the activation barriers of reactions with H2 to be overcome. C2H2 and H2O emissions are not only sensitive to the C/O ratio but also to the total O/H elemental abundance, supporting recent claims. In particular, we find that enhanced O/H reduces acetylene emission due to an excess of atomic oxygen. FC2H2/FH2O is thus a promising tracer of the elemental composition of inner disks. Still, the dust size distribution also plays a key role in this line flux ratio, reflecting the intrinsic link between the gas and dust components. We find that increasing the abundance of small grains relative to large grains favors C2H2 flux over H2O flux. Grain depletion does not affect the FC2H2/FH2O ratio as previously suggested by observational works. A preliminary comparison with published JWST observations indicates a gas-phase C/O ratio below unity and suggests that enhanced O/H ratios may be common in T Tauri disks.
Conclusions. Thermochemical models are essential for interpreting JWST spectra of inner disks, which ultimately provide information on the composition of exoplanet atmospheres. Yet, robustly estimating the C/O ratio through FC2H2/FH2O requires one to constrain dust properties from dust emission and better characterize the carbon chemistry.
Key words: astrochemistry / line: formation / planets and satellites: formation / protoplanetary disks
© The Authors 2026
 Open Access article, published by EDP Sciences, under the terms of the Creative Commons Attribution License (https://creativecommons.org/licenses/by/4.0), which permits unrestricted use, distribution, and reproduction in any medium, provided the original work is properly cited.
This article is published in open access under the Subscribe to Open model. This email address is being protected from spambots. You need JavaScript enabled to view it. to support open access publication.
1 Introduction
It has been nearly three decades since the first exoplanet was discovered (Mayor & Queloz 1995). The detection of thousands of such objects since then has revealed the remarkable diversity of planetary systems. In the next decade, this diversity will be scrutinized from a new vantage point: their atmospheric compositions thanks to cutting-edge space-borne and ground-based observatories (JWST, ELT, and ARIEL).
However, understanding the starting point of planet formation is essential to make the most of these future missions and link the properties of exoplanets to their formation history. Indeed, the atmospheric composition of gas giant planets can give valuable information on their formation history (Bitsch et al. 2015; Madhusudhan et al. 2016; Bitsch et al. 2022). The composition of gas and dust that is accreted by the planet is thought to vary spatially in the protoplanetary disk, following a hierarchical structure from the different sublimation temperatures of the volatile species in the gas (Öberg et al. 2011; Ligterink et al. 2024). The elemental composition of planet atmosphere, in particular the C/O ratio, may indicate when and where the planet forms by being directly linked to the composition of the disk at that location (Cridland et al. 2019; Öberg & Bergin 2021; Schneider & Bitsch 2021; O’Donovan & Bitsch 2026). Recently, other processes that shape the elemental composition of disks have emerged: the drift of icy pebbles from the outer disk that enriches the inner disk in oxygen (Banzatti et al. 2020; Kalyaan et al. 2021; Banzatti et al. 2023; Kalyaan et al. 2023; Sellek & van Dishoeck 2025; Houge et al. 2025b; Williams et al. 2025) and sublimation or chemisputtering of carbon grains that would enrich the gaseous disk in carbon (Booth et al. 2017; Lenzuni et al. 1995; Borderies et al. 2025; Houge et al. 2025a). All of these processes will thus have a significant impact on the elemental C/O ratio, ranging from subsolar (<0.5) to super-solar (>0.5) or even C/O > 1.
These scenarios have been confronted by new observations taken by ALMA, revealing that evolved disks harbor ubiquitous substructures, showing that the radial distribution of species is far from smooth (ALMA Partnership 2015; Andrews 2020; Öberg et al. 2021; Booth et al. 2024). Indeed, pressure bumps can block the pebbles that drift inward, preventing the supply of oxygen in the inner disk (Zhu et al. 2012; Pinilla et al. 2012; Banzatti et al. 2025; Gasman et al. 2025; Temmink et al. 2025), which therefore challenges the scenarios mentioned above. However, recent theoretical works suggest that these gaps might be leaky, in particular to submicron-sized grains (Weber et al. 2018; Drążkowska et al. 2019; Stammler et al. 2023), in line with recent observations combining ALMA and James Webb Space Telescope (JWST) data (Gasman et al. 2025). Regarding the gas content of outer disks (r > 10 au), ALMA observations show that they are surprisingly faint in CO, which is interpreted as a chemical conversion of CO into less volatile species, resulting in C/O>1 (Miotello et al. 2017; Bergin et al. 2016; Bosman et al. 2018; Miotello et al. 2019), as well as locking up CO ice in larger bodies (Krijt et al. 2020). Together with thermochemical models, CO and C2H proved to be good tracers of the C/O ratio in the outer disk by being widely detected (Bosman et al. 2021; Sturm et al. 2022).
Inner disks (r < 1–5 au) have been less studied, but Spitzer along with ground-based instruments (CRIRES, iSHELL, and TEXES) gave interesting first results in the mid-infrared (MIR). Unlike outer disks, inner disks of T Tauri stars are oxygen-rich, with bright H2O and OH emissions (Salyk et al. 2008; Carr & Najita 2008), revealing a potentially low C/O. Regarding the main C, O, and N carriers, HCN, C2H2, and CO2 (and CO) have also been widely detected (Pontoppidan et al. 2010; Carr & Najita 2011). JWST is now revolutionizing the field with increased sensitivity and spectral resolution, allowing us to detect new species and isotopologs, and thus better constrain inner disks conditions. Slab models indicate that IR emission from 5 to 27 μm is emitted from hot, upper layers at T ~ 300–800 K, with column densities typically of around N ~ 106–1019 cm−2 (Salyk et al. 2011; Kamp et al. 2023; van Dishoeck et al. 2023; Grant et al. 2023).
Interestingly, even if T Tauri disks are dominated by water emission, C2H2 is systematically detected with a detection rate of 90% (Arulanantham et al. 2025; Grant et al. 2025), suggesting that this molecule might have a special place among hydrocarbons. Moreover, JWST observations of very low-mass stars (VLMSs) show a very rich carbon chemistry, with new detections of C4H2, C6H6, C3H4, and CH4, and very little water (Tabone et al. 2023; Arabhavi et al. 2024; Kanwar et al. 2024a; Arabhavi et al. 2025). In particular, C2H2 is the most prominent feature with a pseudo-continuum reaching N ~ 1022 cm−2, reinforcing the fact that C2H2 is central in carbon chemistry. These results suggest that, as opposed to T Tauri stars, VLMSs might have a high C/O ratio (Kanwar et al. 2026).
Nevertheless, Grant et al. (2025) found that the emissions of C2H2 and H2O vary by 2 orders of magnitude among T Tauri disks, showing that the chemistry in inner disks is not entirely dictated by the mass of the central star. This spread possibly traces the diversity of C/O ratio in the inner disk, with C2H2 tracing the carbon and H2O the oxygen. We now need thermochemical models to better understand the physical and chemical processes at stake in these regions.
Previous works on thermochemical models show that MIR emission comes from the surface of the disk atmosphere, but the layer depends on the species, with CO and OH at the very top, then H2O and CO2, and C2H2 and HCN deeper down (Woitke et al. 2018). However, numerous studies have shown that MIR molecular emission depends on the atmospheric conditions of the disk, including dust properties. Meijerink et al. (2009) and Glassgold et al. (2009) revealed that water emission can be significantly increased by depleting grains in the atmosphere or by flattening the dust size distribution. Antonellini et al. (2015) confirmed that dust opacity sets the water emission, expanding the dependency to the UV field and the disk geometry. More recently, Antonellini et al. (2023) have claimed that the trend of HCN/H2O with dust disk mass seen in Najita et al. (2013) can be explained by dust evolution, following the prescription of Greenwood et al. (2019a) that includes dust settling, growth, and radial drift, resulting in the gas-to-dust ratio and grain sizes increasing over time.
Results concerning organic molecules, especially acetylene, are still debated, probably due to the organic chemistry being much more complex than the oxygen chemistry. Agúndez et al. (2008) predicted that the steady-state abundance of C2H2 and organic molecules should be higher in X-ray dominated regions, but they should decrease with more X-ray irradiation, later confirmed by Najita et al. (2011). In contrast, Woitke et al. (2024) predicted the opposite and Greenwood et al. (2019b) found no dependence of C2H2 on X-rays. However, most of these studies significantly underproduced acetylene (Najita et al. 2011; Woitke et al. 2018; Greenwood et al. 2019b). Kanwar et al. (2024b) extended the ProDiMo chemical network DIANA (Kamp et al. 2017) to include hydrocarbons until eight atoms of carbon, but it did not increase the emission of C2H2. Woitke et al. (2024) solved the underproduction of acetylene by adopting a smooth inner rim, which enables the formation of acetylene above the optically thick dust layer in a very hot region. The column densities derived by Walsh et al. (2015) and Anderson et al. (2021) were consistent with Spitzer, but no detailed radiative transfer was performed. Nevertheless, they agree that the emission of water and acetylene are sensitive to the elemental abundances, and that the C/O ratio is a driver of the brightness of hydrocarbons. The line flux ratios HCN/H2O and C2H2/H2O were proposed to be promising tracers of the C/O ratio, allowing us to constrain the chemical composition of inner disks (Najita et al. 2011; Anderson et al. 2021). Using the same model as Woitke et al. (2024), Arabhavi et al. (2026) also did the synthetic prediction of the elemental abundances with detailed radiative transfer, but did not include water UV shielding. Indeed, Bosman et al. (2022a) and Duval et al. (2022) recently showed that water can efficiently shield the molecular layers by absorbing UV photons that photodissociate molecules. This process significantly boosts the abundance of organic molecules, which means that models do not require a high C/O ratio to produce abundant C2H2.
In this paper we explore the formation of C2H2 and the physical processes that can enhance its emission to match the observations, including water UV shielding. We also self-consistently predict IR emission of water and acetylene to better understand the diversity of JWST spectra of T Tauri disks and put first constraints on elemental abundances.
This paper is organized as follows. Section 2 details the thermochemical model DALI, with several improvements for the study of inner regions of protoplanetary disks. Section 3 first presents the results of a fiducial model to highlight the processes shaping the water and acetylene emission, and then describes the results of a grid of models covering elemental abundances, dust properties, and disk geometry. A detailed discussion of different modeling considerations as well as a comparison with observations is proposed in Sect. 4. The main results are summarized in Sect. 5.
2 Model
This section describes the DALI model, with a focus on the processes added to the code to better model inner disks. The setup and parameters explored in this work are then summarized.
2.1 DALI model
This work is based on the 2D thermo-chemical model DALI (Bruderer et al. 2012; Bruderer 2013; Bruderer et al. 2015) to self-consistently compute H2O and C2H2 emission. The code is divided in several steps. After creating a grid with the input dust and gas density structure, the first step computes the dust temperature and the dust mean intensity for each cell using a 2D Monte Carlo method. Then, the thermo-chemistry module computes iteratively the abundance of each species from a given chemical network (see Sect. 2.2.2), the atomic and molecular excitation, and the thermal balance of the gas to get a self-consistent gas temperature, Tgas, and chemical abundances. This specific step has been recently improved by including the UV shielding from molecules, especially H2O (Bosman et al. 2022a), which has a prominent impact on molecular layers of inner disks. In this work, we further improved this step by including an extended chemical network (see Sect. 2.2.2) and a refined treatment of the UV shielding (see Sect. 2.2.1). The last step of DALI builds synthetic spectra from the radiative transfer equation. Since we want to reconstruct IR spectra including thousands of lines, we use an improved fast ray-tracer (Bosman et al. 2017), based on the fact that the velocity gradient along the line of sight is approximately linear (Horne & Marsh 1986). We upgraded it by including so-called line overlap, an effect that can efficiently reduce the optically thick emission of molecules, particularly C2H2 (see Tabone et al. 2023).
2.2 Improvements in DALI
2.2.1 UV shielding
Atoms or molecules absorb the UV field irradiated from the star. This absorption changes the spectral shape of the radiation field and reduces its strength. As a result, a species not only protects itself by reducing its photodissociation rate (self-shielding), but also protects the other species (mutual shielding). To properly treat UV shielding, the absorption of the radiation field by all species at all wavelengths should be computed. However, cross sections, which describe the interaction of atoms and molecules with the radiative field, exhibit steep variations with very narrow features. This would require a very fine wavelength grid to sample cross sections, which is computationally prohibitive.
To reduce the computational time, we evaluate the rates of photoprocesses by using the “computational efficiency” format of the Leiden Database1 (see Appendix A for technical details). This format splits each cross section into two parts: narrow features (called “lines”; Δλ < 1 nm) and smooth variations (called the “continuum”). With this approach, we can compute photodissociation rates with a limited wavelength grid of ~100 points, because the “lines” are integrated thanks to their respective oscillator strength. The lines are particularly efficient to self-shield because the peaks can be very high (around σpeak ~ 10−16–10−15 cm2) meaning that a column density of N = 1015 cm−2 is sufficient to shield the gas (reached relatively easily in inner regions of protoplanetary disks for molecules such as CO, H2, and N2). However, since the lines are very narrow, the impact on the radiation field is limited. Thus, we only consider these lines for the self-shielding. In contrast, the continuum part of the cross section affects a broad wavelength range, which allows the species not only to self-shield but also to protect other molecules. Water is a good example of efficient mutual shielding (Bethell & Bergin 2009; Ádámkovics et al. 2014; Duval et al. 2022). We note that high column densities are required for mutual shielding (N ~ 1018–1019 cm−2), so this process is only relevant for abundant molecules in protoplanetary disks.
In the previous version of DALI, self-shielding was taken into account for well-known molecules (H2, C, N2, CO, and isotopologs; Miotello et al. 2014; Visser et al. 2018), and the mutual shielding is usually considered for water, although the user can choose which molecules can play a role in the attenuation of the UV flux. Our new implementation of the UV shielding extends the self-shielding to all species in the chemical network. In case the UV cross section is not available for a species, we arbitrarily choose the cross section of c − C3H2 for the photoreactions of this species (except for C4H2 for which we take C4H cross section). This cross section should more accurately reflect the typical photodissociation rate of hydrocarbons than that of water, chosen in Bosman et al. (2018)2. The calculation of the photorates in DALI relies on cross-section data from the Leiden Database (Heays et al. 2017; Hrodmarsson & van Dishoeck 2023). We added other abundant molecules in the mutual shielding, for a total of 12 species: S, Fe, H2O, OH, CO2, HCN, CN, C2H2, C3, C2H4, CH4, and C2H6. We find that H2O is the dominant species to mutual shield with a C/O < 1 (see Sect. 3.1.2). For C/O > 1, C3 takes over the role of UV attenuation, followed to a lesser extent by C2H2, since they are both abundant and have a relatively broad UV cross section. We do not expect other molecules (for which a cross section is available) to be abundant enough to play a significant role in mutual shielding. The mutual shielding efficiency of 6 over these 12 species are shown in Appendix A.2.
2.2.2 Chemical networks
The original chemical network of Bruderer et al. (2012) was first extended to include CO isotopolog chemistry (Miotello et al. 2014), and then refined to add key molecules in the chemistry of protoplanetary disks, such as HCN or C2H (Visser et al. 2018; Miotello et al. 2019). However, the simple hydrocarbon chemistry in Miotello et al. (2019) stopped at C2H3, and was tailored for outer regions of disks. Bosman et al. (2022a) built a network for inner regions, based on the RATE12 network of UMIST (McElroy et al. 2013) and added three-body reactions from Walsh et al. (2015). This very large network (674 species and 9441 reactions) extends the carbon chemistry and has already been used for the study of hydrocarbons and organic molecules in the inner disk (Duval et al. 2022; Colmenares et al. 2024). Nevertheless, this network does not particularly focus on carbon chemistry, and significantly slows down the code. The aim of this new network is twofold: have an accurate description of the carbon chemistry while having a simple network to avoid run-time issues3. For its construction, we start from the network of Miotello et al. (2019) and we add new species and reactions. We mainly focus on gas-phase reactions, since the emitting layers in inner disks are warm, typically Tgas ~ 300–800 K (Gasman et al. 2023; Grant et al. 2023; Temmink et al. 2024; Schwarz et al. 2024). This new chemical network includes 223 species and 3523 reactions, with 89 new species and 1653 new reactions. The construction follows three steps:
Select the pure hydrocarbons (CxHy) with five atoms of carbon maximum.
Add gas-phase reactions between these new hydrocarbons and any other species already in the network, following the types of reactions in DALI detailed in Bruderer et al. (2012). Photoreactions are included, with the updated UV cross sections from Hrodmarsson & van Dishoeck (2023) as well as the X-ray and cosmic ray induced reactions. We also add the channel of X-ray/cosmic ray induced photodissociation of H2O leading to O which was missing in the network from Miotello et al. (2019) and in the UMIST database.
Add charge exchange with polycyclic aromatic hydrocarbons following the prescription of Wolfire et al. (2003) as done in Bruderer et al. (2012).
Add adsorption and desorption for new neutral species. The binding energies are adopted from McElroy et al. (2013) and Bosman et al. (2022a). When the energy is not available, we take that of the corresponding isomer. If there is no isomer, we assume a desorption energy of 3000 K (only for C5H5 and C5H6).
Add three-body reactions from Bosman et al. (2022a), exported from the network of Walsh et al. (2015).
We identified several missing reactions in UMIST (RATE22 release Millar et al. 2024) compared to the KIDA database, especially reactions with high activation barriers. Many abstractions of H are missing, in particular, the key reaction with C2:
![Mathematical equation: $\[\mathrm{C}_2+\mathrm{H}_2 \rightarrow \mathrm{C}_2 \mathrm{H}+\mathrm{H}, \quad E_a=1420 \mathrm{~K}.\]$](/articles/aa/full_html/2026/07/aa58778-25/aa58778-25-eq1.png) (1)
(1)
UMIST is tailored for cold interstellar medium (ISM) conditions, typically 10–100 K, so reactions with activation barriers of the order of 1000 K or more, are not likely to happen in dense molecular clouds. However, these reactions may have a prominent impact on the chemistry in inner regions of protoplanetary disks, with the example of water formation with Ea = 3150 K.
To include the reactions with high activation barriers, we combined UMIST (Millar et al. 2024) with reactions in the KIDA Database (Wakelam et al. 2024)4. This KIDA exportation and “cleaning” is essentially composed of the cold ISM network from Wakelam et al. (2024, kida.uva.2024) and extra reactions from planetology, mainly from the work of Hébrard et al. (2009) who modeled the atmospheric chemistry of Titan. The online KIDA database also contains several interesting hydrocarbon reactions from the high-temperature network of Harada et al. (2010). In addition, we included the revised endothermicities calculated by Tinacci et al. (2023). We removed all reactions with ΔH > 100 kJ mol−1 (~12 000 K). Because of the large uncertainties of the calculated enthalpies (1200 K), we amended a reaction rate only when the reaction was endothermic by more than 1200 K and we adopted an activation energy equal to the enthalpy change at T = 0 K. Following this procedure, only seven reactions were corrected (see Appendix B.3), including the key reaction C3+H2. Finally, we added this KIDA network to our network by following exactly the same procedure mentioned above for UMIST.
Additionally, we included the reaction C + H2O → HCO + H as it can be crucial for the total carbon reservoir for hydrocarbons, but not referenced in UMIST. Woitke et al. (2024) noted that this reaction is included in the online KIDA database with an unreasonable high rate, inconsistent with the upper limit in NIST (Husain & Kirsch 1971) and the low temperature measurements of Hickson et al. (2016). Further details on the chosen rate are provided in Appendix B.5. This reaction reduces the acetylene emission by ~30%.
We do not include grain surface reactions in the network, meaning that the ices are only formed via thermal adsorption, and destroyed via thermal and photo-desorption. IR active layers from which H2O and C2H2 emit, are expected to be at temperatures above 300 K, so the ices do not play a major role in our study. This chemical network is therefore not suitable for studying cold regions, particularly near the midplane where ices are abundant, and surface reactions important. Finally, we do not consider the UV photolysis of carbon grains (Alata et al. 2014).
2.2.3 Line overlap
Gas-phase molecular emission lines are usually spectrally narrow. The line overlap is therefore marginal between species and even in Q branches where thousands of lines are clustered together. However, once the lines start to be highly optically thick, they broaden and can “screen” each other significantly. In planet-forming regions, column densities of abundant species can reach N ≥ 1020 cm−2, producing a forest of optically thick lines. As a result, neglecting line overlap can strongly overestimate the fluxes, especially in Q branches of species such as C2H2 (Tabone et al. 2023). To better predict acetylene emission, we update the fast ray-tracer implemented in Bosman et al. (2017) to include line overlap. It reduces the Q-branch emission of C2H2 by a factor of 1.5 for a model with a solar C/O ratio (shown in Appendix C).
2.3 Model setup
The input parameters used in this work are listed in Table 1. The 2D density structure follows a viscous accretion disk ansatz given by (Lynden-Bell & Pringle 1974)
![Mathematical equation: $\[\Sigma_{gas}(R)=\frac{M_D}{2 \pi R_C^2}(2-\gamma)\left(\frac{R}{R_C}\right)^{-\gamma} \exp \left[-\left(\frac{R}{R_C}\right)^{2-\gamma}\right],\]$](/articles/aa/full_html/2026/07/aa58778-25/aa58778-25-eq2.png) (2)
(2)
with a characteristic disk radius of RC = 46 au, a surface density index of γ = 1.0, and a disk mass of MD = 0.03 M⊙. The vertical distribution follows an isothermal profile:
![Mathematical equation: $\[\rho_{g a s}(R, \theta)=\frac{\Sigma_{g a s}(R)}{\sqrt{2 \pi} R h(R)} \exp \left[-\frac{1}{2}\left(\frac{\pi / 2-\theta}{h(R)}\right)^2\right],\]$](/articles/aa/full_html/2026/07/aa58778-25/aa58778-25-eq3.png) (3)
(3)
where the disk aspect ratio is given by ![Mathematical equation: $\[h(R)=h_{c}\left(\frac{R}{R_{C}}\right)^{\psi}\]$](/articles/aa/full_html/2026/07/aa58778-25/aa58778-25-eq4.png) . For the fiducial model, we adopt hc = 0.09 (disk aspect ratio at RC) and a flaring angle of ψ = 0.155. This setup does not include a smooth inner rim, which could increase molecular emission, as shown in the case of EX Lupi by Woitke et al. (2024).
. For the fiducial model, we adopt hc = 0.09 (disk aspect ratio at RC) and a flaring angle of ψ = 0.155. This setup does not include a smooth inner rim, which could increase molecular emission, as shown in the case of EX Lupi by Woitke et al. (2024).
For this work, we used the DALI module developed by Facchini et al. (2017) to self-consistently compute the size-dependent dust settling, following Riols & Lesur (2018) and assuming a mixing parameter α = 10−3. This corresponds to the prescription used by Woitke et al. (2024), which includes the vertical dependence of the Stokes number with the gas density. For our fiducial model, the maximum grain size is amax = 1 mm, set by fragmentation (Birnstiel et al. 2011), which is the typical regime in inner disks (Birnstiel et al. 2012; Birnstiel et al. 2015). The minimum grain size was set to amin = 5 nm, consistent with Facchini et al. (2017). Before settling, we considered an MRN dust-size distribution (Mathis et al. 1977) with a power-law index q = 3.5 (f(a) ∝ a−q), consistent with the fragmentation-limited regime (Birnstiel 2024). Finally, a fiducial global gas-to-dust ratio was set to 1000, which is the typical gas-to-dust ratio achieved after 2–3 Myr in the inner disk (Bitsch & Mah 2023). This gas-to-dust ratio is vertically averaged. Our models do not include the vertical mixing of species, although it could change the IR emission of molecules by a factor of up to 3 (Woitke et al. 2022).
The fiducial abundances are adopted from Bruderer et al. (2012, our Table B.1) and are consistent with those of Bruderer (2013) and Bosman et al. (2022b). They correspond to the volatile ISM abundances based on Jonkheid et al. (2006). The C/O ratio in the fiducial model is C/O = 0.47. Hereafter, we refer to this value as the “solar C/O” throughout the remainder of the paper, rather than “volatile ISM C/O.” The abundances are obtained by the time-dependent solver LIMEX (Ehrig et al. 1999) with an end-time of 3 Myr, which is enough to reach steady-state abundances for oxygen and carbon chemistry (Agúndez et al. 2008; Kamp et al. 2017; Kanwar et al. 2025).
Regarding the radiation field, the disk orbits a T Tauri star with an effective temperature of Teff = 4250 K, a photospheric luminosity of L* = 1 L⊙, and a mass of M* = 1 M⊙. The shape of the far-ultraviolet (FUV) excess corresponds to a blackbody at T = 20 000 K following the prescription of Tabone et al. (2024). We include a Lyman-α line with a full width at half maximum (FWHM) of 200 km.s−1 and a total luminosity of 0.15 Lacc (Tabone et al. 2024), which contributes to ~80% of the FUV luminosity (Schindhelm et al. 2012; France et al. 2014). We neglect the scattering by H atoms. The X-ray spectrum is given by a blackbody at TX = 4.6 × 10⁷ K between 103 and 105 eV with a luminosity of LX = 1030 erg s−1.
Throughout this work, the excitation of H2O was performed in nonlocal thermal equilibrium (non-LTE; Faure & Josselin 2008), whereas the population levels of C2H2 was calculated in LTE (due to a lack of collisional rate coefficients). According to Bruderer et al. (2015), the excitation of HCN and C2H2 should be similar. We observe a minor difference (~25% reduction) in our models between LTE and non-LTE calculations for HCN thanks to infrared pumping (Bruderer et al. 2015), so non-LTE effects should not dramatically change acetylene emission.
Input parameters in DALI.
2.4 Model grid
Throughout this work, we explore a set of input parameters to highlight the possible drivers of the acetylene emission in T Tauri disks, and its relationship with water emission. These parameters are listed in bold in Table 1. Regarding the elemental abundances, we vary the C/O ratio between 0.2 and 1.5, by keeping O/H constant and varying C/H accordingly. We also run models with 10 times more and less oxygen than the ISM to quantify the impact of an oxygen enrichment due to the drift of icy pebbles and depletion due to advection of water vapor onto the star, respectively. As with the standard grid, we vary the C/O ratio by varying C/H and keeping O/H constant. These models will be termed “enhanced O/H” and “depleted O/H” hereafter. For the disk structure, we changed the disk aspect ratio from 0.05 to 0.25. The flaring angle varies from 0.05 to 0.20, but we adapted the disk aspect ratio, hc, at RC = 46 au to keep the same disk aspect ratio of the other models at 0.5 au. By doing so, we could better isolate the effect of the flaring angle in the inner disk.
Regarding the properties of the dust, we consider a range of gas-to-dust mass ratios, ranging from 102 to 104. The dust size distribution is known to vary in protoplanetary disks due to vertical settling, radial drift, growth and fragmentation (Weidenschilling 1977; Brauer et al. 2008; Zsom et al. 2010; Birnstiel 2024). The minimum grain size in the inner disk is not well constrained, so we explore a large range, from 5 nm to 100 nm. This range is consistent with observation in scattered light, showing that submicron-sized grains are present in the atmosphere of outer disks, with an upper limit of amin < 400 nm (Tazaki & Dominik 2022). The large uncertainty on the fragmentation velocity (vfrag~1–10 m s−1 Blum & Wurm 2008; Güttler et al. 2010; Birnstiel et al. 2012) leads to a variation in amax of a factor of 100, which is covered in this work. We also explore the impact of a different dust size distribution, since dust size distributions limited by radial drift tend to be top-heavy (Birnstiel et al. 2015; Birnstiel 2024), and spectral energy distribution fitting typically retrieved power-law indexes between 3 and 4 (Ribas et al. 2020; Kaeufer et al. 2023).
Finally, we explore a range of X-ray luminosity since its impact on the emission of C2H2 is still debated in the literature (Najita et al. 2011; Greenwood et al. 2019b; Notsu et al. 2021; Woitke et al. 2024). This grid does not cover the effect of varying the inner disk radius since we focus only on full disks, but it could also change molecular emission as shown in Vlasblom et al. (2024).
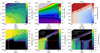 |
Fig. 1 Disk structure of the fiducial model. Top panels: gas density, local gas-to-dust ratio, and gas temperature. Bottom panels: normalized UV field G0 (Habing units) and the abundance of H2O and C2H2. The white lines indicate the 300 K and 700 K gas temperature contours. The bottom solid red line shows the dust optically thick surface (τdust = 1 at 14 μm), while the dashed red line represents the surface where τline = 1. The red contours correspond to 80% of the total emitting flux. The dashed orange line in the bottom panels indicate the H/H2 transition, which is sometimes difficult to distinguish from the dashed black line, G0 = 105. |
3 Results
This section first describes the results obtained by the fiducial model (see Table 1) and explains the key processes setting the abundance of acetylene. Then, the results of the model grid are analyzed.
3.1 Fiducial model
3.1.1 Abundances and synthetic spectrum
The results of our fiducial model (C/O = 0.47, gd = 103, O/H = 2.88 × 10⁻⁴) are presented in Fig. 1. Figure 1a shows the gas density structure, while Fig. 1b reveals that the dust structure is significantly different, with a strong depletion above z/r = 0.15 due to the dust settling. Figure 1e shows that water is very abundant in the inner disk, in both the shielded regions inside of r ≃ 0.6 au and in the warm upper atmosphere extending to large radii. The formation of water is indeed greatly enhanced at high temperature to overcome the barrier to form OH (van Dishoeck et al. 2013). Water emits in this warm (300 K < Tgas < 700 K), upper atmosphere (z/r > 0.15) indicated by the red contours, which represent 80% of the emission of H2O (water line 125–8–112–9, Eu = 3273 K, A = 3.84 s−1, and λ = 17.10 μm). According to Fig. 1b, dust is significantly depleted where water emits, with a gas-to-dust ratio gd ~ 5 × 10⁴. The normalized FUV flux G0 (Fig. 1d) highlights the important role of H2O in the absorption of the UV flux in inner disks. Indeed, the water distribution perfectly matches the structure of the UV field in the inner disk: when water becomes abundant, G0 drops by orders of magnitude in a couple of cells (see Figs. 1d and 3). It allows more complex, organic molecules such as acetylene to form underneath (Fig. 1f and Sect. 3.1.2).
Figure 1f shows that C2H2 is present three reservoirs: the inner disk (r < 1 au), the upper layer of the outer disk (r > 1 au, z/r>0.20), and near the midplane in the outer disk (r > 1 au, z/r<0.10), consistent with other thermochemical models (Kanwar et al. 2024b). Interestingly, even though C/O = 0.47, acetylene is particularly abundant in the first reservoir (inner disk), which will be the main focus of this paper since the IR emission seen by JWST originates from this region. Indeed, the red contours indicate that 70% of the emission of C2H2 (line with Eu = 2678 K, A = 5.527 s−1 and λ = 13.6872 μm) is concentrated in the innermost regions of the disk, where 450 K < Tgas < 1000 K, and nH ~ 1013–1014 cm−3. These temperatures are in the typical range derived from slab model fits of the JWST spectra of T Tauri disks6 (Gasman et al. 2023; Grant et al. 2023; Vlasblom et al. 2025; van Dishoeck et al. 2023; Arulanantham et al. 2025). The emitting region of C2H2 is therefore slightly lower and closer to the star than water for lines with similar Eu, in between the UV shielded region by water and the optically thick IR layer of the dust. As acetylene emits deeper than water, the dust is less depleted where acetylene emits (gd ~ 9 × 10³) than where water emits. The H/H2 transition perfectly matches the layer where C2H2 becomes abundant, showing the crucial role of warm H2 in its formation (see Sect. 3.1.2).
The synthetic spectrum of the fiducial model is presented in Fig. 2 between 10 and 20 μm. The continuum is typical for a T Tauri disk, with the silicate bump at 10 μm. The forest of blue lines corresponds to the water rotational lines, which is expected since the emitting region in Fig. 1e is much higher than the dust continuum (surface τdust(17.10 μm) = 1). Moreover, the Q-branch feature of acetylene at 13.7 μm clearly stands out, reflecting the high abundance of acetylene seen in Fig. 1f, even though the fiducial model has a solar C/O. This is consistent with Spitzer and JWST observations of T Tauri disks, systematically detecting H2O and C2H2 (Carr & Najita 2008, 2011; Grant et al. 2025) but in contrast with the very weak emission predicted by modeling works that neglect water UV shielding (Greenwood et al. 2019a; Kanwar et al. 2024b).
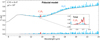 |
Fig. 2 DALI synthetic spectrum of C2H2 (red) and H2O (blue) for the fiducial model. The total spectrum is shown in black. The spectral resolution is λ/Δλ = 2000 to mimic a JWST/MIRI spectrum. Although the fiducial model is richer in oxygen, the C2H2 feature stands out clearly from the forest of water lines. |
3.1.2 What sets the abundance of carbon chains?
The oxygen chemistry and, in particular, the formation and destruction pathways of H2O have already been largely studied and understood, the main result being that water is abundant in hot, irradiated layers (Glassgold et al. 2009; Woitke et al. 2009; van Dishoeck et al. 2013; Walsh et al. 2015, T > 300 K). On the other hand, the carbon chemistry is much more complex and is not yet fully understood, with it being unclear why C2H2 is so bright in T Tauri disks with a solar C/O. This section focuses on carbon chemistry to address this question.
The formation of hydrocarbons starts from C or C+. The first molecule to form is carbon monoxide, CO, from C+ and O (Fig. 3). However, with a solar C/O, there is more oxygen than carbon, so CO locks up almost all the gas-phase carbon. The oxygen left is available to form H2O. As has been mentioned in previous studies discussing the formation of organic molecules, the “free” carbon available to form hydrocarbons is released by the dissociation of CO by UV or X-rays (Bast et al. 2013; Walsh et al. 2015; Woitke et al. 2024; Kanwar et al. 2024b). However, our models include the water UV shielding which suppresses the penetration of UV photons in the layer where organic molecules are abundant. This layer is actually X-ray active according to Fig. 3. Therefore, the main production of carbon comes from the indirect dissociation of CO by X-rays, either by secondary ionization or reaction with He+:
![Mathematical equation: $\[\mathrm{CO}+\gamma_{\mathrm{FUV}, ~\text { secondary }} \rightarrow \mathrm{C}+\mathrm{O},\]$](/articles/aa/full_html/2026/07/aa58778-25/aa58778-25-eq5.png) (4)
(4)
![Mathematical equation: $\[\mathrm{CO}+\mathrm{He}^{+} \rightarrow \mathrm{C}^{+}+\mathrm{O}+\mathrm{He}.\]$](/articles/aa/full_html/2026/07/aa58778-25/aa58778-25-eq6.png) (5)
(5)
Then, from this carbon released, carbon chains are built mainly from the addition of C (or C+) and H2, and dissociative recombinations with electrons (Bast et al. 2013; Kanwar et al. 2024b). The H-abstraction reactions often involve large activation barriers, so hydrocarbon formation is favored at high temperatures and in regions where H2 is abundant. This explains why C2H2 is particularly abundant in the inner disk, just below the H/H2 transition, which is deeper than the C/CO transition (Fig. 3) because the warm chemistry consumes H2 to form OH. However, X-ray induced photodissociation of CO and H2O also releases oxygen. The latter plays an important role in the carbon chemistry by destroying carbon chains to form back CO. This channel of destruction has been overlooked so far in the literature, although Bast et al. (2013) mentioned that OH can impede the formation of carbon chains at low temperatures by the reaction C + OH → CO + H. Therefore, the abundance of carbon chains and especially C2H2 is set by a balance between formation with the carbon released by CO dissociation, and destruction by the oxygen. This balance reveals that C2H2 is not expected to be sensitive to a variation in the X-ray luminosity since X-rays are involved in both its formation and destruction (confirmed by Fig. E.1, with only an increase of a factor of 3 for 6 orders of magnitude in LX). It is also crucial not to miss any reactions involving H2 or O or it will skew the estimation of carbon chain abundances.
Finally, Bosman et al. (2022a,b) and Duval et al. (2022) strikingly showed that water UV shielding significantly enhances the abundance of organic molecules. The vertical cut at r = 0.15 au (Fig. 3) confirms that C2H2 is abundant when the water UV shielding becomes effective (represented as ![Mathematical equation: $\[G_{0}^{\mathrm{H}_{2} 0 ~\mathrm{shield}}\]$](/articles/aa/full_html/2026/07/aa58778-25/aa58778-25-eq8.png) ). In this layer, water attenuates the UV field by seven orders of magnitude, which suppresses the photodissociation by the UV field for species with photodissociation threshold at λ ≲ 180 nm., helping molecules to survive. Because H2O is no longer photodissociated, the abundance of atomic oxygen drops, quenching the destruction route of carbon chain molecules (Duval et al. 2022). It also quenches the destruction of H2 by atomic oxygen, shifting the H/H2 transition to higher altitudes. This leads to a higher C2H2 abundance in upper layers as this molecule is particularly sensitive to this transition as well (Kanwar et al. 2024b). As a result, water UV shielding enhances the acetylene abundance by more than 4 orders of magnitude in the upper atmosphere (consistent with Duval et al. 2022), and it increases the emission of C2H2 by a factor of 5 (shown in Appendix A.4). It is interesting to note that when C/O > 1, H2O is much less abundant (Sect. 3.2) and no longer attenuates the UV field. Instead, C2H2 and C3 are the main species that shield the gas (see Appendix F).
). In this layer, water attenuates the UV field by seven orders of magnitude, which suppresses the photodissociation by the UV field for species with photodissociation threshold at λ ≲ 180 nm., helping molecules to survive. Because H2O is no longer photodissociated, the abundance of atomic oxygen drops, quenching the destruction route of carbon chain molecules (Duval et al. 2022). It also quenches the destruction of H2 by atomic oxygen, shifting the H/H2 transition to higher altitudes. This leads to a higher C2H2 abundance in upper layers as this molecule is particularly sensitive to this transition as well (Kanwar et al. 2024b). As a result, water UV shielding enhances the acetylene abundance by more than 4 orders of magnitude in the upper atmosphere (consistent with Duval et al. 2022), and it increases the emission of C2H2 by a factor of 5 (shown in Appendix A.4). It is interesting to note that when C/O > 1, H2O is much less abundant (Sect. 3.2) and no longer attenuates the UV field. Instead, C2H2 and C3 are the main species that shield the gas (see Appendix F).
In short, the abundance of acetylene is determined by two distinct processes. First, the chemistry shows that it is set by a balance between formation from atomic carbon thanks to CO dissociation by X-rays, and destruction by the atomic oxygen. Second, C2H2 is known to be sensitive to the UV field (Walsh et al. 2015), so suppressing UV photons with water UV shielding allows organic molecules to be abundant much higher in the disk, revealing C2H2. Our model predicts an emission of C2H2 much brighter than other thermochemical modeling works (Woitke et al. 2018; Greenwood et al. 2019b; Kanwar et al. 2024b) and consistent with JWST observations because we enhance C2H2 formation by including more reactions with H2 (see Sects. 2.2.2 and 4) and we take into account water UV shielding.
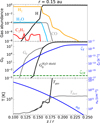 |
Fig. 3 Top: vertical cut at r = 0.15 au showing the abundances of several key atoms and molecules. Middle: Irradiation conditions in this vertical cut, with |
![Mathematical equation: $\[G_{0}^{\mathrm{H}_{2} \mathrm{O} ~\mathrm{shield}}\]$](/articles/aa/full_html/2026/07/aa58778-25/aa58778-25-eq7.png)
3.2 Model grid
3.2.1 Elemental abundances
This section focuses on the impact of the elemental composition of disks on the emission of acetylene and water. To compare their emission, we followed the integration windows of Grant et al. (2025). The emission of C2H2 is integrated over its main Q branch (13.6–13.72 μm) and the water emission is integrated over three windows: 17.09–17.15 μm, 17.2–17.245 μm, and 17.3–17.42 μm. Figure 4 presents the flux of water and acetylene obtained with the grid, covering two parameters: C/O ratio and gas-to-dust ratio gd. Figure 4a (left) shows the fiducial grid.
Increasing the C/O ratio (by increasing C/H), more carbon is available to form molecules, in particular hydrocarbons and CO. In addition, less oxygen is available to form H2O since CO captures more oxygen as well. As a result, the water emission drops while the acetylene emission sharply increases. The C2H2 emission is more sensitive to the C/O ratio than H2O, varying by a factor of 120 versus 7, respectively, between a C/O ratio of 0.2 and 1.5. Moreover, the jump seen for both molecules around C/O=1 corresponds to a switch in the chemistry. Once C/O > 1, the limiting factor becomes the oxygen. In this case, CO locks up most of the oxygen while free carbon remains: hydrocarbons and organic molecules do not need to form via the dissociation of CO, making them much more abundant (see Appendix F). This result is consistent with recent thermochemical model studies (Woitke et al. 2018; Arabhavi et al. 2026). The effect of the C/O ratio is opposite between acetylene and water: one is brighter when the other is fainter. Consequently, the line flux ratio FC2H2/FH2O is strongly dependent on the C/O ratio (Fig. 5a), which varies by almost three orders of magnitude between C/O = 0.2 and C/O = 1.5. The clear jump at C/O = 1 would also allow two populations of disks to be separated and may thus serve as an important observational signature.
As seen in Arabhavi et al. (2026), not only the C/O can play a role in the molecular emission, but also the total oxygen and carbon budget (O/H and C/H). With this model grid, we revisited this aspect with DALI by increasing O/H by a factor of ten compared to the standard ISM values (“enhanced O/H” models), as could be appropriate for icy grains delivering oxygen in the inner disk (see Sect. 4.6). When comparing two models with exactly the same C/O, Fig. 6 reveals how different the two spectra are. Indeed, the water lines are increased by a factor of ~2 whereas the Q branch of C2H2 drops by about the same factor. The increase in water emission is simply due to the overabundance of oxygen. As water lines are optically thick, line fluxes do not scale linearly with O/H even though its abundance is enhanced by an order of magnitude. The drop in C2H2 emission is, however, due to the destruction of carbon chains by oxygen. Indeed, there is more carbon released by the dissociation of CO, but also more oxygen released by CO and H2O. The excess of oxygen released by water is then converted to CO, by depriving hydrocarbons of the available carbon. Therefore, an increase in elemental abundances pushes the balance of formation/destruction (mentioned in Sect. 3.1.2) toward more destruction of carbon chains, creating more oxygen-rich spectra without changing the C/O ratio. Similarly, depleting the oxygen abundance pushes this balance toward more formation of acetylene, although the effect is less pronounced due to a weaker water shielding (see the depleted O/H grid in Appendix D). Our results confirm the claim of Arabhavi et al. (2026) with a different thermochemical model, reinforcing the robustness of these results.
Figure 4b presents the results of the “enhanced O/H” grid with an increased elemental abundance of carbon and oxygen (C/H is scaled accordingly to the C/O ratio). Interestingly, the effect discussed above is only true when C/O < 1. When C/O > 1, C2H2 is actually brighter than with a solar O/H because the formation of acetylene is not limited by CO. Thus, increasing the amount of carbon with a C/O > 1 results in more carbon chains. The flux of water decreases slightly because its formation is in competition with CO. The “depleted O/H” grid (given in Appendix D) follows the same trend but in the opposite directions.
The carbon and oxygen budget itself acts as a variation in the C/O ratio: it stretches the grid in the same direction as the C/O ratio, revealing a partial degeneracy between these two chemical parameters. According to Fig. 5, it is still possible to differentiate between C/O < 1 and C/O > 1, but determining the exact C/O ratio requires knowledge of the O/H ratio, which can be constrained using other molecular emission lines (Arabhavi et al. 2026).
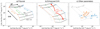 |
Fig. 4 Left: result from the fiducial grid. The orange, green, and blue points correspond to gd = 102, 103, and 104, respectively. The black lines highlight a constant C/O ratio. Middle: result obtained for the “enhanced O/H” grid: O/H×10 (C/H is scaled with the C/O ratio). The fiducial grid is overlaid in gray for reference. Right: Results for the disk aspect ratio, hC (orange), power law index of the dust distribution, q (in blue) with gd = 103. |
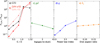 |
Fig. 5 Evolution of the line flux ratio C2H2/H2O with the elemental abundances (C/O and O/H), gas-to-dust mass ratio (gd), power law index (q), and disk aspect ratio (hC), from left to right. The fiducial model with C/O=0.47 is adopted in panels (c), (d), and (e), except for the parameters that are varied. |
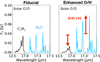 |
Fig. 6 DALI synthetic spectra of the fiducial model (left) and a model with O/H x10 (right). The Q branch of C2H2 (black) and the water lines (blue) used for the line flux around 17.25 μm are shown together for clarity. The carbon and oxygen budget itself acts similarly to a decrease in the C/O ratio: the flux of water increases while acetylene decreases. |
3.2.2 Dust properties
Our model grid also explores the impact of dust properties on C2H2 and H2O emission. This section first describes the effect of the gas-to-dust ratio, then the parameters that fix the dust size distribution: the power law index, q (f(a) ∝ a−q), and the minimum and maximum grain size, amin and amax.
An increase in the gas-to-dust ratio (red, green and blue in Fig. 4a) enhances all the fluxes, moving the predictions to the top right of FH2O–FC2H2 plane. In fact, decreasing the gd ratio (so increasing the amount of dust) strengthens the dust continuum by increasing the total dust cross section per hydrogen atom (Facchini et al. 2017). The increased dust opacity cools the medium and pushes the line-emitting region into less dense regions, effectively reducing the emission of water and acetylene. This opacity effect is in agreement with previous modeling works on H2O emission (Meijerink et al. 2009; Antonellini et al. 2015). However, unlike the C/O ratio, the effect of the gd ratio is the same for both water and acetylene; therefore, grain depletion does not affect FC2H2/FH2O (Fig. 5b) as previously suggested by observational works (Tabone et al. 2023; Arabhavi et al. 2024; Grant et al. 2025).
Dust properties in the inner disks are expected to vary according to spectral energy distribution fitting (Ribas et al. 2020; Kaeufer et al. 2023) and theoretical works (Birnstiel et al. 2015; Birnstiel 2024). Here, we explore how the power law index q of the dust size distribution (f(a) ∝ a−q) affects molecular features in the MIR (blue in Fig. 4c). Unlike the gas-to-dust ratio, the power-law index strongly changes the relative strength of water and acetylene emission. A flatter dust size distribution (smaller q, more large grains with regard to small grains) significantly boosts water while acetylene emission decreases slightly. This effect comes from the dust settling. Indeed, small grains are well coupled to the gas as opposed to large grains. Adopting a flatter dust distribution means that the vertical gradient of the gas-to-dust ratio would be significantly more pronounced because there are only small grains in the upper layers. As water emits vertically higher than acetylene, the contrast between water and acetylene emission is increased because the region where water emits would be much more depleted.
The minimum and maximum grain size do not appear in Fig. 4c as they do not change the flux ratios as significantly as the power-law index (see Appendix E). By increasing the minimum grain size from 5 nm to 100 nm, UV photons penetrate deeper in the disk. Molecules are photodissociated more efficiently, pushing their emitting layers deeper. However, the IR continuum remains similar because small grains (below 100 nm) do not change the MIR opacity significantly. Consequently, C2H2 emission is somewhat reduced as it emits closer to the optically thick dust region. Water emission is less affected by dust continuum because it emits from slightly higher up and further out layers. Pushing its emitting region into denser layers increases its emission, similar to an increase in the gas-to-dust ratio. This effect may be different if the minimum grain size becomes larger than 0.5 μm (Woitke et al. 2016), but this is beyond the scope of this paper. Increasing the maximum grain size for a fixed gas-to-dust ratio is equivalent to increasing the gas-to-dust ratio in the upper atmosphere, because more mass is then carried by large and well-settled grains. The results shown in Appendix E confirm this behavior, with limited increase in the resulting molecular emission and a minor change in the C2H2/H2O flux ratio.
3.2.3 Geometrical parameters
We finally explored the effect of the geometry on molecular emission by changing the disk aspect ratio, hC, and the flaring angle, ψ. When increasing the disk aspect ratio (orange in Fig. 4c), the disk can intercept more photons from the star (the solid angle is larger), making it warmer. This extends the emitting layer of molecules, increasing their emission. In particular, C2H2 is more sensitive to the increase in temperature than H2O. As a result, a thicker disk would extend the emitting layer of acetylene more than water, which is why the disk aspect ratio is more effective on acetylene than on water, with a slight increase in the line flux ratio (Fig. 5).
The effect of the flaring angle is negligible on water and acetylene emission (therefore not displayed in Fig. 4c). This result is in apparent contradiction with Antonellini et al. (2015); Greenwood et al. (2019b) who found that both H2O and C2H2 are brighter when the disk is more flared. However, their reference points for the disk height is 0.1 and 100 au, respectively, meaning that their disk aspect ratios at 0.5 or 1 au change as well. Therefore, they likely traced the effect of disk aspect ratio rather than the flaring angle. Nevertheless, it is interesting to note that the dust continuum is significantly flatter for λ ≥ 15 μm when we decrease the flaring angle, even though it is not the focus of this paper.
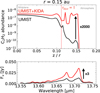 |
Fig. 7 Vertical cut at r = 0.15 au showing the abundance of C2H2 (top) and the corresponding spectrum (bottom) for two chemical networks: the fiducial (in red) and the one based on UMIST only (including also three-body reactions and C + H2O → HCO + H). |
4 Discussion
In this section we discuss the impact of the chemical networks on C2H2 abundance, and explore whether other carbon chains are expected to be abundant in this region. Then, we confront our results with JWST observations to provide first constraints on C/O and O/H in inner disks around T Tauri stars.
4.1 Chemical networks and C2H2
Our models are based on an extended chemical network, combining reactions from the latest version of UMIST (Millar et al. 2024, RATE22) and KIDA (Wakelam et al. 2024). This section highlights the sensitivity of C2H2 to chemical networks, based only on UMIST (as previous DALI networks) or on UMIST+KIDA. For this comparison, we build a network following the method described in Sect. 2.2.2 without adding reactions from KIDA (so this network also includes three-body reactions and C + H2O → HCO + H). Figure 7 presents the C2H2 abundance as a function of the vertical height at r = 0.15 AU obtained with these two chemical networks. When comparing the emitting layers (right side of the vertical dashed red line), there are more than 3 orders of magnitude difference in C2H2 abundance, resulting in a factor ~ 4 in C2H2 emission (bottom panel). This difference is mainly explained by reactions between H2 and hydrocarbons (Appendix B.6), which are present in KIDA from the high temperature network of Harada et al. (2010), but missing in UMIST. Interestingly, Anderson et al. (2021) also used reactions from this network, and C2H2 was abundant in the inner disk of their heated model, which probably comes from the reactions of Harada et al. (2010). However, these reactions between carbon chains and H2 are poorly characterized and little studied. A good example is the reaction C2 + H2 → C2H + H. This reaction is missing in UMIST, which might explain why Walsh et al. (2015) also do not highlight this reaction in their formation scheme of C2H2. Due to a different reactivity between two close-lying electronic states of C2, NIST considers an activation barrier of 4000 K, inconsistent with 1420 K in Harada et al. (2010), the smaller one being the right barrier under inner disk conditions (M. van Hemert, private communication)7. More work has been done on the endothermicities (Tinacci et al. 2023), which enables discrimination between strongly endothermic reactions such as C3 + H2 → C3H + H (see Appendix B.3). Still, most of these reactions need to be studied to estimate the possible activation energies using quantum calculations or experimental measurements, which might ultimately change the abundances obtained with this chemical network.
In addition, we examine the sensitivity of acetylene abundance to the length of carbon chains included in the chemical network. We construct three other networks, “2C”, “3C”, and “4C”, with a maximum number of carbon atoms in hydrocarbons of, respectively, 2,3, and 4 (the fiducial network includes hydrocarbons with a maximum of five carbon atoms). Figure 8 depicts the variation in the emitting column density of C2H2 in these three networks compared to our fiducial network. This sensitivity analysis shows that the network with a maximum of four atoms of carbon is sufficient to predict robust acetylene abundance. By extension, this would suggest that modeling the emission of an hydrocarbon with NC atoms of carbon requires the chemical network to extend at least up to NC + 2 atoms of carbon. The variation in the C2H2 column density as a function of the length of the network is due to the successive opening of complex destruction and formation routes, which can enhance or reduce C2H2 abundance. For example, the 2 C network underpredicts the amount of C2H2 outside of 0.13 au due to the reaction
![Mathematical equation: $\[\mathrm{H}_2 \mathrm{O}+\mathrm{C} \rightarrow \mathrm{HCO}+\mathrm{H},\]$](/articles/aa/full_html/2026/07/aa58778-25/aa58778-25-eq9.png) (6)
(6)
which efficiently recycles C back to CO due to the lack of an efficient route to integrate free carbon into carbon chains. In the 3 C network, the reaction (6) competes with the two main reactions that lock free carbon in carbon chains (Chastaing et al. 1999; Kanwar et al. 2024b):
![Mathematical equation: $\[\mathrm{C}_2 \mathrm{H}_2+\mathrm{C} \rightarrow \mathrm{C}_3+\mathrm{H}_2 \qquad \mathrm{C}_2 \mathrm{H}_2+\mathrm{C} \rightarrow \mathrm{C}_3 \mathrm{H}+\mathrm{H},\]$](/articles/aa/full_html/2026/07/aa58778-25/aa58778-25-eq10.png) (7)
(7)
but these reactions also destroy C2H2. Therefore, the resulting abundance of C2H2 is not systematically higher than for the 2C network as most of the carbon is converted into C3 (around 80%). The column density of C2H2 converges with the 4C network. The increase in C2H2 comes notably from a new formation pathway (Loison et al. 2017):
![Mathematical equation: $\[\mathrm{C}_4 \mathrm{H}_3^{+}+\mathrm{e}^{-} \rightarrow \mathrm{C}_2 \mathrm{H}_2+\mathrm{C}_2 \mathrm{H}.\]$](/articles/aa/full_html/2026/07/aa58778-25/aa58778-25-eq11.png) (8)
(8)
This is an example of a loop that sustains C2H2 even if we increase the number of carbon in species of the network. It also reveals the central place of acetylene in carbon chemistry, making it particularly abundant in warm layers of inner disks.
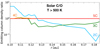 |
Fig. 8 Emitting column density ratio (above the surface τdust = 1 at 14 μm and Tgas > 500 K) of C2H2 obtained for chemical networks including various maximum number of carbon in hydrocarbons. The reference is the fiducial network including 5 atoms of carbon (5C, in red). |
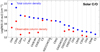 |
Fig. 9 Vertical column densities at r = 0.15 au for hydrocarbons. The total vertical column density is shown in blue. The red dots represent the emitting column density (above the surface τdust = 1 at 14 μm and Tgas > 500 K). While CH4 is the major hydrocarbon, C2H2 is dominant in the emitting layers. |
4.2 Hydrocarbons beyond acetylene
C2H2 is detected in nearly all disks around T Tauri, according to Spitzer (Pontoppidan et al. 2010) and JWST observations (Arulanantham et al. 2025; Grant et al. 2025). However, the other hydrocarbons have not been detected so far in T Tauri disks, except C4H2 recently (Colmenares et al. 2024). Here, we propose a broader view of hydrocarbons to try to understand why species other than C2H2 are hardly detectable. With a solar C/O, Fig. 9 shows that most of the free carbon is contained in methane and acetylene (total column density in blue), which clearly stand out compared to the other species. Interestingly, the emitting column density of methane is orders of magnitude smaller than C2H2 (red dots): most of the methane is hidden in deep layers of the disk, whereas acetylene is very abundant in upper and warm layers of the disk (see the abundance map Fig. 1). This may explain why methane is hardly detectable (non detections listed in Temmink et al. 2025 as example) while C2H2 is bright in disks around T Tauri.
Regarding the other hydrocarbons, C3 is surprisingly abundant in emissive layers, although never detected so far in disks (difficult to detect in the MIR because of its main feature overlapping with CO at 4.7 μm). Next, C4H2 has a relatively high emitting column density and has been detected for the first time around a surprisingly carbon-rich T Tauri disk in Colmenares et al. (2024). However, the two isomers of C3H4 (CH2CCH2 and CH3CCH) have roughly the same emitting column densities as C4H2 but have never been observed by JWST around T Tauri stars, possibly due to a unfavorable spectroscopy compared to C4H2. Interestingly, these are the same hydrocarbons that have been recently detected for the first time around VLMSs (Tabone et al. 2023; Arabhavi et al. 2024) and brown dwarfs (Arabhavi et al. 2025; Morales-Calderón et al. 2025). Their greater stability compared to other hydrocarbons prevents them from reacting with H2, which may explain their abundance in the emitting layers. Given that the cross sections for most of these species are not known, the exact emitting column densities should be interpreted with caution. They strongly depend on the shape of the UV cross section, especially for λ > 180 nm where UV photons are not absorbed by water. Adopting the water cross section for these species increases their emitting column density by an order of magnitude as their photodissociation is suppressed by water UV shielding, but it does not favor long carbon chains.
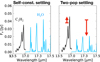 |
Fig. 10 DALI synthetic spectra for two dust settling prescriptions. Left: fiducial spectrum with self-consistent dust settling (Riols settling; Riols & Lesur 2018). Right: spectrum obtained with the two-pop settling prescription, based on two dust populations (small and large). The two-pop settling reduces water emission by a factor of 2. |
4.3 Dust settling prescriptions
Our results show that molecular emissions are sensitive to dust properties. Therefore, amin, amax or q defining the dust distribution prove to be important parameters to consider for the emission of acetylene and water. Another modeling consideration that could change the dust distribution is the prescription of the dust settling. So far, we used a self-consistent dust settling, following “Riols settling” hereafter. We explore here if the standard DALI prescription (called “two-pop settling” hereafter, as reference to the two populations of grains considered) would change the results. In this prescription, dust is modeled by 2 components: small grains (5 nm–1 μm) and large grains (5–1 mm; following D’Alessio et al. 2006, consistent with Andrews et al. 2011) with the same composition (mixture of 60% silicate and 40% graphite, Weingartner & Draine 2001). The scale height for the small population is set to h (the same as the gas), while the scale height of large grains is reduced to χh, with χ = 0.2. As for Riols settling, we consider a gas-to-dust mass ratio of gd = 103 with a fraction of large grains over small grains, flarge/small = 0.90. It corresponds to gd = 104 in the surface layers, consistent with the gas-to-dust ratio where H2O and C2H2 emit (see Fig. 1b).
Figure 10 shows the two spectra obtained with these two prescriptions, focusing on the Q branch of acetylene and water lines around 17 μm. The two-pop settling underpredicts water emission by a factor of 2 compared to Riols settling, whereas the acetylene remains almost the same, with a slight increase. This different behavior arises from the two distinct line-emitting regions of these molecules. As mentioned in Sect. 3.1.1, the gas-to-dust ratio is lower where C2H2 emits (gd ~ 9 × 10³) than where water emits (gd ~ 5 × 10⁴). We also show that molecular emission is increased when the grains are depleted (see Sect. 3.2). Consequently, the gas-to-dust ratio of 104 in the upper layers of the two-pop settling model would reduce the emission of water, since the gas-to-dust ratio is locally lower (there is more dust) than in the Riols settling prescription. In contrast, where C2H2 emits, the difference in the gas-to-dust ratio is small; hence, this increase is negligible. Extending this result to other species, since the gradient of the gas-to-dust ratio is very strong in the IR emitting layers, we expect that the two-pop settling would reduce the emission of species with higher line formation regions, such as OH, CO, and H2O, but should increase or have a negligible impact on species emitting from deeper layers. Future studies are needed to confirm this.
4.4 Comparison with observations
The comparison of the model grid with observations from the MIRI Mid-INfrared Disk Survey (MINDS) GTO program (PID: 1282, PI: T. Henning; see Henning et al. 2024) and DoAr 33 (Colmenares et al. 2024) is shown in Fig. 11. For this comparison, we select only the disks with similar characteristics as the DALI models (full T Tauri disks orbiting a star of luminosity close to solar). We export the line flux from Grant et al. (2025). The ten selected disks span over an appreciable range of luminosities (0.41–1.9 L⊙) so we plot the line-to-continuum ratio instead of the absolute fluxes to free ourselves from this dependency. The line-to-continuum ratios are calculated with the same method as Grant et al. (2025), by dividing the peak flux of C2H2 (Q branch) and H2O (between 17.3514 μm and 17.36 μm) by the continuum flux at the same wavelength. We refer to Grant et al. (2025) for further information on these disks.
The fiducial grid is presented in Fig. 11a. The absolute fluxes of C2H2 and H2O predicted by DALI are in line with the observations. Our fiducial model (with solar C/O and O/H, gd = 103) reproduces disks with relatively strong C2H2, in between Sz 50 and DL Tau. The enhanced O/H grid (Fig. 11b) covers most of the JWST observations, indicating that the oxygen enrichment seems to be a common feature in T Tauri disks. Figure 11c also suggests T Tauri disks showing the strongest water emission (with regard to to the continuum) might experience grain growth, possibly combined with a stronger settling leading to a depleted atmosphere, as for XX Cha or DR Tau. Interestingly, the region with C/O > 1 is always empty regardless of which parameter we take. Even disks showing the strongest C2H2 emission, such as V1094Sco or DoAr33 (Colmenares et al. 2024), are not in this region. This might be evidence that T Tauri disks with a C/O > 1 are rare, consistent with evolutionary models by Mah et al. (2023); Sellek & van Dishoeck (2025). This result is also consistent with the ProDiMo results from Arabhavi et al. (2026), in which the region with C/O > 1 is orders of magnitude away from the observations.
Our models also reproduce the observed line flux ratio C2H2/H2O (Fig. 12). This figure clearly shows that the spread seen in observations (Grant et al. 2025) can be explained by either the elemental abundances (C/O and O/H) or the power law index of the dust size distribution (q), while gd and hC have a negligible impact. However, as mentioned above, C/O > 1 clearly overshoots this spread, reinforcing that T Tauri disks are likely to have a C/O below 1 in their inner regions.
4.5 Retrieved excitation conditions
In this section, we investigate the consistency between the results of DALI and the 0D slab retrievals used to interpret JWST observations (see code and fitting procedure in Tabone et al. 2023). Figure 13 shows that the excitation conditions retrieved for C2H2 on DALI for a solar C/O using slab models (red crosses, Tex ~ 500 K and effective radius corresponding to an emitting area πR2 of R ~ 0.1 au) are consistent with the temperature and effective radius retrieved from JWST observations of GW Lup and DoAr 33 (Grant et al. 2023; Colmenares et al. 2024). Our thermochemical model is able to reproduce both the line flux and the excitation conditions of the C2H2 observed in disks. Figure 13 also suggests that the effective radii and temperatures do not change significantly with the gas-to-dust ratio. Interestingly, despite the large uncertainties, the conditions retrieved from the DALI model with C/O = 1.5 are distinctly colder (Tex ~ 300 K) and more extended (R ~1.1 au), confirming that the chemical structure changes drastically when C/O > 1. This is also reflected in the abundance map of acetylene for a C/O > 1, which is dramatically different from C/O < 1 (shown in Appendix F). Our models predict that DoAr33 is one of the richest T Tauri disk in carbon C/O ~ 0.9 according to Fig. 11 with a large gas-to-dust ratio. However, the detailed analysis of DoAr 33 by Colmenares et al. (2024) determined a C/O ratio between 2 and 4. This difference probably arises from the chemical network: their network is based on UMIST only which underproduces acetylene (see Fig. 7) compared to our network. To compensate, they likely need to increase the C/O ratio. In addition, our study relies on molecular fluxes, whereas they compared the predicted column densities to those retrieved from single-zone slab models. Radiative transfer effects can play a role, especially in the enhanced C/O models where C2H2 and dust are optically thick in the inner disk. Detailed radiative transfer is therefore needed to obtain a robust estimate of elemental abundances.
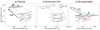 |
Fig. 11 Same as Fig. 4 but showing the line-to-continuum ratios for acetylene and water. Panel c: influence of the parameters covered in this work: black for C/O, red for O/H, green for gd, blue for q, and orange for hC. MINDS observations are shown with gray squares, with fluxes exported from Grant et al. (2025). We include only T Tauri full disks, without cavities. This plot suggests that a C/O > 1 is excluded in T Tauri disks, and most of the disks are better reproduced by a high O/H or low C/O. |
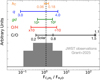 |
Fig. 12 Distribution of the line flux ratio C2H2/H2O observed by JWST (Grant et al. 2025) compared to the parameters explored in this work. Three parameters stand out to explain this spread: C/O, O/H or q. A C/O > 1 seems excluded for inner disks of T Tauri stars. |
4.6 Evidence of radial drift?
The comparison of our model grid with JWST observations suggests that most of the inner disks of T Tauri have a solar or subsolar C/O ratio, and possibly combined with an increase in the elemental oxygen O/H. These two conditions are not contradictory and can be naturally fulfilled by the radial dust drift. Transport models show that oxygen-dominated ices (CO, CO2, and H2O) carried by grains coming from the outer disk would sublimate in the inner disk and enrich the gas phase in oxygen (Krijt et al. 2016; Booth et al. 2017; Kalyaan et al. 2021; Houge et al. 2025b). This increase in the gas-phase O/H would therefore lower the C/O ratio of the inner disk (Öberg et al. 2011, 2021; Mah et al. 2023; Sellek et al. 2025; Williams et al. 2025). As a result, water emission would increase dramatically at the expense of C2H2 and other organic species, the latter being destroyed in greater quantity. These results were further supported observationally by Banzatti et al. (2020, 2023, 2025). However, ALMA reveals that most disks show substructures with rings and gaps (Andrews et al. 2018). In the case of deep gaps in the disk, this drift would stop, preventing the grains from enriching the gas in oxygen. According to hydrodynamic simulations (Lubow & D’Angelo 2006; Bergez-Casalou et al. 2020), the gas from the outer disk would still cross the gap. This would elevate the C/O ratio while reducing O/H of the inner disk, since the gas from the outer disk is known to be oxygen-poor and have a high C/O ratio (Bergin et al. 2016; Miotello et al. 2017; Sturm et al. 2022). For this situation, according to our models, MIR spectra would show a prominent Q branch of acetylene with a reduced water emission. Nevertheless, several studies did not necessarily find a relation between the substructures seen with ALMA and the molecular features of the inner disk (Gasman et al. 2025; Temmink et al. 2025), revealing that this interpretation might be too simplistic. Indeed, micron-size grains can still cross gaps and reach the inner disk (Rice et al. 2006; Zhu et al. 2012; Weber et al. 2018; Stammler et al. 2023). This would suggest that it might be the leakiness of gaps that governs the balance between the drift of dust and gas (Krijt et al. 2025), setting the elemental abundances in the inner disk (Tabone et al. 2026).
Following this scenario, the spread of the line flux ratio C2H2/H2O might be a consequence of a change in elemental abundances due to the diversity of leakiness of gaps during the radial drift. Consequently, constraining the elemental abundances of the inner disk is fundamental to understanding the relation between inner and outer disks.
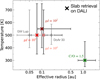 |
Fig. 13 Temperature and effective radius (corresponding to an emitting area πR2) of C2H2 emission retrieved from slab models on DALI predicted spectra. Red crosses indicate DALI models with solar C/O and gd = 102, 103, 104, while the green cross corresponds to C/O = 1.5 and gd = 103. JWST observations of 2 disks are shown in gray (Grant et al. 2023; Colmenares et al. 2024). |
5 Conclusion
The JWST is revolutionizing the characterization of the gas content in the inner disk of T Tauri stars. Our work aims to model the MIR emission of water and acetylene, two molecules ubiquitously detected by JWST, to quantify the underlying information they contain about this region. To better model inner disks, we improve the thermochemical model DALI by extending the chemical network, refining the UV self-shielding of molecules and including the line overlap in the ray-tracing. With a realistic disk geometry and a solar C/O ratio, we are able to reproduce the observed C2H2 emission in T Tauri disks reasonably well. We explore parameters related to the elemental abundances, the dust properties, and the geometry to conclude that:
The abundance of hydrocarbons for C/O < 1 is set by a balance between formation seeded by CO X-ray induced dissociation and destruction by atomic O. Therefore, a change in these abundances, in particular O/H, strongly influences this balance. C2H2 is the most abundant hydrocarbon in emitting layers because it is a small and stable molecule, especially against reactions with H2, and also faster to form compared to CH4. It is also a key molecule in carbon chemistry as it is the reaction intermediate to form long carbon chains;
Our models predict observable C2H2 for C/O < 1 thanks to water UV shielding and our new chemical network, which includes many reactions between hydrocarbons and H2, both increasing the emission of acetylene;
The emission of C2H2 and H2O are good tracers of the elemental composition of disks. They both vary strongly with the C/O and the O/H ratios. In particular, enhanced elemental abundances reduce C2H2 emission due to the excess of atomic oxygen, which destroys carbon chains;
Dust properties also have a significant impact on molecular features. A shallower dust size distribution (lower power law index, q) increases water emission but decreases acetylene emission, which can thus be a key parameter in the C2H2/H2O line flux ratio. Depleting grains in the atmosphere increases both C2H2 and H2O emissions, and does not favor C2H2 as speculated in recent observational works (in the limit of the parameter space explored);
The spread of the line flux ratio C2H2/H2O observed in T Tauri disks naturally arises from the elemental abundances (C/O and O/H), or from the dust size distribution. This highlights the importance of considering both gas and dust emission when interpreting JWST data. It also underscores the benefit of combining JWST data with inner disk dust observations to better constrain dust properties and thereby the elemental composition of the gas. Still, C/O > 1 is excluded to explain JWST observation, even for the disks showing a prominent C2H2 feature. Distinguishing between a low C/O or enhanced O/H with only C2H2/H2O seems difficult, but other species such as CO2 could help break the degeneracy according to Arabhavi et al. (2026).
The results of the model grid suggest that the gas in the inner disk of T Tauri has enhanced elemental abundances, with a C/O < 1, consistent with recent work (Mah et al. 2023; Sellek & van Dishoeck 2025; Tabone et al. 2026). JWST is now revealing the chemical composition of the atmospheres of close-in gas giant exoplanets, for which the C/O ratio and the metallicities appear to be in agreement with these results. A more detailed comparison and population analysis should be carried out to confirm this tentative link between disk and exoplanet composition. We finally stress that the estimates of the elemental composition of inner disks hinge on our knowledge of rate coefficients of gas-phase reactions at high temperature, which remain poorly studied for specific yet key types of reactions, such as the hydrogenation of hydrocarbons by H2.
Acknowledgements
The authors thank the referee for a constructive report that improved the quality of the paper. P.E and B.T thank E. Roueff, M. van Hemert, and G. Pineau des Forêts for helping us clarify the C2+H2 reaction rates and V. Wakelam for her support on the use of KIDA networks, and S. Facchini for his useful help with the dust settling module in DALI. P.E. and B.T also thank M.J. Colmenares for providing us the spectrum of DoAr33 and for interesting discussions regarding chemical networks. Part of this work was supported by the Action Thématique “Physique et Chimie du Milieu Interstellaire” (PCMI) of CNRS/INSU with INC/INP co-funded by CEA and CNES. I.K. acknowledges support from the H2020-MSCA-ITN-2019 grant no. 860470 (CHAMELEON). I.K., E.v.D. and A.M.A. acknowledge support from grant TOP-1614.001.751 from the Dutch Research Council (NWO). E.v.D. and M.V. are supported by funding from the European Research Council (ERC) under the European Union’s Horizon 2020 research and innovation programme (grant agreement No. 101019751 MOLDISK) and by the Danish National Research Foundation through the Center of Excellence “InterCat” (Grant agreement no.: DNRF150).
References
- Ádámkovics, M., Glassgold, A. E., & Najita, J. R. 2014, ApJ, 786, 135 [CrossRef] [Google Scholar]
- Agúndez, M., Cernicharo, J., & Goicoechea, J. R. 2008, A&A, 483, 831 [NASA ADS] [CrossRef] [EDP Sciences] [Google Scholar]
- Alata, I., Cruz-Diaz, G. A., Muñoz Caro, G. M., & Dartois, E. 2014, A&A, 569, A119 [NASA ADS] [CrossRef] [EDP Sciences] [Google Scholar]
- ALMA Partnership (Brogan, C. L., et al.) 2015, ApJ, 808, L3 [Google Scholar]
- Anderson, D. E., Blake, G. A., Cleeves, L. I., et al. 2021, ApJ, 909, 55 [NASA ADS] [CrossRef] [Google Scholar]
- Andrews, S. M. 2020, ARA&A, 58, 483 [Google Scholar]
- Andrews, S. M., Wilner, D. J., Espaillat, C., et al. 2011, ApJ, 732, 42 [Google Scholar]
- Andrews, S. M., Huang, J., Pérez, L. M., et al. 2018, ApJ, 869, L41 [NASA ADS] [CrossRef] [Google Scholar]
- Antonellini, S., Kamp, I., Riviere-Marichalar, P., et al. 2015, A&A, 582, A105 [NASA ADS] [CrossRef] [EDP Sciences] [Google Scholar]
- Antonellini, S., Kamp, I., & Waters, L. B. F. M. 2023, A&A, 672, A92 [NASA ADS] [CrossRef] [EDP Sciences] [Google Scholar]
- Arabhavi, A. M., Kamp, I., Henning, T., et al. 2024, Science, 384, 1086 [NASA ADS] [CrossRef] [Google Scholar]
- Arabhavi, A. M., Kamp, I., Henning, T., et al. 2025, A&A, 699, A194 [NASA ADS] [CrossRef] [EDP Sciences] [Google Scholar]
- Arabhavi, A. M., Kamp, I., van Dishoeck, E. F., et al. 2026, A&A, 708, A82 [NASA ADS] [CrossRef] [EDP Sciences] [Google Scholar]
- Arulanantham, N., Salyk, C., Pontoppidan, K., et al. 2025, AJ, 170, 67 [Google Scholar]
- Banzatti, A., Pascucci, I., Bosman, A. D., et al. 2020, ApJ, 903, 124 [NASA ADS] [CrossRef] [Google Scholar]
- Banzatti, A., Pontoppidan, K. M., Carr, J. S., et al. 2023, ApJ, 957, L22 [NASA ADS] [CrossRef] [Google Scholar]
- Banzatti, A., Salyk, C., Pontoppidan, K. M., et al. 2025, AJ, 169, 165 [Google Scholar]
- Bast, J. E., Lahuis, F., van Dishoeck, E. F., & Tielens, A. G. G. M. 2013, A&A, 551, A118 [NASA ADS] [CrossRef] [EDP Sciences] [Google Scholar]
- Bergez-Casalou, C., Bitsch, B., Pierens, A., Crida, A., & Raymond, S. N. 2020, A&A, 643, A133 [NASA ADS] [CrossRef] [EDP Sciences] [Google Scholar]
- Bergin, E. A., Du, F., Cleeves, L. I., et al. 2016, ApJ, 831, 101 [Google Scholar]
- Bethell, T., & Bergin, E. 2009, Science, 326, 1675 [NASA ADS] [CrossRef] [Google Scholar]
- Birnstiel, T. 2024, ARA&A, 62, 157 [Google Scholar]
- Birnstiel, T., Ormel, C. W., & Dullemond, C. P. 2011, A&A, 525, A11 [NASA ADS] [CrossRef] [EDP Sciences] [Google Scholar]
- Birnstiel, T., Klahr, H., & Ercolano, B. 2012, A&A, 539, A148 [NASA ADS] [CrossRef] [EDP Sciences] [Google Scholar]
- Birnstiel, T., Andrews, S. M., Pinilla, P., & Kama, M. 2015, ApJ, 813, L14 [NASA ADS] [CrossRef] [Google Scholar]
- Bitsch, B., & Mah, J. 2023, A&A, 679, A11 [NASA ADS] [CrossRef] [EDP Sciences] [Google Scholar]
- Bitsch, B., Lambrechts, M., & Johansen, A. 2015, A&A, 582, A112 [NASA ADS] [CrossRef] [EDP Sciences] [Google Scholar]
- Bitsch, B., Schneider, A. D., & Kreidberg, L. 2022, A&A, 665, A138 [NASA ADS] [CrossRef] [EDP Sciences] [Google Scholar]
- Blum, J., & Wurm, G. 2008, ARA&A, 46, 21 [CrossRef] [Google Scholar]
- Booth, R. A., Clarke, C. J., Madhusudhan, N., & Ilee, J. D. 2017, MNRAS, 469, 3994 [Google Scholar]
- Booth, A. S., Leemker, M., van Dishoeck, E. F., et al. 2024, AJ, 167, 164 [NASA ADS] [CrossRef] [Google Scholar]
- Borderies, A., Commerçon, B., & Bourdon, B. 2025, A&A, 694, A89 [NASA ADS] [CrossRef] [EDP Sciences] [Google Scholar]
- Bosman, A. D., Bruderer, S., & van Dishoeck, E. F. 2017, A&A, 601, A36 [NASA ADS] [CrossRef] [EDP Sciences] [Google Scholar]
- Bosman, A. D., Walsh, C., & van Dishoeck, E. F. 2018, A&A, 618, A182 [NASA ADS] [CrossRef] [EDP Sciences] [Google Scholar]
- Bosman, A. D., Alarcón, F., Bergin, E. A., et al. 2021, ApJS, 257, 7 [NASA ADS] [CrossRef] [Google Scholar]
- Bosman, A. D., Bergin, E. A., Calahan, J., & Duval, S. E. 2022a, ApJ, 930, L26 [NASA ADS] [CrossRef] [Google Scholar]
- Bosman, A. D., Bergin, E. A., Calahan, J. K., & Duval, S. E. 2022b, ApJ, 933, L40 [NASA ADS] [CrossRef] [Google Scholar]
- Brauer, F., Dullemond, C. P., & Henning, T. 2008, A&A, 480, 859 [NASA ADS] [CrossRef] [EDP Sciences] [Google Scholar]
- Bruderer, S. 2013, A&A, 559, A46 [NASA ADS] [CrossRef] [EDP Sciences] [Google Scholar]
- Bruderer, S., van Dishoeck, E. F., Doty, S. D., & Herczeg, G. J. 2012, A&A, 541, A91 [NASA ADS] [CrossRef] [EDP Sciences] [Google Scholar]
- Bruderer, S., Harsono, D., & van Dishoeck, E. F. 2015, A&A, 575, A94 [NASA ADS] [CrossRef] [EDP Sciences] [Google Scholar]
- Carr, J. S., & Najita, J. R. 2008, Science, 319, 1504 [Google Scholar]
- Carr, J. S., & Najita, J. R. 2011, ApJ, 733, 102 [NASA ADS] [CrossRef] [Google Scholar]
- Chastaing, D., James, P. L., Sims, I. R., & Smith, I. W. M. 1999, Phys. Chem. Chem. Phys. (Incorp. Faraday Trans.), 1, 2247 [Google Scholar]
- Colmenares, M. J., Bergin, E. A., Salyk, C., et al. 2024, ApJ, 977, 173 [NASA ADS] [CrossRef] [Google Scholar]
- Cridland, A. J., Eistrup, C., & van Dishoeck, E. F. 2019, A&A, 627, A127 [Google Scholar]
- D’Alessio, P., Calvet, N., Hartmann, L., Franco-Hernández, R., & Servín, H. 2006, ApJ, 638, 314 [Google Scholar]
- Drążkowska, J., Li, S., Birnstiel, T., Stammler, S. M., & Li, H. 2019, ApJ, 885, 91 [Google Scholar]
- Duval, S. E., Bosman, A. D., & Bergin, E. A. 2022, ApJ, 934, L25 [NASA ADS] [CrossRef] [Google Scholar]
- Ehrig, R., Nowak, U., Oeverdieck, L., & Deuflhard, P. 1999, in High Performance Scientific and Engineering Computing, 8, eds. M. Griebel, D. E. Keyes, R. M. Nieminen, D. Roose, T. Schlick, H.-J. Bungartz, F. Durst, & C. Zenger (Berlin, Heidelberg: Springer Berlin Heidelberg), 233 [Google Scholar]
- Facchini, S., Birnstiel, T., Bruderer, S., & van Dishoeck, E. F. 2017, A&A, 605, A16 [NASA ADS] [CrossRef] [EDP Sciences] [Google Scholar]
- Faure, A., & Josselin, E. 2008, A&A, 492, 257 [NASA ADS] [CrossRef] [EDP Sciences] [Google Scholar]
- France, K., Schindhelm, R., Bergin, E. A., Roueff, E., & Abgrall, H. 2014, ApJ, 784, 127 [NASA ADS] [CrossRef] [Google Scholar]
- Gasman, D., van Dishoeck, E. F., Grant, S. L., et al. 2023, A&A, 679, A117 [NASA ADS] [CrossRef] [EDP Sciences] [Google Scholar]
- Gasman, D., Temmink, M., van Dishoeck, E. F., et al. 2025, A&A, 694, A147 [NASA ADS] [CrossRef] [EDP Sciences] [Google Scholar]
- Glassgold, A. E., Meijerink, R., & Najita, J. R. 2009, ApJ, 701, 142 [NASA ADS] [CrossRef] [Google Scholar]
- Grant, S. L., van Dishoeck, E. F., Tabone, B., et al. 2023, ApJ, 947, L6 [NASA ADS] [CrossRef] [Google Scholar]
- Grant, S. L., Temmink, M., van Dishoeck, E. F., et al. 2025, A&A, 702, A126 [NASA ADS] [CrossRef] [EDP Sciences] [Google Scholar]
- Greenwood, A. J., Kamp, I., Waters, L. B. F. M., Woitke, P., & Thi, W.-F. 2019a, A&A, 626, A6 [NASA ADS] [CrossRef] [EDP Sciences] [Google Scholar]
- Greenwood, A. J., Kamp, I., Waters, L. B. F. M., Woitke, P., & Thi, W.-F. 2019b, A&A, 631, A81 [NASA ADS] [CrossRef] [EDP Sciences] [Google Scholar]
- Güttler, C., Blum, J., Zsom, A., Ormel, C. W., & Dullemond, C. P. 2010, A&A, 513, A56 [Google Scholar]
- Harada, N., Herbst, E., & Wakelam, V. 2010, ApJ, 721, 1570 [NASA ADS] [CrossRef] [Google Scholar]
- Heays, A. N., Bosman, A. D., & van Dishoeck, E. F. 2017, A&A, 602, A105 [NASA ADS] [CrossRef] [EDP Sciences] [Google Scholar]
- Henning, T., Kamp, I., Samland, M., et al. 2024, PASP, 136, 054302 [NASA ADS] [CrossRef] [Google Scholar]
- Hickson, K. M., Loison, J.-C., Nunez-Reyes, D., & Mereau, R. 2016, arXiv e-prints [arXiv:1608.08877] [Google Scholar]
- Horne, K., & Marsh, T. R. 1986, MNRAS, 218, 761 [NASA ADS] [CrossRef] [Google Scholar]
- Houge, A., Johansen, A., Bergin, E., et al. 2025a, A&A, 699, A227 [NASA ADS] [CrossRef] [EDP Sciences] [Google Scholar]
- Houge, A., Krijt, S., Banzatti, A., et al. 2025b, MNRAS, 537, 691 [CrossRef] [Google Scholar]
- Hrodmarsson, H. R., & van Dishoeck, E. F. 2023, A&A, 675, A25 [NASA ADS] [CrossRef] [EDP Sciences] [Google Scholar]
- Husain, D., & Kirsch, L. J. 1971, Trans. Faraday Soc., 67, 2025 [Google Scholar]
- Hébrard, E., Dobrijevic, M., Pernot, P., et al. 2009, J. Phys. Chem. A, 113, 11227 [NASA ADS] [CrossRef] [Google Scholar]
- Jonkheid, B., Kamp, I., Augereau, J.-C., & van Dishoeck, E. F. 2006, A&A, 453, 163 [NASA ADS] [CrossRef] [EDP Sciences] [Google Scholar]
- Kaeufer, T., Woitke, P., Min, M., Kamp, I., & Pinte, C. 2023, A&A, 672, A30 [NASA ADS] [CrossRef] [EDP Sciences] [Google Scholar]
- Kalyaan, A., Pinilla, P., Krijt, S., Mulders, G. D., & Banzatti, A. 2021, ApJ, 921, 84 [CrossRef] [Google Scholar]
- Kalyaan, A., Pinilla, P., Krijt, S., et al. 2023, ApJ, 954, 66 [NASA ADS] [CrossRef] [Google Scholar]
- Kamp, I., Thi, W.-F., Woitke, P., et al. 2017, A&A, 607, A41 [NASA ADS] [CrossRef] [EDP Sciences] [Google Scholar]
- Kamp, I., Henning, T., Arabhavi, A. M., et al. 2023, Faraday Discuss., 245, 112 [NASA ADS] [CrossRef] [Google Scholar]
- Kanwar, J., Kamp, I., Jang, H., et al. 2024a, A&A, 689, A231 [NASA ADS] [CrossRef] [EDP Sciences] [Google Scholar]
- Kanwar, J., Kamp, I., Woitke, P., et al. 2024b, A&A, 681, A22 [NASA ADS] [CrossRef] [EDP Sciences] [Google Scholar]
- Kanwar, J., Woitke, P., Kamp, I., Rimmer, P., & Helling, C. 2025, A&A, 698, A294 [NASA ADS] [CrossRef] [EDP Sciences] [Google Scholar]
- Kanwar, J., Kamp, I., Woitke, P., et al. 2026, A&A, 705, A222 [NASA ADS] [CrossRef] [EDP Sciences] [Google Scholar]
- Krijt, S., Ciesla, F. J., & Bergin, E. A. 2016, ApJ, 833, 285 [Google Scholar]
- Krijt, S., Bosman, A. D., Zhang, K., et al. 2020, ApJ, 899, 134 [NASA ADS] [CrossRef] [Google Scholar]
- Krijt, S., Banzatti, A., Zhang, K., et al. 2025, ApJ, 990, L72 [Google Scholar]
- Kruse, T., & Roth, P. 1997, J. Phys. Chem. A, 101, 2138 [NASA ADS] [CrossRef] [Google Scholar]
- Lenzuni, P., Gail, H.-P., & Henning, T. 1995, ApJ, 447, 848 [NASA ADS] [CrossRef] [Google Scholar]
- Li, J., Xie, C., & Guo, H. 2017, Phys. Chem. Chem. Phys. (Incorp. Faraday Trans.), 19, 23280 [Google Scholar]
- Ligterink, N. F. W., Kipfer, K. A., & Gavino, S. 2024, A&A, 687, A224 [NASA ADS] [CrossRef] [EDP Sciences] [Google Scholar]
- Loison, J.-C., Agúndez, M., Wakelam, V., et al. 2017, MNRAS, 470, 4075 [Google Scholar]
- Lubow, S. H., & D’Angelo, G. 2006, ApJ, 641, 526 [Google Scholar]
- Lynden-Bell, D. & Pringle, J. E. 1974, MNRAS, 168, 603 [NASA ADS] [CrossRef] [Google Scholar]
- Madhusudhan, N., Agúndez, M., Moses, J. I., & Hu, Y. 2016, Space Sci. Rev., 205, 285 [Google Scholar]
- Mah, J., Bitsch, B., Pascucci, I., & Henning, T. 2023, A&A, 677, L7 [CrossRef] [EDP Sciences] [Google Scholar]
- Mathis, J. S., Rumpl, W., & Nordsieck, K. H. 1977, ApJ, 217, 425 [Google Scholar]
- Mayor, M., & Queloz, D. 1995, Nature, 378, 355 [Google Scholar]
- McElroy, D., Walsh, C., Markwick, A. J., et al. 2013, A&A, 550, A36 [NASA ADS] [CrossRef] [EDP Sciences] [Google Scholar]
- Meijerink, R., Pontoppidan, K. M., Blake, G. A., Poelman, D. R., & Dullemond, C. P. 2009, ApJ, 704, 1471 [Google Scholar]
- Millar, T. J., Walsh, C., Van de Sande, M., & Markwick, A. J. 2024, A&A, 682, A109 [NASA ADS] [CrossRef] [EDP Sciences] [Google Scholar]
- Miotello, A., Bruderer, S., & van Dishoeck, E. F. 2014, A&A, 572, A96 [NASA ADS] [CrossRef] [EDP Sciences] [Google Scholar]
- Miotello, A., van Dishoeck, E. F., Williams, J. P., et al. 2017, A&A, 599, A113 [NASA ADS] [CrossRef] [EDP Sciences] [Google Scholar]
- Miotello, A., Facchini, S., van Dishoeck, E. F., et al. 2019, A&A, 631, A69 [NASA ADS] [CrossRef] [EDP Sciences] [Google Scholar]
- Morales-Calderón, M., Jang, H., Arabhavi, A. M., et al. 2025, A&A, 703, A18 [NASA ADS] [CrossRef] [EDP Sciences] [Google Scholar]
- Najita, J. R., Ádámkovics, M., & Glassgold, A. E. 2011, ApJ, 743, 147 [NASA ADS] [CrossRef] [Google Scholar]
- Najita, J. R., Carr, J. S., Pontoppidan, K. M., et al. 2013, ApJ, 766, 134 [Google Scholar]
- Notsu, S., van Dishoeck, E. F., Walsh, C., Bosman, A. D., & Nomura, H. 2021, A&A, 650, A180 [NASA ADS] [CrossRef] [EDP Sciences] [Google Scholar]
- Öberg, K. I., & Bergin, E. A. 2021, Phys. Rep., 893, 1 [Google Scholar]
- Öberg, K. I., Murray-Clay, R., & Bergin, E. A. 2011, ApJ, 743, L16 [Google Scholar]
- Öberg, K. I., Guzmán, V. V., Walsh, C., et al. 2021, ApJS, 257, 1 [CrossRef] [Google Scholar]
- O’Donovan, B., & Bitsch, B. 2026, A&A, 706, A30 [NASA ADS] [CrossRef] [EDP Sciences] [Google Scholar]
- Pasternack, L., Pitts, W., & McDonald, J. 1981, Chem. Phys., 57, 19 [Google Scholar]
- Pinilla, P., Birnstiel, T., Ricci, L., et al. 2012, A&A, 538, A114 [NASA ADS] [CrossRef] [EDP Sciences] [Google Scholar]
- Pitts, W. M., Pasternack, L., & McDonald, J. 1982, Chem. Phys., 68, 417 [NASA ADS] [CrossRef] [Google Scholar]
- Pontoppidan, K. M., Salyk, C., Blake, G. A., et al. 2010, ApJ, 720, 887 [CrossRef] [Google Scholar]
- Ribas, Á., Espaillat, C. C., Macías, E., & Sarro, L. M. 2020, A&A, 642, A171 [NASA ADS] [CrossRef] [EDP Sciences] [Google Scholar]
- Rice, W. K. M., Armitage, P. J., Wood, K., & Lodato, G. 2006, MNRAS, 373, 1619 [Google Scholar]
- Riols, A., & Lesur, G. 2018, A&A, 617, A117 [NASA ADS] [CrossRef] [EDP Sciences] [Google Scholar]
- Salyk, C., Pontoppidan, K. M., Blake, G. A., et al. 2008, ApJ, 676, L49 [NASA ADS] [CrossRef] [Google Scholar]
- Salyk, C., Pontoppidan, K. M., Blake, G. A., Najita, J. R., & Carr, J. S. 2011, ApJ, 731, 130 [Google Scholar]
- Schindhelm, R., France, K., Herczeg, G. J., et al. 2012, ApJ, 756, L23 [NASA ADS] [CrossRef] [Google Scholar]
- Schneider, A. D., & Bitsch, B. 2021, A&A, 654, A71 [Google Scholar]
- Schwarz, K. R., Henning, T., Christiaens, V., et al. 2024, ApJ, 962, 8 [NASA ADS] [CrossRef] [Google Scholar]
- Sellek, A. D., & van Dishoeck, E. F. 2025, A&A, 701, A239 [NASA ADS] [CrossRef] [EDP Sciences] [Google Scholar]
- Sellek, A. D., Vlasblom, M., & van Dishoeck, E. F. 2025, A&A, 694, A79 [NASA ADS] [CrossRef] [EDP Sciences] [Google Scholar]
- Silva, R., Gichuhi, W. K., Huang, C., et al. 2008, PNAS, 105, 12713 [Google Scholar]
- Stammler, S. M., Lichtenberg, T., Drążkowska, J., & Birnstiel, T. 2023, A&A, 670, L5 [NASA ADS] [CrossRef] [EDP Sciences] [Google Scholar]
- Sturm, J. A., McClure, M. K., Harsono, D., et al. 2022, A&A, 660, A126 [NASA ADS] [CrossRef] [EDP Sciences] [Google Scholar]
- Tabone, B., Bettoni, G., van Dishoeck, E. F., et al. 2023, Nat. Astron., 7, 805 [NASA ADS] [CrossRef] [Google Scholar]
- Tabone, B., van Dishoeck, E. F., & Black, J. H. 2024, A&A, 691, A11 [NASA ADS] [CrossRef] [EDP Sciences] [Google Scholar]
- Tabone, B., Temmink, M., Waters, L. B. F. M., et al. 2026, A&A, submitted [arXiv:2604.21803] [Google Scholar]
- Tazaki, R., & Dominik, C. 2022, A&A, 663, A57 [NASA ADS] [CrossRef] [EDP Sciences] [Google Scholar]
- Temmink, M., van Dishoeck, E. F., Grant, S. L., et al. 2024, A&A, 686, A117 [NASA ADS] [CrossRef] [EDP Sciences] [Google Scholar]
- Temmink, M., Sellek, A. D., Gasman, D., et al. 2025, A&A, 699, A134 [NASA ADS] [CrossRef] [EDP Sciences] [Google Scholar]
- Tinacci, L., Ferrada-Chamorro, S., Ceccarelli, C., et al. 2023, ApJS, 266, 38 [NASA ADS] [CrossRef] [Google Scholar]
- van Dishoeck, E. F., & Black, J. H. 1982, ApJ, 258, 533 [NASA ADS] [CrossRef] [Google Scholar]
- van Dishoeck, E. F., Herbst, E., & Neufeld, D. A. 2013, Chem. Rev., 113, 9043 [Google Scholar]
- van Dishoeck, E. F., Grant, S., Tabone, B., et al. 2023, Faraday Discuss., 245, 52 [NASA ADS] [CrossRef] [Google Scholar]
- van Hemert, M., & van Dishoeck, E. 2008, Chem. Phys., 343, 292 [NASA ADS] [CrossRef] [Google Scholar]
- Visser, R., Bruderer, S., Cazzoletti, P., et al. 2018, A&A, 615, A75 [NASA ADS] [CrossRef] [EDP Sciences] [Google Scholar]
- Vlasblom, M., van Dishoeck, E. F., Tabone, B., & Bruderer, S. 2024, A&A, 682, A91 [NASA ADS] [CrossRef] [EDP Sciences] [Google Scholar]
- Vlasblom, M., Temmink, M., Grant, S. L., et al. 2025, A&A, 693, A278 [NASA ADS] [CrossRef] [EDP Sciences] [Google Scholar]
- Wakelam, V., Gratier, P., Loison, J.-C., et al. 2024, A&A, 689, A63 [NASA ADS] [CrossRef] [EDP Sciences] [Google Scholar]
- Walsh, C., Nomura, H., & van Dishoeck, E. 2015, A&A, 582, A88 [NASA ADS] [CrossRef] [EDP Sciences] [Google Scholar]
- Weber, P., Benítez-Llambay, P., Gressel, O., Krapp, L., & Pessah, M. E. 2018, ApJ, 854, 153 [NASA ADS] [CrossRef] [Google Scholar]
- Weidenschilling, S. J. 1977, MNRAS, 180, 57 [Google Scholar]
- Weingartner, J. C., & Draine, B. T. 2001, ApJ, 548, 296 [Google Scholar]
- Williams, J., Krijt, S., Bitsch, B., Houge, A., & Bergner, J. 2025, MNRAS, 544, 3562 [Google Scholar]
- Woitke, P., Kamp, I., & Thi, W.-F. 2009, A&A, 501, 383 [NASA ADS] [CrossRef] [EDP Sciences] [Google Scholar]
- Woitke, P., Min, M., Pinte, C., et al. 2016, A&A, 586, A103 [NASA ADS] [CrossRef] [EDP Sciences] [Google Scholar]
- Woitke, P., Min, M., Thi, W.-F., et al. 2018, A&A, 618, A57 [NASA ADS] [CrossRef] [EDP Sciences] [Google Scholar]
- Woitke, P., Arabhavi, A. M., Kamp, I., & Thi, W.-F. 2022, A&A, 668, A164 [NASA ADS] [CrossRef] [EDP Sciences] [Google Scholar]
- Woitke, P., Thi, W.-F., Arabhavi, A. M., et al. 2024, A&A, 683, A219 [NASA ADS] [CrossRef] [EDP Sciences] [Google Scholar]
- Wolfire, M. G., McKee, C. F., Hollenbach, D., & Tielens, A. G. G. M. 2003, ApJ, 587, 278 [Google Scholar]
- Zhu, Z., Nelson, R. P., Dong, R., Espaillat, C., & Hartmann, L. 2012, ApJ, 755, 6 [Google Scholar]
- Zsom, A., Ormel, C. W., Güttler, C., Blum, J., & Dullemond, C. P. 2010, A&A, 513, A57 [NASA ADS] [CrossRef] [EDP Sciences] [Google Scholar]
List of hydrocarbons with c-C3H2 cross section in Appendix A.3.
This new chemical network is 10× faster (~31 h CPU for the chemistry of the fiducial model) than the network of Bosman et al. (2022a).
We exported the online KIDA database https://kida.astrochem-tools.org/export/. For this network, the exportation was done in January 2025. We included only gas-phase reactions and removed duplicated reactions, as well as reactions with rate coefficient of 0.
The disk aspect ratio is defined here as a scale height angle. The corresponding flaring angle is thus defined from this scale height angle, and differs from the usual flaring index for which the scale height is in units of distance.
It is further discussed in Sect. 4.5.
See Appendix B.4 for more details about this inconsistency.
Appendix A UV shielding
Appendix A.1 New implementation
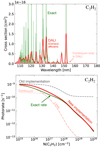 |
Fig. A.1 Top: Difference between the exact cross section of C2H2 (in green) and used in DALI (red, corresponding to the computational efficiency format in the Leiden Database). The light red curve shows only the continuum part of the cross section in the computational efficiency format. Bottom: Improvement of the UV shielding with the new implementation. The green line shows the exact photodissociation rate (computed with the exact cross section). The continuum (dashed red line) and lines (dash-dotted line) correspond, respectively, to the contribution of the dissociation in the continuum (i.e light red curve in the top panel) and in the lines. |
The results from the new implementation of the UV shielding are shown in Fig. A.1. The exact cross section of C2H2 is shown in green in the top panel (Heays et al. 2017). Since it is highly wavelength dependent with many narrow lines, DALI uses the computational efficiency format in the Leiden Database (red in the top panel of Fig. A.1). This format splits the cross section in two parts: lines (if FWHM < 1 nm) and continuum. In the top panel of Fig. A.1, the continuum cross section is highlighted by the light red curve, while the rest of the DALI cross section corresponds to the contribution of the lines. This approach significantly reduces the number of wavelength points (< 500 for the continuum) which avoids very fine sampling of the radiative field. The bottom panel of Fig. A.1 shows how well this approximation agrees with the exact photodissociation rate. As the column density of C2H2 increases, the photodissociation rate drops because the molecule protects itself. The previous implementation, which considered only the continuum cross section (light red in the top panel), is shown as a dashed gray line. The new implementation is shown as a solid red line, for which both the "continuum" and the "lines" cross sections (see the top panel) are taken into account:
![Mathematical equation: $\[k=\int \sigma^{cont}(\lambda) I(\lambda) d \lambda+\sum_{lines } \sigma^{int} I\left(\lambda_0\right) \times \alpha\left(\sigma^{int}, N\right).\]$](/articles/aa/full_html/2026/07/aa58778-25/aa58778-25-eq12.png) (A.1)
(A.1)
The first term corresponds to the dissociation in the continuum, with σcont the continuum cross section (in light red the top panel, and illustrated with the dotted line "continuum" in the bottom panel). The second term corresponds to the dissociation in the lines, with the integrated cross section σint (illustrated in the bottom panel with the dash-dotted line "lines"). The attenuation factor in the lines, α(σint, N), can be expressed as
![Mathematical equation: $\[\alpha=\int \frac{1}{\sqrt{\pi}} e^{-y^2} e^{-\frac{k}{\sqrt{\pi}} e^{-y^2}} d y,\]$](/articles/aa/full_html/2026/07/aa58778-25/aa58778-25-eq13.png) (A.2)
(A.2)
where ![Mathematical equation: $\[\kappa=\sigma^{int} N / \Delta \lambda ~\sqrt{2}\]$](/articles/aa/full_html/2026/07/aa58778-25/aa58778-25-eq14.png) . The FWHM of the Gaussian is set to 1 nm (Δλ = FWHM/2.355) and N is the column density of the absorbing species.
. The FWHM of the Gaussian is set to 1 nm (Δλ = FWHM/2.355) and N is the column density of the absorbing species.
The difference observed between the old and the new implementation at low column densities (NC2H2 < 1017 cm−2) is due to the photodissociation in the lines: as mentioned in Sect. 2.2.1, self-shielding appears first in the lines since cross sections peak ~10-100 times above the continuum. This effect is highlighted by the dash-dotted light red line that drops first, very quickly. This also reflects the importance of photodissociation in lines, by a drop of ~1 order of magnitude at column densities around N = 5 × 1017 cm−2. At higher column densities, the continuum begins to attenuate the UV field (dotted red line). The old implementation reaches a plateau and strongly overestimates the photodissociation rate compared to the exact rate (green). Indeed, C2H2 could still be photodissociated in the lines since their shielding was not taken into account. The new implementation gives a much better estimation at high column densities, almost perfectly matching the exact rate. In the case of C2H2, the slight overestimation of the new implementation at N ~ 1016 cm−2 reflects the limit of approximating narrow lines (< 1 nm) to much wider lines (FWHM = 1 nm), the latter peaking at much smaller values to conserve the total energy absorbed.
Appendix A.2 Mutual shielding
Figure A.2 shows the ability of molecules to protect themselves (self-shielding) and protect other molecules (mutual shielding). The top panel shows the evolution of photodissociation rates of molecules with H2O, C2H2, and CH4 shielding the gas. For the bottom panel, HCN, CO2, and C3 are shielding. The attenuation seen in these figures is only due to gas absorption, dust being excluded. The figure highlights the special role played by water, being the most efficient molecule in protecting other species. We can note that C3 is also particularly efficient, having a broad cross section as well. However, the specific width of the cross section of C3 was assumed from the work of van Hemert & van Dishoeck (2008, see Sect. 4.3.24. in Heays et al. 2017), but it has never been measured experimentally. Its ability to mutually shield thus relies on this assumption. C2H2 can protect water only at high column densities. Regarding HCN, CO2 and CH4, they are not relevant in the mutual shielding. NH3 is relatively unaffected, even with water shielding due to a cross section extending up to 225 nm (Heays et al. 2017).
Appendix A.3 Species with a c − C3H2 cross section
Several species added to the network do not have an available UV cross section in the Leiden Database. For these species, we arbitrarily choose the c-C3H2 UV cross section. The list of species for which the c-C3H2 cross section is used to compute the photodissociation rate is in Table A.1. The c-C3H2 cross section has a line at 250 nm, which means that these hydrocarbons can still be photodissociated in a region shielded by water.
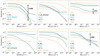 |
Fig. A.2 UV shielding efficiency of six abundant molecules: H2O, C2H2, CH4 (top) and HCN, CO2, C3 (bottom). H2O and C3 are powerful molecules to shield the gas, by reducing the photodissociation rate of most of the molecules by two to three orders of magnitude. On the contrary, CH4 and HCN are not relevant for the mutual shielding. NH3 is relatively unaffected by molecular shielding, as its cross section extends up to 225 nm. |
Species included in the network with the c-C3H2 UV cross section.
For C4H2, we choose the C4H cross section as it should be more appropriate. Indeed, the dissociation of C4H2 leads to C2H and C4H, which are very similar to the dissociation fragments of C4H (C2 and C4). In addition, Silva et al. (2008) found that the dissociation rate of C4H2 is negligible at λ > 180 nm, as is that of C4H.
Appendix A.4 Effect of UV shielding on C2H2
Figure A.3 shows the difference between no UV shielding by the gas (in black) and water UV shielding (in dashed blue). Acetylene is 4 orders of magnitude more abundant where it emits, increasing the emission of the Q branch at 13.7 μm by a factor of 5. However, the red line shows that when we include the shielding from other abundant species (S, Fe, H2O, OH, CO2, HCN, CN, C2H2, C3, C2H4, CH4, and C2H6), the difference is not significant for a solar C/O. It shows that it is indeed the water UV shielding that determines the position of the molecular layer in the inner disk.
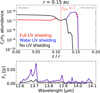 |
Fig. A.3 Top: Vertical cut at r = 0.15 au showing the abundance of acetylene when there is no UV shielding by the gas (black), water UV shielding (blue), or the 12 species mentioned in Sect. 2.2.1 (red). Bottom: C2H2 spectrum for these different UV shielding prescriptions. |
Appendix B Chemistry
Appendix B.1 Initial abundances
Table B.1 indicates the initial elemental abundances for the fiducial model. For the model grid, we vary the C/O ratio by keeping O/H constant and changing C/H. For enhanced O/H, the O/H ratio is increased by a factor of 10, and we vary the C/H ratio to match the desired C/O ratio. We follow the same procedure for the depleted grid, by reducing the O/H ratio by a factor of 10.
Initial abundances for the fiducial model.
Appendix B.2 New species
Table B.2 lists all the species added to the chemical network. It includes all hydrocarbons (CxHy) available in UMIST with fewer than 6 atoms of carbon.
Appendix B.3 Updated endothermicity for KIDA reactions
Table B.3 indicates the list of reactions included in our chemical network with the corrected endothermicity from Tinacci et al. (2023). Table B.4 lists all the reactions that have not been included in the chemical network because the reaction enthalpy is above the threshold of ΔHr > 12, 000 K after the correction of Tinacci et al. (2023). These two tables show that carbon chains with three carbons and five carbons are much less reactive than expected. In particular, the correction makes C3 much more abundant by suppressing its reactivity with H2.
Appendix B.4 Focus on Cn+H2
The reaction H2 + C2 → C2H + H is crucial for the final abundance of C2H2 in the inner disk, since the reaction H2 + C2H → C2H2 + H is very fast. However, NIST and KIDA databases give an inconsistent rate coefficient for this reaction. It does not exist in UMIST (RATE22 Millar et al. 2024), possibly explaining why this reaction has been neglected in studies based on UMIST (Walsh et al. 2015). KIDA reports an activation barrier of 1420 K (Harada et al. 2010), while NIST places this activation energy at 4000 K. In the literature, two values of the activation barrier have been proposed. Pitts et al. (1982) found an activation energy of 1470 K, based on laser experiments at room temperature, while Kruse & Roth (1997) used shock experiments to find that this activation energy should be at 4000 K, for a temperature between 2500 and 4500 K. By extrapolating this latter rate coefficient, we found that it is consistent with the results of Pasternack et al. (1981), but inconsistent with the values from Pitts et al. (1982) tabulated in KIDA. In fact, this disagreement comes from different initial states of C2 when it reacts with H2 (van Dishoeck & Black 1982). The measurements done by Pitts et al. (1982) are related to the singlet X1Σg state of C2 (ground state) from which the reaction proceeds very fast. In contrast, Pasternack et al. (1981) measured it for the metastable triplet state a3Πu of C2 and found an activation energy of Ea = 3000 K, which is consistent with the value adopted in NIST and found by Kruse & Roth (1997, see our Fig. B.1). Under inner disk conditions, we see no reason why C2 would only be in his metastable state, so we decide to consider the rate coefficient with the ground state (Ea = 1500 K) in the chemical network. To verify the activation energy found experimentally by Pitts et al. (1982), M. van Hemert (2025, private communication) performed quantum calculations (multi-reference configuration interaction) and estimated an activation barrier in good agreement with the value of Pitts et al. (1982). Therefore, we add in our network the rate coefficient found by Pitts et al. (1982), which was used in Harada et al. (2010) and available in the KIDA database.
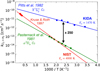 |
Fig. B.1 Inconsistency of the rate coefficient of H2 + C2 → C2H + H between KIDA (blue) and NIST (red) database, coming from a different initial state of C2: the rate coefficient of NIST (Kruse & Roth 1997) corresponds to the triplet state a3Πu according to Pasternack et al. (1981). |
Extending these results to longer pure carbon chains (Cn, n > 2), KIDA, following Harada et al. (2010), uses the same rate coefficient as for C2. Similarly to C2, the reaction with C4 is exothermic, so this assumption seems reasonable. However, only considering the reaction enthalpy with C3 and C5, Tinacci et al. (2023) showed that they are much less reactive with H2 (14287 K and 9780 K). To go further, this might suggest that pure carbon chains with an even number of carbon are much more reactive than those with an odd number of carbon.
Appendix B.5 The reaction C+H2O
The reaction C + H2O → HCO + H can strongly reduce the abundance of hydrocarbons by putting the carbon back to CO (HCO leading to CO). Its reaction rate is known to be very low, with an upper limit of k < 3.6 × 10⁻¹³ cm3.s−1 (Husain & Kirsch 1971, NIST), and might explain why this reaction is missing in UMIST. However, the measurements of Hickson et al. (2016) at low temperature revealed that the reaction rate is much higher than the upper limit of Husain & Kirsch (1971, see our Fig. B.2). This has been interpreted as an efficient quantum tunnelling at low temperature, which allows it to cross the activation barrier. The online KIDA database includes this reaction (leading to "Products"), but as noted by Woitke et al. (2024), the rate is unreasonably high and inconsistent with Husain & Kirsch (1971); Hickson et al. (2016). The ab initio calculations of Li et al. (2017) confirmed that the rate is indeed low at high temperature (see Fig. B.2), consistent with Husain & Kirsch (1971), which means that tunnelling is not efficient in this regime. We decided to include this reaction in our chemical network by adopting the reaction rate of Hickson et al. (2016) at low temperature and Li et al. (2017) at high temperature (in red in Fig. B.2). The reaction rate is uncertain between T ~ 200 − 500 K, so we fitted the data points with a modified Arrhenius law for two separate temperature ranges and extrapolated the low temperature rate until 500 K:
![Mathematical equation: $\[k(T)= \begin{cases}1.314 \times 10^{-13}\left(\frac{T}{300}\right)^{-4.394} e^{-112.9 / T} & \text { if } \mathrm{T} \in[10,500] ~\mathrm{K} \\ 1.502 \times 10^{-15}\left(\frac{T}{300}\right)^{4.522} e^{-125.7 / T} & \text { if } \mathrm{T} \in[500,1000] ~\mathrm{K}\end{cases}\]$](/articles/aa/full_html/2026/07/aa58778-25/aa58778-25-eq17.png) (B.1)
(B.1)
New species added to the chemical network.
Reactions from KIDA corrected with the endothermicity found by Tinacci et al. (2023).
Reactions corrected with the reaction enthalpy found by Tinacci et al. (2023), but not included in the chemical network.
The emission of C2H2 is reduced by ~ 30% in the fiducial model, due to a lower abundance around 0.3–0.7 au, where the temperature is below 300 K.
Appendix B.6 Key reactions in KIDA missing in UMIST
The difference up to three orders of magnitude in C2H2 abundance between a chemical network based on UMIST+KIDA and based only in UMIST (Fig. 7) can be explained by seven key reactions in KIDA, listed in Table B.5. Five of these seven reactions are H-abstractions revealing the crucial role of H2 in the formation of C2H2. The rate coefficients of Cn + H2 and CnH + H2 are the same as C2 + H2 and C2H + H (Harada et al. 2010).
Key reactions from KIDA explaining the difference between the chemical network based on UMIST+KIDA and UMIST only.
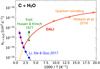 |
Fig. B.2 Rate coefficient of the reaction C + H2O → HCO + H adopted in this work (red). This rate is in agreement with the upper limit of Husain & Kirsch (1971), the ab initio calculations of Li et al. (2017) and the measurements of Hickson et al. (2016). |
Appendix C Line overlap
Figure C.1 shows the result of including the line overlap for the ray-tracing of C2H2 (in red). It does not significantly reduce acetylene emission in the Q branch. The presence of the pseudo-continuum near λ = 13.74 μm reveals that there is still optically thick emission of C2H2, originating from the deepest layers in its emitting regions.
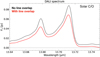 |
Fig. C.1 DALI spectrum of the Q branch of C2H2 at 13.7 μm without line overlap (in black) and with line overlap (in red). With a solar C/O, the difference is not significant in the Q branch (factor 1.5) whereas it is more pronounced in the pseudo-continuum (factor ~ 4 near λ = 13.74 μm). |
Appendix D Depleted O/H grid
Figure D.1 presents the C2H2 and H2O emissions obtained with the depleted O/H grid (10 times less oxygen than the fiducial grid) to mimic late times in protoplanetary disks, where the water vapor is advected onto the star and the metal-poor gas from the outer disk is reaching the inner regions (Mah et al. 2023; Sellek & van Dishoeck 2025). The decrease in oxygen, which enhances C2H2 formation, is balanced by a water shielding becoming less effective, leading to an increase of a factor of 2 in acetylene emission. The effect of the oxygen depletion is stronger for H2O, shifting the grid to the left side (small H2O emission) rather than the top left.
Appendix E Other parameters
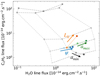 |
Fig. E.1 Same as Fig. 4c but showing the impact of amin (black), amax (green), ψ (blue), and LX (orange). The fiducial grid is shown in gray. |
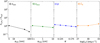 |
Fig. E.2 Evolution of the line flux ratio C2H2/H2O with the minimum and maximum grain size, the flaring angle, and the X-ray luminosity. |
Figure E.1 presents the results for the other parameters explored in this work: the minimum and maximum grain size amin and amax, the flaring angle ψ and the X-ray luminosity LX. As mentioned in Sect. 3.2.2, increasing amin lowers the opacity in the upper atmosphere, pushing deeper the molecular emitting layers, but keeping the dust emitting layer the same. It reduces C2H2 emission as less acetylene is above the τdust = 1 surface. Water is less affected by the dust continuum as it emits higher up. Pushing its emission into denser layers increases its emission. An increase of 6 orders of magnitude in the X-ray luminosity increases C2H2 and H2O emission by only a factor of 3, showing that these two molecules are not sensitive to X-rays. In particular, it confirms that X-rays are important for both the formation and destruction of C2H2, thus canceling their effect on C2H2 emission.
Figure E.2 shows the evolution of the line flux ratio C2H2/H2O with these parameters (amin, amax, ψ, LX). Considering the two-orders-of-magnitude variation in the observed C2H2/H2O line flux ratio (Grant et al. 2025), these parameters can be considered irrelevant compared to C/O, O/H, or q.
Appendix F Model with C/O = 1.5
Figure F.1e presents the result for a model with C/O > 1 (other parameters fixed to the values in the fiducial model). It reveals the dramatic difference with abundances maps of C/O < 1. C2H2 is abundant almost everywhere, and its emitting region is much more extended than with C/O < 1. On the contrary, water is much less abundant and emits from a smaller region, closer to the star. Figure F.1d also interestingly shows that the UV field map is significantly different than when the C/O < 1: this time, C2H2 and C3 absorb the UV photons instead of water with the footprint of C2H2 around r ~ 0.5-5 au.
The H/H2 transition is much higher compared to C/O < 1, mainly due to the fact that H2 is no longer destroyed by the warm oxygen chemistry leading to OH and H2O. However, just above the surface where C2H2 becomes abundant, the hydrogen becomes atomic again. In this layer, it is the warm carbon chemistry that consumes H2, as it was with oxygen in C/O < 1. Indeed, H2 is destroyed by the reactions
![Mathematical equation: $\[\mathrm{C}_2+\mathrm{H}_2 \rightarrow \mathrm{C}_2 \mathrm{H}+\mathrm{H}\]$](/articles/aa/full_html/2026/07/aa58778-25/aa58778-25-eq49.png) (F.1)
(F.1)
![Mathematical equation: $\[\mathrm{C}_2 \mathrm{H}+\mathrm{H}_2 \rightarrow \mathrm{C}_2 \mathrm{H}_2+\mathrm{H}.\]$](/articles/aa/full_html/2026/07/aa58778-25/aa58778-25-eq50.png) (F.2)
(F.2)
Then, C2H2 reacts with C to form C3. This layer is still strongly irradiated (G0 ~ 106), photodissociating C3 to produce C2. Thus, this layer creates a loop between C2 and C3 which consumes H2. This layer is irradiated enough to photodissociate C3 but not C2, creating a sweet spot where H2 would be dramatically destroyed. Indeed, in upper layers, C2 is photodissociated as well, and in deeper layer, C3 can survive to the UV field. Therefore, this loop is broken for layers above or below this specific region.
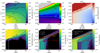 |
Fig. F.1 Disk structure of the fiducial model but with C/O = 1.5. Top panels: Gas density, gas-to-dust ratio, and gas temperature. Bottom panels: Normalized UV field G0 (Habing units) and the abundance of H2O and C2H2. The white lines indicate the 300 K and 700 K gas temperature contours. The bottom solid red line shows the dust optically thick surface (τdust = 1 at 14 μm), while the dashed red line represents the surface where τline = 1. The red contours correspond to 80% of the total emitting flux. The dashed orange line in the bottom panels indicates the H/H2 transition, sometimes difficult to distinguish from the dashed black line G0 = 105. |
All Tables
Reactions from KIDA corrected with the endothermicity found by Tinacci et al. (2023).
Reactions corrected with the reaction enthalpy found by Tinacci et al. (2023), but not included in the chemical network.
Key reactions from KIDA explaining the difference between the chemical network based on UMIST+KIDA and UMIST only.
All Figures
|
Fig. 1 Disk structure of the fiducial model. Top panels: gas density, local gas-to-dust ratio, and gas temperature. Bottom panels: normalized UV field G0 (Habing units) and the abundance of H2O and C2H2. The white lines indicate the 300 K and 700 K gas temperature contours. The bottom solid red line shows the dust optically thick surface (τdust = 1 at 14 μm), while the dashed red line represents the surface where τline = 1. The red contours correspond to 80% of the total emitting flux. The dashed orange line in the bottom panels indicate the H/H2 transition, which is sometimes difficult to distinguish from the dashed black line, G0 = 105. |
| In the text | |
|
Fig. 2 DALI synthetic spectrum of C2H2 (red) and H2O (blue) for the fiducial model. The total spectrum is shown in black. The spectral resolution is λ/Δλ = 2000 to mimic a JWST/MIRI spectrum. Although the fiducial model is richer in oxygen, the C2H2 feature stands out clearly from the forest of water lines. |
| In the text | |
|
Fig. 3 Top: vertical cut at r = 0.15 au showing the abundances of several key atoms and molecules. Middle: Irradiation conditions in this vertical cut, with |
| In the text | |
|
Fig. 4 Left: result from the fiducial grid. The orange, green, and blue points correspond to gd = 102, 103, and 104, respectively. The black lines highlight a constant C/O ratio. Middle: result obtained for the “enhanced O/H” grid: O/H×10 (C/H is scaled with the C/O ratio). The fiducial grid is overlaid in gray for reference. Right: Results for the disk aspect ratio, hC (orange), power law index of the dust distribution, q (in blue) with gd = 103. |
| In the text | |
|
Fig. 5 Evolution of the line flux ratio C2H2/H2O with the elemental abundances (C/O and O/H), gas-to-dust mass ratio (gd), power law index (q), and disk aspect ratio (hC), from left to right. The fiducial model with C/O=0.47 is adopted in panels (c), (d), and (e), except for the parameters that are varied. |
| In the text | |
|
Fig. 6 DALI synthetic spectra of the fiducial model (left) and a model with O/H x10 (right). The Q branch of C2H2 (black) and the water lines (blue) used for the line flux around 17.25 μm are shown together for clarity. The carbon and oxygen budget itself acts similarly to a decrease in the C/O ratio: the flux of water increases while acetylene decreases. |
| In the text | |
|
Fig. 7 Vertical cut at r = 0.15 au showing the abundance of C2H2 (top) and the corresponding spectrum (bottom) for two chemical networks: the fiducial (in red) and the one based on UMIST only (including also three-body reactions and C + H2O → HCO + H). |
| In the text | |
|
Fig. 8 Emitting column density ratio (above the surface τdust = 1 at 14 μm and Tgas > 500 K) of C2H2 obtained for chemical networks including various maximum number of carbon in hydrocarbons. The reference is the fiducial network including 5 atoms of carbon (5C, in red). |
| In the text | |
|
Fig. 9 Vertical column densities at r = 0.15 au for hydrocarbons. The total vertical column density is shown in blue. The red dots represent the emitting column density (above the surface τdust = 1 at 14 μm and Tgas > 500 K). While CH4 is the major hydrocarbon, C2H2 is dominant in the emitting layers. |
| In the text | |
|
Fig. 10 DALI synthetic spectra for two dust settling prescriptions. Left: fiducial spectrum with self-consistent dust settling (Riols settling; Riols & Lesur 2018). Right: spectrum obtained with the two-pop settling prescription, based on two dust populations (small and large). The two-pop settling reduces water emission by a factor of 2. |
| In the text | |
|
Fig. 11 Same as Fig. 4 but showing the line-to-continuum ratios for acetylene and water. Panel c: influence of the parameters covered in this work: black for C/O, red for O/H, green for gd, blue for q, and orange for hC. MINDS observations are shown with gray squares, with fluxes exported from Grant et al. (2025). We include only T Tauri full disks, without cavities. This plot suggests that a C/O > 1 is excluded in T Tauri disks, and most of the disks are better reproduced by a high O/H or low C/O. |
| In the text | |
|
Fig. 12 Distribution of the line flux ratio C2H2/H2O observed by JWST (Grant et al. 2025) compared to the parameters explored in this work. Three parameters stand out to explain this spread: C/O, O/H or q. A C/O > 1 seems excluded for inner disks of T Tauri stars. |
| In the text | |
|
Fig. 13 Temperature and effective radius (corresponding to an emitting area πR2) of C2H2 emission retrieved from slab models on DALI predicted spectra. Red crosses indicate DALI models with solar C/O and gd = 102, 103, 104, while the green cross corresponds to C/O = 1.5 and gd = 103. JWST observations of 2 disks are shown in gray (Grant et al. 2023; Colmenares et al. 2024). |
| In the text | |
|
Fig. A.1 Top: Difference between the exact cross section of C2H2 (in green) and used in DALI (red, corresponding to the computational efficiency format in the Leiden Database). The light red curve shows only the continuum part of the cross section in the computational efficiency format. Bottom: Improvement of the UV shielding with the new implementation. The green line shows the exact photodissociation rate (computed with the exact cross section). The continuum (dashed red line) and lines (dash-dotted line) correspond, respectively, to the contribution of the dissociation in the continuum (i.e light red curve in the top panel) and in the lines. |
| In the text | |
|
Fig. A.2 UV shielding efficiency of six abundant molecules: H2O, C2H2, CH4 (top) and HCN, CO2, C3 (bottom). H2O and C3 are powerful molecules to shield the gas, by reducing the photodissociation rate of most of the molecules by two to three orders of magnitude. On the contrary, CH4 and HCN are not relevant for the mutual shielding. NH3 is relatively unaffected by molecular shielding, as its cross section extends up to 225 nm. |
| In the text | |
|
Fig. A.3 Top: Vertical cut at r = 0.15 au showing the abundance of acetylene when there is no UV shielding by the gas (black), water UV shielding (blue), or the 12 species mentioned in Sect. 2.2.1 (red). Bottom: C2H2 spectrum for these different UV shielding prescriptions. |
| In the text | |
|
Fig. B.1 Inconsistency of the rate coefficient of H2 + C2 → C2H + H between KIDA (blue) and NIST (red) database, coming from a different initial state of C2: the rate coefficient of NIST (Kruse & Roth 1997) corresponds to the triplet state a3Πu according to Pasternack et al. (1981). |
| In the text | |
|
Fig. B.2 Rate coefficient of the reaction C + H2O → HCO + H adopted in this work (red). This rate is in agreement with the upper limit of Husain & Kirsch (1971), the ab initio calculations of Li et al. (2017) and the measurements of Hickson et al. (2016). |
| In the text | |
|
Fig. C.1 DALI spectrum of the Q branch of C2H2 at 13.7 μm without line overlap (in black) and with line overlap (in red). With a solar C/O, the difference is not significant in the Q branch (factor 1.5) whereas it is more pronounced in the pseudo-continuum (factor ~ 4 near λ = 13.74 μm). |
| In the text | |
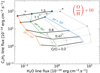 |
Fig. D.1 Same as Fig. 4b but showing the depleted O/H grid. |
| In the text | |
|
Fig. E.1 Same as Fig. 4c but showing the impact of amin (black), amax (green), ψ (blue), and LX (orange). The fiducial grid is shown in gray. |
| In the text | |
|
Fig. E.2 Evolution of the line flux ratio C2H2/H2O with the minimum and maximum grain size, the flaring angle, and the X-ray luminosity. |
| In the text | |
|
Fig. F.1 Disk structure of the fiducial model but with C/O = 1.5. Top panels: Gas density, gas-to-dust ratio, and gas temperature. Bottom panels: Normalized UV field G0 (Habing units) and the abundance of H2O and C2H2. The white lines indicate the 300 K and 700 K gas temperature contours. The bottom solid red line shows the dust optically thick surface (τdust = 1 at 14 μm), while the dashed red line represents the surface where τline = 1. The red contours correspond to 80% of the total emitting flux. The dashed orange line in the bottom panels indicates the H/H2 transition, sometimes difficult to distinguish from the dashed black line G0 = 105. |
| In the text | |
Current usage metrics show cumulative count of Article Views (full-text article views including HTML views, PDF and ePub downloads, according to the available data) and Abstracts Views on Vision4Press platform.
Data correspond to usage on the plateform after 2015. The current usage metrics is available 48-96 hours after online publication and is updated daily on week days.
Initial download of the metrics may take a while.