


Fig. F.1
Download original image
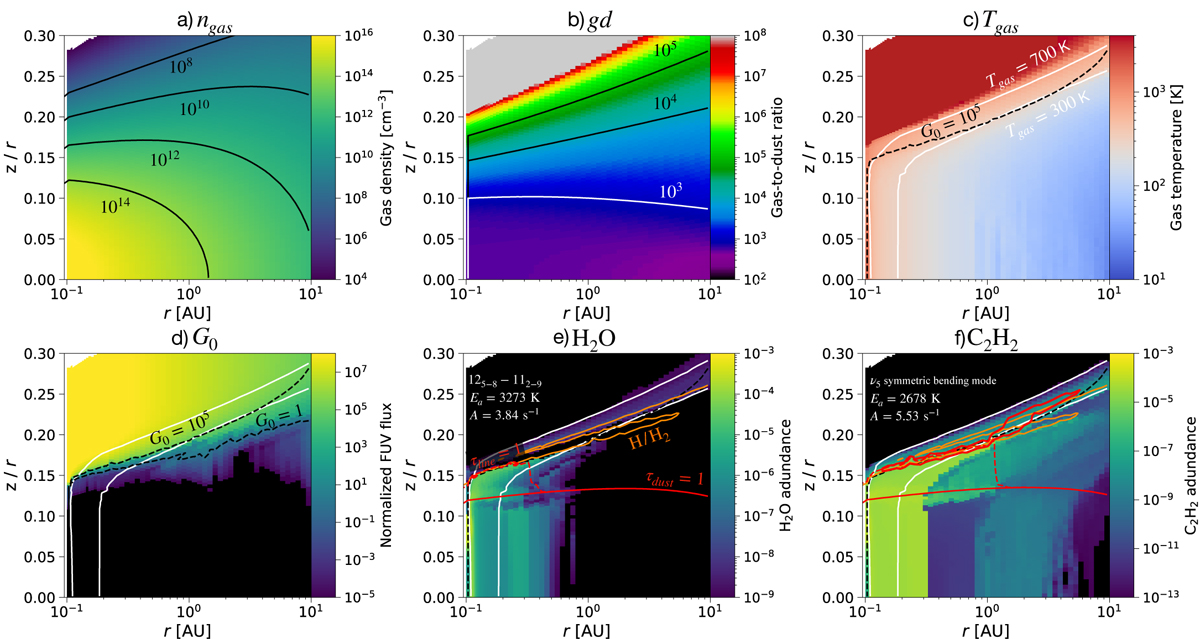
Disk structure of the fiducial model but with C/O = 1.5. Top panels: Gas density, gas-to-dust ratio, and gas temperature. Bottom panels: Normalized UV field G0 (Habing units) and the abundance of H2O and C2H2. The white lines indicate the 300 K and 700 K gas temperature contours. The bottom solid red line shows the dust optically thick surface (τdust = 1 at 14 μm), while the dashed red line represents the surface where τline = 1. The red contours correspond to 80% of the total emitting flux. The dashed orange line in the bottom panels indicates the H/H2 transition, sometimes difficult to distinguish from the dashed black line G0 = 105.
Current usage metrics show cumulative count of Article Views (full-text article views including HTML views, PDF and ePub downloads, according to the available data) and Abstracts Views on Vision4Press platform.
Data correspond to usage on the plateform after 2015. The current usage metrics is available 48-96 hours after online publication and is updated daily on week days.
Initial download of the metrics may take a while.