


Fig. A.1
Download original image
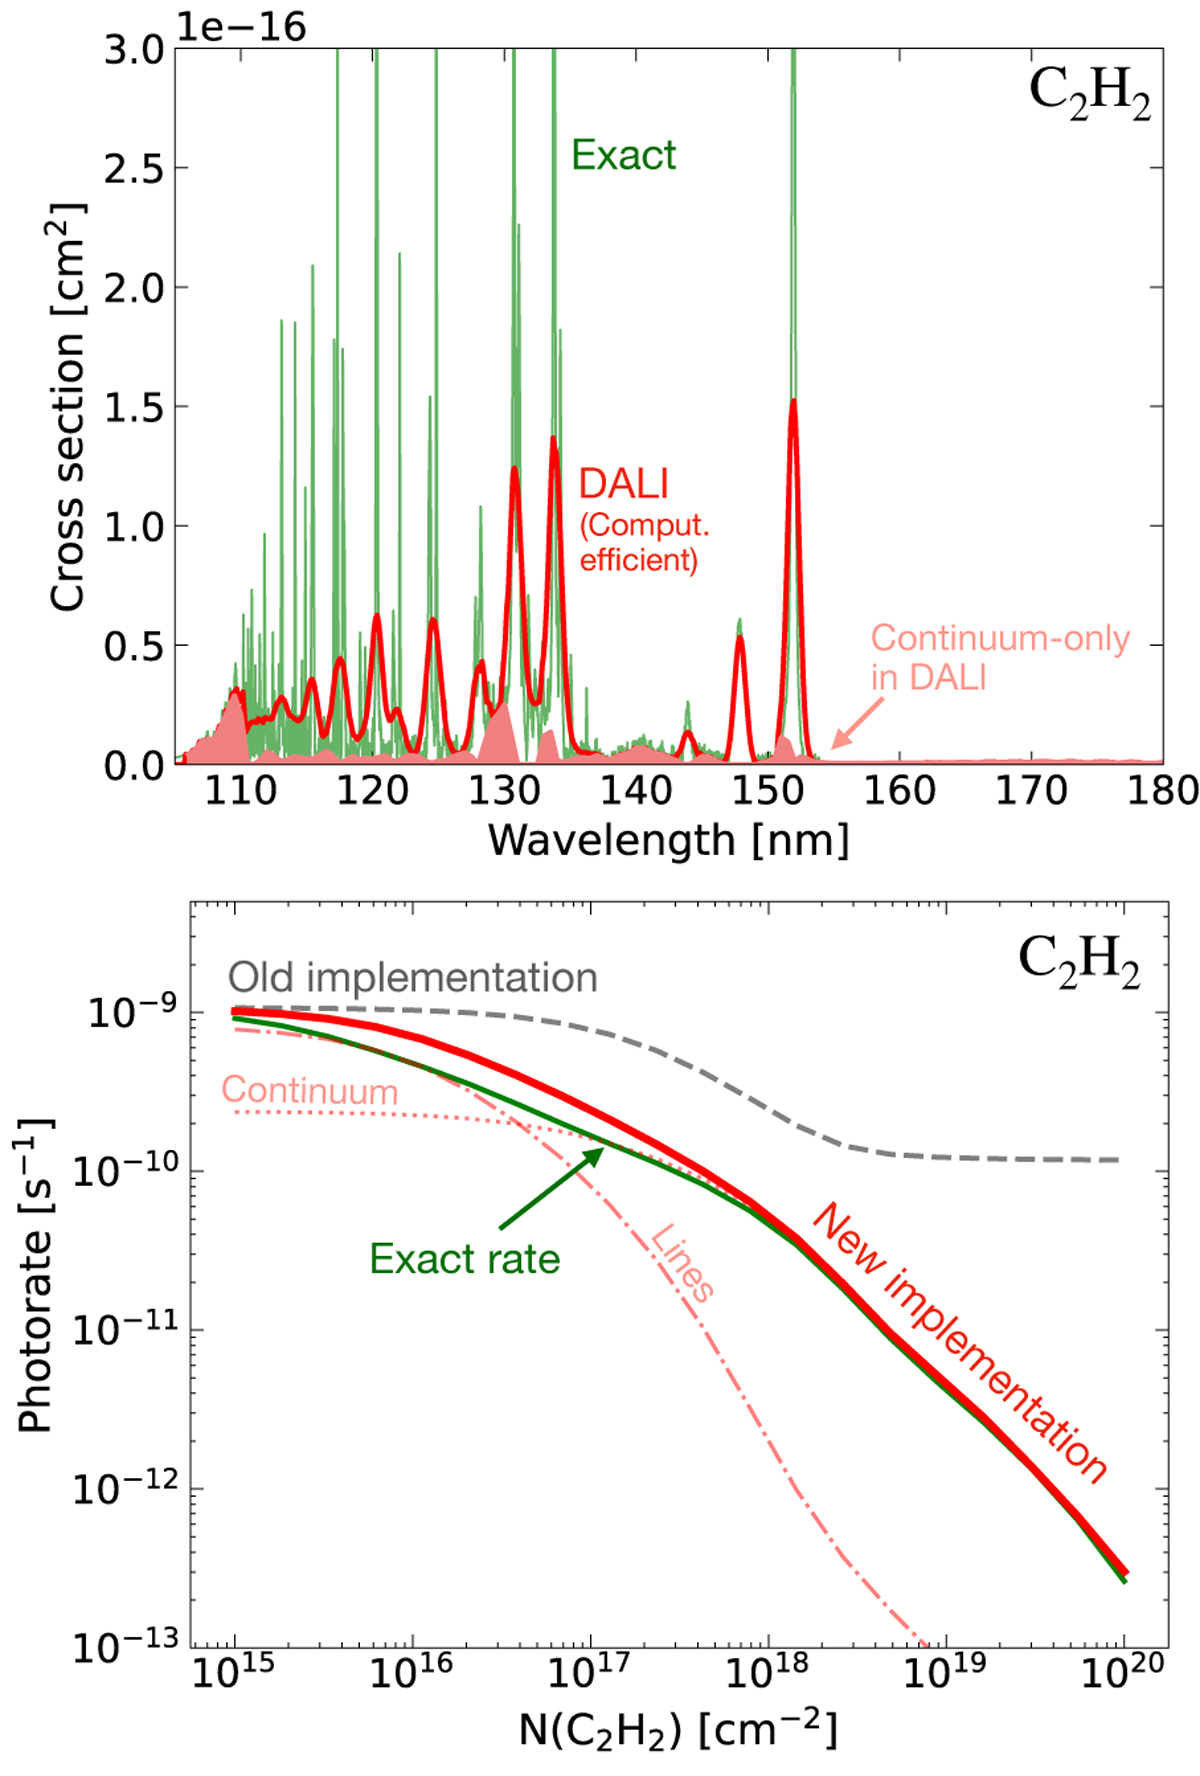
Top: Difference between the exact cross section of C2H2 (in green) and used in DALI (red, corresponding to the computational efficiency format in the Leiden Database). The light red curve shows only the continuum part of the cross section in the computational efficiency format. Bottom: Improvement of the UV shielding with the new implementation. The green line shows the exact photodissociation rate (computed with the exact cross section). The continuum (dashed red line) and lines (dash-dotted line) correspond, respectively, to the contribution of the dissociation in the continuum (i.e light red curve in the top panel) and in the lines.
Current usage metrics show cumulative count of Article Views (full-text article views including HTML views, PDF and ePub downloads, according to the available data) and Abstracts Views on Vision4Press platform.
Data correspond to usage on the plateform after 2015. The current usage metrics is available 48-96 hours after online publication and is updated daily on week days.
Initial download of the metrics may take a while.