| Issue |
A&A
Volume 708, April 2026
|
|
|---|---|---|
| Article Number | A318 | |
| Number of page(s) | 11 | |
| Section | Extragalactic astronomy | |
| DOI | https://doi.org/10.1051/0004-6361/202558424 | |
| Published online | 21 April 2026 | |
AGN obscuration in optical and X-rays: Host properties and the interplay of nuclear and galactic gas and dust in a combined SDSS–XMM sample
1
Instituto de Física de Cantabria (CSIC–Universidad de Cantabria), Avenida de los Castros, 39005 Santander, Spain
2
European Space Agency (ESA), European Space Astronomy Centre (ESAC), Camino Bajo del Castillo s/n, 28692 Villanueva de la Cañada, Madrid, Spain
3
Department of Astronomy, University of Geneva, ch. d’Ecogia 16, 1290 Versoix, Switzerland
4
INAF–Osservatorio Astronomico di Roma, Via Frascati 33, 00078 Monteporzio Catone, Italy
5
Department of Physics, Gustaf Hällströmin katu 2, 00014 University of Helsinki, Finland
6
IRAP, Université de Toulouse, CNRS, UPS, CNES, 9 Avenue du Colonel Roche, BP 44346, 31028 Toulouse Cedex 4, France
★ Corresponding author: This email address is being protected from spambots. You need JavaScript enabled to view it.
Received:
5
December
2025
Accepted:
11
March
2026
Abstract
We investigate the link between optical obscuration and X-ray absorption in active galactic nuclei (AGNs) by combining X-ray spectroscopy from 4XMM-DR11 with SDSS DR16Q spectroscopy. Bayesian X-ray spectral fits were obtained within the XMM2Athena project, and host-galaxy properties were derived via CIGALE spectral energy distribution (SED) fitting. Our final sample comprises 241 X-ray AGNs at z < 1.9. For 172 sources (∼70%), the optical broad-line (BL) or narrow-line (NL) classification agrees with their X-ray obscuration based on NH, but two mismatched populations emerge. Eleven BL AGNs show signs of X-ray absorption (BLAbs) and elevated gas-to-dust ratios compared to BL AGN, consistent with dust-free or host-scale absorbers. Conversely, 58 NL AGN appear unobscured in X-rays (NLUnabs) and low gas-to-dust ratios. Nearly half are assigned type 1 properties by SED fitting, suggesting diluted or intrinsically weak BL regions, host contamination, or variability. Optical line diagnostics support this picture: NL AGNs show higher Balmer decrements than NLUnabs, indicating stronger extinction and different ionization conditions. Host diagnostics further reinforce the contrasts: at z < 0.8, NLUnabs show star-formation rates and accretion efficiencies that are comparable to BL AGNs, whereas NL AGNs reside in more quiescent hosts with lower star formation and less efficient black-hole growth. BLAbs match BL AGNs in terms of host and accretion properties, with their peculiarity lying in excess X-ray absorption. These findings demonstrate that obscuration arises not only from orientation but also from multi-scale distributions of gas and dust. Identifying such mismatched populations will be crucial for interpreting AGN demographics in ongoing and upcoming surveys such as Euclid and VRO/LSST.
Key words: dust / extinction / galaxies: active / galaxies: evolution / galaxies: ISM / galaxies: nuclei
© The Authors 2026
 Open Access article, published by EDP Sciences, under the terms of the Creative Commons Attribution License (https://creativecommons.org/licenses/by/4.0), which permits unrestricted use, distribution, and reproduction in any medium, provided the original work is properly cited.
This article is published in open access under the Subscribe to Open model. This email address is being protected from spambots. You need JavaScript enabled to view it. to support open access publication.
1. Introduction
Active galactic nuclei (AGN) are among the most powerful manifestations of accretion onto supermassive black holes (SMBHs) and play a fundamental role in the evolution of galaxies. Their energetic output, spanning from X-rays to the infrared (IR) and radio, can regulate the growth of galaxies by heating, expelling, or redistributing gas through feedback processes (e.g. Kormendy & Ho 2013; Harrison 2017). AGN are observed across a wide range of luminosities and host environments, with diverse observational signatures in the X-ray, optical, and IR regimes (e.g. Urry & Padovani 1995; Hickox & Alexander 2018). This diversity reflects the complex interplay between SMBH fueling, host-galaxy conditions, and obscuration by gas and dust.
Understanding the nature of AGN obscuration is therefore central to disentangling the connection between SMBHs and their hosts. In the simplest unification scenario, the observed AGN type depends primarily on orientation with respect to a circumnuclear dusty torus (Antonucci 1993; Urry & Padovani 1995). However, it has become increasingly clear that orientation alone cannot explain the full range of observed obscuration properties. Recent models highlight the importance of additional ingredients, including evolutionary stages linked to gas inflows and outflows (e.g. Hopkins et al. 2006; Hickox et al. 2009; Ricci et al. 2017), as well as the contribution of host-galaxy scale material such as dust lanes or circumnuclear star formation (e.g. Buchner & Bauer 2017; Malizia et al. 2020). These ‘intermediate’ scenarios posit that both nuclear and host-scale processes contribute to shaping obscuration.
A direct way to probe obscuration is to compare diagnostics at different wavelengths. X-rays trace line-of-sight gas through the equivalent neutral hydrogen column density (NH), while optical and IR indicators are sensitive to dust extinction. Although several studies have found broad correlations between optical/IR obscuration and X-ray absorption (e.g. Civano et al. 2012; Merloni et al. 2014), the relation shows substantial scatter (e.g. Jaffarian & Gaskell 2020). Multiple factors likely contribute, including: (i) variability in NH on timescales of months to years (e.g. Reichert et al. 1985; Yang et al. 2016), (ii) absorbing material on galactic scales unrelated to the nuclear torus (e.g. Goulding et al. 2012; Malizia et al. 2020), (iii) differences in the column densities probed by X-ray, optical, and IR diagnostics (e.g. Masoura et al. 2020; Mountrichas et al. 2020), and (iv) dust-to-gas ratios that deviate from the Galactic average, either due to dust-poor gas or dust-rich environments (e.g. Maiolino et al. 2001; Burtscher et al. 2016; Ricci et al. 2017). As a result, significant populations of AGNs are found to be obscured in one wavelength regime but not in another. Examples include optical type 1 AGNs with strong X-ray absorption and, conversely, optically narrow-line (NL) AGNs with little or no X-ray obscuration (e.g. Merloni et al. 2014; Lansbury et al. 2015; Mountrichas et al. 2020, 2021a; Barquín-González et al. 2024).
These mismatches manifest in various forms: some AGNs show strong X-ray absorption with little optical reddening (dust-free gas), others appear heavily X-ray absorbed yet still display broad UV/optical lines (e.g. Li et al. 2019), and conversely, optically reddened AGNs with absorbed spectral energy distributions (SEDs) may exhibit little or no X-ray obscuration (e.g. Masoura et al. 2020). In some cases, the X-ray absorption exceeds that expected from the measured optical extinction (e.g. Granato et al. 1997; Merloni et al. 2014). This complexity highlights the need for joint X-ray and optical analyses to disentangle nuclear from host-scale effects.
Another compelling piece of evidence for the complexity of AGN obscuration comes from the class of so-called changing-look AGNs (CLAGNs). These are systems that exhibit dramatic transitions between optical type 1 and type 2 classifications on timescales of months to years (e.g. LaMassa et al. 2015; MacLeod et al. 2016; Yang et al. 2018; Ricci et al. 2020; Hon et al. 2022). Such transitions are often driven by intrinsic changes in the accretion rate or structure of the broad-line (BL) region rather than by variable line-of-sight obscuration alone. Interestingly, X-ray variability in these sources does not always mirror the optical changes, suggesting that the mechanisms regulating obscuration and ionizing output may operate on distinct spatial or physical scales. The existence of CLAGN thus reinforces the notion that both orientation and intrinsic accretion variability contribute to the observed diversity of AGN classifications, complementing the population-wide approach adopted in this study.
The goal of this work is to investigate AGN populations that exhibit inconsistent X-ray and optical classifications, probing the physical origins of their obscuration using extensive X-ray spectral and optical spectroscopic data from wide-area surveys and host-galaxy properties derived via SED fitting. Our focus is on quantifying the agreement and disagreement between optical and X-ray classifications, characterizing the outlier populations, and exploring their gas-to-dust ratios, emission-line diagnostics, and host-galaxy properties.
The paper is structured as follows. Section 2 describes the data. Section 3 outlines the sample selection and the classification methods. Section 4 presents the main results and discusses the physical interpretation of AGN populations in the context of multi-scale obscuration. Section 5 summarizes our main findings.
2. Data
In this work we use X-ray AGNs from the XMM–Newton 4XMM-DR11 catalogue (Webb et al. 2020), analysed within the framework of the XMM2Athena project (Webb et al. 2023; Viitanen et al. 2025). The XMM2Athena pipeline provides homogeneous source classification, photometric redshifts, and X-ray spectral fitting for 4XMM sources, facilitating consistent multiwavelength analyses. The 4XMM-DR11 catalogue is the fourth generation of serendipitous X-ray source catalogues produced by the Survey Science Centre, containing 319 565 detections from 11 907 observations, corresponding to 210 444 unique sources with spectra. Source classification follows the scheme of Tranin et al. (2022), who cross-matched XMM detections with external catalogues of AGNs, stars, and Galactic sources. Cross-matching the 4XMM-DR11 sources with their catalogue yielded 92 238 classified objects, including 76 610 AGN. Photometric redshifts were derived using the methodology of Ruiz et al. (2018), which combines optical (SDSS or PanSTARRS) counterparts with near- and mid-IR data when available, employing the MLZ–TPZ machine-learning algorithm (Carrasco Kind & Brunner 2013). Spectroscopic redshifts from SDSS are available for about 8500 sources, leading to 35 538 AGNs with redshift information overall (see also Viitanen et al. 2025).
The X-ray spectral analysis was also carried out within the XMM2Athena framework using the BXA package (Buchner et al. 2014), which connects XSPEC (Arnaud 1996) with the nested-sampling algorithm ULTRANEST (Buchner 2019, 2021). The spectra were analysed in a Bayesian framework using uninformative priors, and the fits were performed with the Cash statistic, which is appropriate for Poisson-distributed data in the low-count regime. A redshifted absorbed power-law model with Galactic absorption, cflux*tbabs(ztbabs*zpowerlaw), was applied. The Galactic hydrogen column density was fixed to the total column density along the line of sight, while the intrinsic absorber at the source redshift was left free. Background spectra were first modelled separately using the bxa.sherpa.background module, which accounts for instrumental, cosmic, and Galactic components, and the resulting background shape was then kept fixed during the source fitting apart from its normalization. Mode values of the posterior distributions of NH, Γ, and fluxes (in the 2–10 keV band) were adopted as the most probable parameter estimates, and intrinsic luminosities, LX, were computed after correcting for absorption. Reliable X-ray spectral measurements are available for 30 653 AGNs. Further details of the fitting procedure are given in Viitanen et al. (2025).
The aim of our study is to compare X-ray absorption with optical obscuration and identify AGN populations that are optically obscured but X-ray unobscured, and vice versa. To this end, we used the Wu & Shen (2022) catalogue, which provides emission-line and continuum properties for more than 750 000 quasars from SDSS DR16.
The catalogue is based on a homogeneous spectral fitting procedure that models both the continuum and the main emission-line complexes (e.g. Hα, Hβ, Mg II, C IV). For the Balmer lines (Hα, Hβ), the fits include multiple Gaussian components: a narrow core and one or more broad components when statistically justified. For Hα, the neighbouring [N II] and [S II] lines are simultaneously modelled, while for Hβ the [O III] doublet is fitted alongside. Similarly, Mg II and C IV are decomposed into narrow and broad components, with additional Gaussians where necessary to capture asymmetric wings.
For each line, Wu & Shen (2022) provide both total and broad-component measurements (the latter denoted by the suffix _BR). The total profile includes all fitted Gaussian components, while the _BR quantities correspond to the isolated broad component when present. For narrow lines such as [O III] λ5007, they also report a ‘core’ measurement obtained after subtracting potential blue wings. These measurements, particularly the total full width at half maximum (FWHM) of Hβ and Mg II, together with the total [O III] properties, form the basis of our spectroscopic classifications in this work.
The host galaxy properties were derived through SED fitting with the CIGALE code (Boquien et al. 2019; Yang et al. 2020, 2022). In this work, we use the measurements presented in Mountrichas et al. (2024d). In brief, the stellar component was modelled with a delayed star-formation history (SFH) of the form SFR(t)∝t exp(−t/τ), complemented by a starburst episode represented as a constant 50 Myr period of ongoing star formation (Małek et al. 2018; Buat et al. 2019). Stellar emission was generated using the single stellar population templates of Bruzual & Charlot (2003) and attenuated according to the law of Charlot & Fall (2000). Nebular emission was added using the templates of Villa-Velez et al. (2021), while dust emission heated by stars was described with the models of Dale et al. (2014), excluding any AGN contribution. The AGN emission itself was modelled with the SKIRTOR templates (Stalevski et al. 2012, 2016). Finally, CIGALE also accounts for X-ray emission, and in the fitting procedure the intrinsic LX in the 2–10 keV band was used. The parameter space explored during the SED fitting is given in Table 1 of Mountrichas et al. (2024d).
3. Analysis
In this section, we describe the procedure followed to build the final AGN catalogue used in our analysis, together with the criteria adopted for the optical classification of the sources. We also present the scheme used to classify AGNs based on measurements derived from SED fitting.
3.1. Selection criteria
From the initial sample of 35 538 AGNs in our catalogue, we selected those flagged as flag = 0 in the XMM2Athena catalogue. A detailed description of the flag definitions is provided in Viitanen et al. (2025). Briefly, sources with flag = 0 correspond to cases where both the background and source spectral fits have a p value greater than 0.01, the adopted threshold for acceptable fits. This criterion yielded 30 653 AGNs.
To ensure robust estimates of the host-galaxy properties, we required reliable multi-wavelength photometry. Specifically, we considered only sources with available measurements in SDSS or Pan-STARRS, 2MASS, and WISE, covering the following bands: u, g, r, i, z, y, J, H, K, W1, W2, and W4 (e.g. Mountrichas et al. 2021a,b, 2022a,b, 2024a; Buat et al. 2021; Mountrichas & Shankar 2023). This requirement was satisfied by 2 460 AGNs, all of which also have W3 photometry available, although it was not explicitly required. For these sources, we performed SED fitting using the templates and parameter space described in Sect. 2.
To restrict the analysis to the most reliable host-galaxy measurements, we excluded poorly fitted SEDs by requiring a reduced χred2 < 5. This threshold has been commonly adopted in previous works (e.g., Masoura et al. 2018; Koutoulidis et al. 2022; Mountrichas 2023; Mountrichas et al. 2023), based on visual inspection of the SED quality. Approximately 82% of the sources satisfied this condition.
To ensure reliable estimates of the key CIGALE parameters used in our analysis, star formation rate (SFR), stellar mass (M★), AGN polar dust (EB − V, AGN), and dust attenuation in the interstellar medium (AV, ISM), we applied additional quality cuts following previous works (e.g. Mountrichas et al. 2021b, 2024b,c; Buat et al. 2021; Mountrichas & Buat 2023). These cuts rely on us comparing the best-fit values with the Bayesian estimates provided by CIGALE. Specifically, we required:  where parameterbest denotes the best-fit value and parameterbayes the corresponding Bayesian estimate. Approximately 84% of the sources satisfied these conditions, yielding a final sample of 1694 AGNs. We verified that modest variations in these limits, as explored in Mountrichas et al. (2021c), do not impact the results: changing the lower and upper bounds of the Bayesian over best ratio within the ranges 0.1–0.33 and 3–10 alters the final sample size by less than 5%, confirming that our conclusions are robust against such adjustments.
Finally, we restricted the analysis to sources at z < 1.9. This redshift cut ensures that the optical emission lines used in our classification (e.g. Hβ, Hα, and Mg II) remain accessible within the SDSS spectral coverage, while also providing sufficient numbers of sources in each bin for statistical analysis (see Sect. 3.2). The final sample contains 1 591 X-ray AGNs, of which 260 are also included in the Wu & Shen (2022) catalogue.
3.2. Optical classification
We first classified our X-ray selected AGN into BL and NL sources, using the FWHM values provided by the Wu & Shen (2022) catalogue. The choice of line depends on redshift: for sources at z < 0.9 we adopted the FWHM of Hβ, while for 0.9 < z ≤ 1.9 we used Mg II. In addition to requiring that a value was reported, we applied two quality criteria: (i) the fractional FWHM error must be less than 50% (σFWHM/FWHM < 0.5), and (ii) the line detection significance must exceed flux/σflux > 2. These cuts ensure that only robust measurements enter our classification. Among the 260 AGNs in our parent sample, 241 have reliable FWHM measurements for these lines.
For the classification, we adopted a threshold of 2000 km s−1, a commonly used value in the literature (e.g. Shen et al. 2011; Lusso et al. 2012), although somewhat different choices have also been applied (e.g. Menzel 2016). Fig. 1 shows the FWHM distribution of our sample, which exhibits a bimodal shape with a separation close to 2000 km s−1, supporting the suitability of our adopted criterion. The narrow peak at very low FWHM values likely reflects the spectral resolution and the presence of sources with unresolved line widths. Among the 241 X-ray AGNs, 172 are classified as BL sources and 69 as NL ones. Their distribution in the LX–z plane is presented in Fig. 2. We note that most BL sources lie at higher redshift (z > 1), whereas NL AGNs are scarce above z > 0.7.
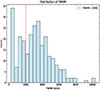 |
Fig. 1. Distribution of the FWHM for the 241 sources included in the analysis. The plotted value corresponds to the emission line used for each source (e.g., Hβ, Mg II), depending on redshift (see text for more details). |
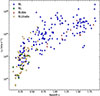 |
Fig. 2. Distribution of the 241 sources in the LX–z plane. The definitions of absorbed broad (BLAbs) and unabsorbed narrow (NLUnabs) are given in Sect. 4.1. |
In addition to the total FWHM, we inspected the individual line components fitted in the Wu & Shen (2022) catalogue. Multi–Gaussian models were used for all lines, and a broad component was often included even when the physical presence of a BL region (BLR) was uncertain. In most sources the broad and narrow components were consistent with the total line width, but a small number of cases showed a very broad component (FWHM ≳5000 km s−1), while the total line width remained narrow (< 2000 km s−1). We interpreted such fits as artificial broad wings arising from the decomposition rather than genuine broad emission. These objects were classified as NL.
Conversely, if the total FWHM exceeded 2000 km s−1, the source was classified as BL irrespective of the behaviour of the broad component. This criterion avoids misclassifications driven by spurious fits and ensures that our BL identification reflects genuine broad emission lines rather than artefacts of the fitting procedure. It also explains part of the difference with catalogues that rely solely on the broad component for classification.
We implemented this second check purely to guard against pathological broad-component fits in otherwise narrow lines. We further find that this second criterion yields classifications fully consistent with the first criterion described earlier. All sources classified as BL or NL on the basis of the total-line FWHM (with the 2000 km s−1 threshold and associated uncertainties) are recovered as such under the second criterion. This demonstrates that the two approaches are mutually reinforcing: the simple width threshold and the consistency check between total and broad components both identify the same BL and NL populations. We therefore adopted the simple total-FWHM threshold for all subsequent analysis.
Since [O III] is intrinsically a narrow emission line, its measured FWHM provides a natural benchmark against which to distinguish between BL and NL AGNs. We therefore examined the distribution of the [O III] FWHM in our sample (Fig. 3). As expected, the values cluster at low widths (∼400 km s−1), with the distribution extending up to ∼2000 km s−1, which corresponds to the maximum width observed for this narrow line. Any source whose Balmer or Mg II line exhibits an FWHM significantly above this upper envelope can therefore be reliably classified as a BL AGN, while values below this limit correspond to NL systems. This empirical boundary is fully consistent with the threshold of 2000 km s−1 adopted in our classification based on the Balmer and Mg II lines, thereby reinforcing the robustness of our approach.
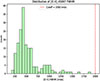 |
Fig. 3. Distribution of [O III]λ5007 FWHM values for the AGN sample. |
3.3. SED fitting classification
Mountrichas et al. (2021a) investigated X-ray AGNs in the XMM-XXL field (Pierre et al. 2016) and demonstrated that CIGALE can provide a reliable separation between type 1 and type 2 sources. Their classification was based on the best-fit and Bayesian estimates of the inclination angle, i, derived by CIGALE: type 1 AGNs correspond to ibest = 30° and ibayes < 40°, while type 2 AGNs are identified with ibest = 70° and ibayes > 60°. They further showed that including polar dust in the SED fitting improves the reliability of type 2 identification, but also complicates the classification. In particular, a substantial fraction (∼35%) of AGNs that appear as type 1 from their inclination angles, but have high polar dust extinction (EBV, AGN > 0.15), are spectroscopically classified as type 2. Motivated by these findings, subsequent studies have incorporated an EBV, AGN threshold in addition to inclination angle measurements when classifying AGNs with CIGALE (Mountrichas et al. 2024a; Mountrichas & Georgantopoulos 2024).
We note, however, that for the classification comparison in Mountrichas et al. (2021a), they used the catalogue of Menzel (2016), in which a threshold of FWHM > 1000 km s−1 was adopted for BL identification, whereas in this work we apply a higher threshold (see Sect. 3.2). In the next section, we therefore redefine the SED-based classification criteria, introducing a new EB − V, AGN threshold and inclination-angle boundary tailored to our sample, which we then use when comparing with the spectroscopic classifications.
4. Results and discussion
In this section, we explore the relationship between optical obscuration and X-ray absorption, examine how these classifications compare with those derived from SED fitting based on inclination angle, and consider the relative roles of nuclear and host-galaxy gas and dust in shaping the observed properties.
4.1. Optical and X-ray obscuration
To investigate the connection between optical and X-ray obscuration in our dataset, we used the NH parameter derived from Bayesian X-ray spectral fits and compared it with the optical classifications based on emission-line widths. Fig. 4 presents the distribution of sources in the FWHM–NH plane. Within this distribution, we identified two groups of outliers: (i) BL AGNs that nonetheless show evidence of significant X-ray absorption, and (ii) NL AGNs that appear virtually unabsorbed. We defined the first class as BL AGNs whose lower NH bound exceeds 1021.5 cm−2 (i.e. NH − NH, err > 1021.5 cm−2; hereafter BLAbs). The second class includes NL AGN whose upper NH bound falls below 1021.5 cm−2 (i.e. NH + NH, err < 1021.5 cm−2; hereafter NLUnabs). We note that, throughout the following analysis, the BL category refers exclusively to BL AGN without X-ray absorption, since BLAbs have been excluded from this group. An analogous separation is applied for NL AGNs, with NLUnabs treated as a distinct population. The choice of NH = 1021.5 cm−2 to separate absorbed and unabsorbed sources is motivated by previous works showing that this limit provides a better correspondence with optical obscuration than the more conventional 1022 cm−2 threshold (e.g. Merloni et al. 2014) and has been also adopted in other studies (e.g., Masoura et al. 2020, 2021; Mountrichas et al. 2021b). Therefore, adopting this boundary allows a more consistent comparison between X-ray and optical classifications, while remaining consistent with thresholds used in recent studies of AGN obscuration.
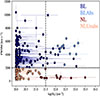 |
Fig. 4. FWHM versus X-ray absorption (NH). Different AGN populations are plotted using the colours and symbols indicated in the legend. The horizontal dashed line marks the FWHM threshold used to separate sources by the width of their optical lines, while the vertical dashed line indicates the NH threshold adopted to identify X-ray–absorbed sources (see text for details). |
According to these criteria, our sample contains 11 BLAbs and 58 NLUnabs AGNs. Their distribution in the LX–z plane is presented in Fig. 2 (see also Table 1). Although, as was already mentioned, NLUnabs AGNs have been identified in other studies, too, we note that the majority of our NL AGN fall into the NLUnabs category. This is partly a consequence of our selection. First, our X-ray spectra are limited to sources with ≳50 counts, which naturally favours unobscured systems since absorbed spectra are fainter and less likely to meet this threshold. Second, our quality criteria (flag = 0, p value > 0.01) tend to exclude strongly absorbed spectra, which are often noisy and more difficult to fit reliably. These effects bias the X-ray sample against absorbed AGNs, leading to a dominance of NLUnabs sources.
Number of sources, median redshift, and X-ray luminosity (log LX) for the AGN populations in different redshift bins.
To account for evolutionary effects, we analyse our subsets within distinct redshift bins. The binning scheme was determined objectively using the Bayesian blocks algorithm (Scargle 1998; Scargle et al. 2013), which adaptively identifies change points in a distribution where the underlying event rate shifts, yielding edges near z ≃ 0.40, 0.80, and 1.90. These three bins provide a more uniform sampling of cosmic time than a simple two-bin split at z = 0.8. Adopting the Planck Collaboration VI (2018) cosmology, they correspond to lookback times of approximately 4.5 Gyr (0.0–0.4), 2.6 Gyr (0.4–0.8), and 3.1 Gyr (0.8–1.9), compared to 7.1 and 3.1 Gyr for a two-bin scheme. This configuration balances statistical power with a more even coverage of cosmic time, ensuring that comparisons between bins are not driven by systematic differences in LX or z.
We find that roughly half of the BL AGNs lie at high redshift (z > 0.8), whereas almost all BLAbs (10 out of 11; ∼90%) are found in this range (Table 1). In contrast, all NLUnabs are confined to z < 0.8, with most (45 out of 58; ∼80%) at z ≤ 0.4. This difference largely reflects selection effects: BL AGNs, with their strong unobscured continua and broad emission lines, are more easily detected and spectroscopically classified at higher redshift than NL AGNs, whose host-dominated spectra limit their identification beyond z ∼ 0.8. Nonetheless, the contrasting redshift distributions also hint that the two outlier populations may be influenced by distinct physical and observational factors.
Beyond these observational biases, the predominance of BLAbs at z > 0.8 could be linked to the higher gas fractions and more disturbed environments of galaxies at earlier epochs, where abundant gas reservoirs may obscure the X-rays while still allowing broad optical lines to be observed. Alternatively, these sources may represent AGNs with complex absorber geometries or variable line-of-sight column densities (e.g. Reichert et al. 1985; Risaliti et al. 2002), or cases in which absorption arises on galactic rather than nuclear scales, such as dusty star-forming regions or large-scale gas clouds obscuring the X-ray emission (e.g. Goulding et al. 2011; Buchner & Bauer 2017).
Conversely, the restriction of NLUnabs to lower redshifts may reflect obscuration dominated by dust rather than gas, resulting in elevated dust-to-gas ratios (e.g. Maiolino et al. 2001; Burtscher et al. 2016). Another possibility is that these AGNs host intrinsically weak or absent BLRs (‘true type 2’ scenarios Elitzur & Ho 2009), a phenomenon that becomes more common at lower luminosities (and thus lower redshifts). Orientation and variability effects may also play a role, suppressing the BLR in the optical without producing significant X-ray absorption (e.g., López-Navas et al. 2023).
4.2. SED-based classification
We also investigated the AGN classifications provided by SED fitting, which independently assigns each source to type 1, type 2, or intermediate and unclassified categories. We adopted the following criteria to classify AGNs using the inclination angle estimates (ibest, ibayes) and the polar dust extinction (EBV, AGN) derived by CIGALE, based on the analysis presented in Mountrichas et al. (2021a):
-
type 1: ibest = 30° and ibayes ≤ 40°, with EBV, AGN < 0.15.
-
type 2:
-
ibest = 70° and ibayes ≥ 60°, or
-
ibest = 30° and ibayes ≤ 40°, with EBV, AGN > 0.15.
-
-
Intermediate or unclassified: all other cases.
Table 2 presents the distribution of SED classifications for the full sample (260 AGNs) and for the four AGN populations defined earlier (241 AGNs with reliable FWHM measurements) compared to the spectroscopic classification. Applying these criteria, we find that CIGALE successfully identifies most of the spectroscopically confirmed NL AGNs (8/11), with the remainder falling into the intermediate or unclassified category. For BL AGNs, however, the recovery fraction decreases to ∼58% (94/161). This lower efficiency is not unexpected, since in the analysis of Mountrichas et al. (2021a) the spectroscopic catalogue of Menzel (2016) was used, where the adopted FWHM threshold for AGN classification is 1000 km s−1, a value lower than the one applied in our study.
Comparison between SED-based AGN classifications (using the criteria of Mountrichas et al. 2021a, i.e. EBV, AGN = 0.15) and spectroscopic classifications.
To improve the match, we explored alternative thresholds for EBV, AGN (0.20, 0.25, 0.30) to quantify the trade-off between completeness and reliability, following the definitions in Mountrichas et al. (2021a). Completeness measures the fraction of spectroscopically confirmed type 1 (or type 2) AGNs also identified as such by SED fitting, while reliability refers to the fraction of SED-classified type 1 (or type 2) AGNs confirmed by spectroscopy. We found that EBV, AGN = 0.25 provides the best overall compromise. In practice, this threshold substantially improves the recovery of BL AGNs, while the type 2 recovery of NL AGNs remains broadly similar within the uncertainties associated with the small sample size. Lowering the threshold to 0.20 increases completeness slightly but reduces reliability, while raising it to 0.30 has the reverse effect. This behaviour is consistent with earlier findings that including polar dust improves the recovery of obscured systems (Mountrichas et al. 2021a). We therefore adopted EBV, AGN = 0.25 as the optimal threshold in our refined classification scheme.
The results of applying these updated criteria are shown in Table 3 and Fig. 5. For the full sample, CIGALE assigns 63.5% of sources to type 1, 25.3% to type 2, and 11.2% to unclassified. Among the BL and NL populations, the main improvement relative to the original scheme is seen for BL AGNs: 76.4% are now identified as type 1, compared to 58.4% for the EBV, AGN = 0.15 criterion. For NL AGNs, the recovered type 2 fraction remains broadly similar, changing from 72.7% to 63.6%; that is, from 8/11 to 7/11 sources.
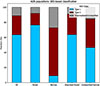 |
Fig. 5. Classification based on SED fitting for the four AGN populations, using the updated SED fitting criteria (see text for more details). |
Comparison between SED-based AGN classifications using the updated criteria (EBV, AGN threshold is set to 0.25, see text for more details) and spectroscopic classifications.
The analysis of the outlier populations provides further insights. Among BLAbs, seven out of eleven are classified as type 1 by CIGALE, consistent with unobscured SEDs and suggesting that their X-ray absorption arises from line-of-sight or host-scale gas rather than from material obscuring the BLR. Conversely, NLUnabs (NL AGNs without X-ray absorption) are frequently assigned type 1–like properties (∼47%), indicating SEDs dominated by unobscured emission despite the absence of broad optical lines. Possible explanations include host-galaxy dilution of weak broad lines, intrinsic BLR weakness (‘true type 2’ scenarios), or variability.
In summary, the updated SED-based classification improves the agreement with the spectroscopic separation mainly for BL sources, while preserving a broadly similar performance for NL sources given the small numbers involved. At the same time, it provides an independent diagnostic that highlights genuine mismatched populations. These results demonstrate that SED fitting complements optical and X-ray methods, revealing cases where obscuration properties cannot be fully captured by spectroscopy alone.
4.3. Gas-to-dust ratios
We used the CIGALE SED fitting results to examine gas-to-dust conditions through the ratios NH/EBV, AGN and NH/AVISM, expressed as log(NH/A) with units of cm−2 mag−1 (Fig. 6 and Table 4). These ratios are not dimensionless, but provide a relative indicator of the amount of gas per unit dust extinction, usually compared to the Galactic value of NH/E(B − V) ≃ 5.8 × 10²¹, cm−2, mag−1.
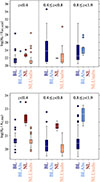 |
Fig. 6. Gas-to-dust ratios for the four AGN populations, expressed as log(NH/E(B − V)AGN) (top panel) and log(NH/AVISM) (bottom panel). Whiskers extend to 1.5 × IQR, and individual points beyond this range are shown as single circles. Populations with only one available measurement (e.g. BLAbs at z < 0.4) are shown as single points to indicate the lack of statistical constraints. Median values and IQRs for different redshift intervals are presented in Table 4. |
Median gas-to-dust ratios (with IQR in brackets) for the AGN populations in different redshift bins, and for the combined z < 1.9 sample.
Because EBV, AGN traces polar dust and is most meaningful for systems viewed close to face-on, we restrict the comparison of NH/EBV, AGN to BL and BLAbs sources. At 0.8 ≤ z < 1.9, BLAbs show significantly higher values than BL AGNs, with median log(NH/E(B − V),AGN) = 22.6 compared to 20.4 for BL. A Kolmogorov-Smirnov test (KS) yields p ∼ 5 × 10⁻⁶. This confirms that BLAbs are genuinely gas-rich systems with little associated dust, consistent with dust-poor absorbers, clumpy geometries, or complex circumnuclear structure.
To compare all four populations, we used NH/AVISM, which traces host-galaxy scale dust. At z < 0.4, NL AGNs show median log(NH/AVISM) = 22.0 versus 20.6 for BL AGNs (p ∼ 10−7), reflecting their higher NH values (median log NH = 22.1 versus 20.0, see Table 5). By contrast, NLUnabs show much lower values, driven by their small columns (median log NH = 20.0). Thus NLUnabs represent dust-rich but gas-poor systems, consistent with the absence of X-ray absorption despite optical type 2 spectra.
Median log NH values (cm−2; with IQR in brackets) for the AGN populations in different redshift bins.
An intriguing possibility is that the elevated gas-to-dust ratios we observe, particularly for the BLAbs at z ≳ 0.8, may trace recent or ongoing interactions that funnel large columns of relatively dust-poor gas to the nucleus. Merger-driven inflows can (i) raise NH faster than the dust content if the accreted gas is metal-poor or if dust is partially destroyed by merger-induced shocks and intense radiation fields, and (ii) produce clumpy, multi-scale geometries in which X-ray sightlines intercept dense gas while optical/UV continuum and broad lines remain only mildly extincted. In this context, high NH/EBV, AGN may flag systems where the circumnuclear medium has been recently re-supplied or re-shaped by dynamical disturbances rather than by a steady-state torus.
Such conditions are also favourable for the presence of close SMBH pairs (dual AGNs) at kiloparsec scales. If some of our high gas-to-dust outliers are late-stage mergers, a dual–AGN interpretation is plausible in a subset of cases. However, our current datasets cannot test this directly: the XMM-Newton PSF and SDSS fibre spectroscopy do not resolve kiloparsec-scale pairs at the redshifts of interest, and the [OIII]/Hβ and Balmer-decrement diagnostics we use are not uniquely predictive of dual activity.
In summary, the gas-to-dust ratios derived from SED fitting confirm and sharpen the contrasts between BL, NL, and the outlier populations, while also hinting at possible evolutionary or dynamical origins. At low redshift (z < 0.4), NL AGNs display systematically higher NH per unit dust extinction than BL AGNs, largely reflecting their elevated gas columns. BLAbs at z > 0.8 appear extremely gas-rich relative to their dust content, whereas NLUnabs at z < 0.8 show the opposite behaviour, with low gas-to-dust ratios driven by their low NH. These findings indicate that the mismatched populations are not artefacts of classification but reflect genuine physical diversity in the circumnuclear and host-scale environments. The high gas-to-dust ratio systems may plausibly trace recent or ongoing mergers that channel relatively dust-poor gas toward the nucleus, raising the possibility that some could host dual AGNs. Although our data cannot confirm this scenario, it remains testable with high-resolution X-ray, radio, or integral field unit (IFU) observations capable of identifying double nuclei or disturbed kinematics.
4.4. Optical line diagnostics: Balmer decrement and [O III]/Hβ ratios
Optical emission-line flux ratios provide an independent probe of the dust and gas content along the line of sight, complementary to the gas-to-dust ratios discussed above. Here we focus on two diagnostics: the Balmer decrement, defined as the flux ratio Hα/Hβ, and the [O III]/Hβ flux ratio. Both are sensitive to reddening, though in different ways. The Balmer decrement is computed using the narrow components of both lines, tracing dust attenuation in the ionized gas of the NL region (NLR). In contrast, the [O III]/Hβ ratio is computed from the narrow [O III]c flux (as denoted in the catalogue) and the broad Hβ flux, and thus can only be evaluated for BL (type 1) AGNs. In this context, it serves primarily as a qualitative indicator of differential extinction between the NL and BL regions rather than a classical ionization diagnostic.
A caveat is that these measurements rely on the fluxes provided in the catalogue, and not all spectra have reliable decompositions for the relevant emission lines. Consequently, the number of available sources is somewhat smaller than in the gas-to-dust ratio analysis (Table 6).
Counts of sources per AGN class and redshift interval for which either Balmer decrement or [O III]c/Hβ measurements are available.
4.4.1. Balmer decrement
The Balmer decrement, Hα/Hβ, provides a direct probe of dust reddening in the NLR. Our results are presented in Fig. 7. At z < 0.4, where sufficient numbers of NL AGNs are available, NL sources show systematically higher Balmer decrements (median: 5.40, IQR: [4.72, 8.29]) compared to NLUnabs (median: 3.62, IQR: [2.99, 3.38]). This difference is statistically significant (KS test p ≃ 6 × 10⁻³; ∼2.7σ), indicating moderately stronger dust extinction in the NL population. At higher redshifts, the small number of NL AGNs with measurable Hα/Hβ prevents meaningful statistical comparisons.
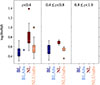 |
Fig. 7. Box plots of the Balmer decrement (Hα/Hβ) for the BL, BLAbs, NL, and NLUnabs populations, shown in three redshift intervals. The boxes indicate the IQR, with the median marked by a horizontal line. Whiskers extend to 1.5 × IQR, and individual points beyond this range are shown as single circles. For subclasses represented by a single measurement (e.g. BLAbs at z < 0.4), the data point is plotted directly. |
Physically, this result implies that NL AGNs have more substantial columns of dusty material affecting the NLR emission. The excess extinction could arise from circumnuclear structures such as outflowing material or polar dust, or from host-scale dust lanes intersecting the line of sight. High-resolution imaging has shown that dust lanes and tidal features on kiloparsec scales can indeed cover a significant fraction of the ionized gas region (e.g. Goulding et al. 2012; Prieto et al. 2014), and therefore can obscure the NLR when viewed along particular orientations. In contrast, NLUnabs appear to represent systems where the NLR is comparatively unobscured by dust.
4.4.2. [O III]/Hβ ratios
Regarding the [O III]/Hβ ratio, there are only two BLAbs sources in our sample that have available measurements, one at z < 0.4 and one at 0.8 ≤ z < 1.9. In both redshift bins, their [O III]/Hβ ratios appear lower than those of the BL population, but the numbers are far too small for any statistical inference. If this tentative behaviour were confirmed in larger samples, it could indicate stronger broad Hβ emission relative to the NL component in BLAbs, consistent with their elevated gas-to-dust ratios and the presence of dust-poor, X-ray absorbing gas. However, with only two objects, this interpretation remains speculative.
4.5. Host galaxy properties and accretion rates
We explored how M★, SFR, and Eddington ratio (λEdd) vary across the AGN samples. The M★ and SFR estimates were obtained through SED fitting, and the λEdd values were adopted from the Wu & Shen (2022) catalogue.
Fig. 8 presents our measurements and Tables 7, 8, and 9 list the median and interquartile range (IQR) values in each redshift bin. Black-hole masses were taken from the catalogue of Wu & Shen (2022), which provides virial MBH estimates for quasars in SDSS DR16Q based on the widths of broad emission lines (Hβ, Mg II, C IV). We note that, although our spectroscopic classification identifies some of these sources as NL or NLUnabs, all objects in Wu & Shen (2022) were originally classified as BL quasars. Their MBH and λEdd values were therefore derived under the assumption of type 1 AGN physics. This does not affect the M★ and SFR measurements discussed below, but it does imply that the absolute MBH and λEdd values of the NL and NLUnabs subsets are more uncertain than for the BL population. In particular, if the BL widths used in the virial estimators are underestimated in these borderline systems, the inferred MBH may be biased low and the corresponding λEdd biased high. The Eddington-ratio trends for NL and NLUnabs should therefore be interpreted in a relative rather than an absolute sense.
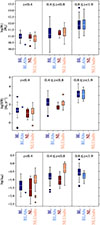 |
Fig. 8. Box plots of host galaxy stellar mass (M★, top), SFR (middle), and Eddington ratio (λEdd, bottom) for the four AGN populations, in three redshift intervals. Whiskers extend to 1.5 × IQR, and individual points beyond this range are shown as single circles. For classes represented by a single measurement (e.g. BLAbs at low redshift), the individual data point is plotted directly. Median values and IQRs for different redshift intervals are presented in Tables 7, 8, and 9. |
Median stellar masses (log M★ [M⊙]) with IQRs for the AGN populations in different redshift bins.
Median SFRs (logSFR [M⊙ yr−1]) with IQRs for AGN populations in different redshift bins.
Median Eddington ratios (log λEdd) with IQRs for AGN populations in different redshift bins.
At z < 0.8, NL AGNs appear to reside in somewhat more massive galaxies than BL AGNs, although the offsets are modest (≲0.2 dex) and not statistically significant. NLUnabs have host masses comparable to the other two populations. These results align with earlier optical studies that reported small (0.2–0.3 dex) mass differences between BL and NL AGNs (e.g. Zou et al. 2019; Mountrichas et al. 2021a), though often without strong statistical significance. X-ray-based classifications show similarly mixed results, with some analyses reporting negligible differences (e.g. Masoura et al. 2021; Mountrichas et al. 2021b) and others finding obscured sources in more massive hosts, particularly at moderate luminosities and high NH (e.g. Georgantopoulos et al. 2023; Mountrichas et al. 2024d).
The SFRs reveal somewhat clearer contrasts. At both low (z < 0.4) and intermediate (0.4 ≤ z < 0.8) redshifts, NL AGNs exhibit systematically lower SFRs than BL AGNs (median offsets of ∼0.3–0.7 dex; KS test p ≃ 10−2, ∼2.4σ), indicating a mild but consistent difference. NLUnabs, in contrast, display SFRs more closely aligned with those of BL AGNs: at z < 0.4 their median SFR is 1.41 compared to 1.36 for BL, whereas NL AGNs are lower at 1.03. A similar pattern holds at 0.4 ≤ z < 0.8, with NLUnabs (2.14) resembling BL (2.21) rather than NL (1.50). Although the differences do not exceed the 3σ level, they suggest that NLUnabs share host star-forming properties with BL AGNs rather than with the more quiescent NL population. At higher redshifts, BLAbs show SFRs comparable to those of BL AGNs. Previous studies have likewise reported that unobscured AGNs tend to exhibit similar SFRs to their obscured counterparts (e.g. Zou et al. 2019; Mountrichas et al. 2021a,b, 2024d), except in heavily absorbed, moderate-luminosity systems where suppressed star formation has been observed (e.g. Georgantopoulos et al. 2023).
Eddington ratios show the most striking population differences and a strong redshift evolution. BL AGNs increase from log λEdd ∼ −1.4 at z < 0.4 to ∼ − 0.6 at z > 0.8, consistent with more efficient accretion at earlier cosmic times. NL AGNs at z < 0.4 have lower accretion rates (median −1.62), pointing to less efficient black hole growth, although this difference is not statistically significant (p ∼ 0.4). NLUnabs show substantially higher Eddington ratios than both BL and NL at the same redshifts (p ∼ 10−3), reaching medians of −0.99 at z < 0.4 and −0.37 at 0.4 ≤ z < 0.8. This suggests a population of NL systems undergoing relatively efficient accretion despite their dust-dominated signatures, although the absolute λEdd values for these subsets should be treated with caution because their virial MBH estimates were derived under type 1 assumptions. BLAbs at z > 0.8 show Eddington ratios (−0.86) consistent with the BL population, suggesting that their distinctive property is the presence of excess X-ray–absorbing gas rather than differences in accretion efficiency.
The lower SFRs of NL AGNs relative to BL sources are consistent with their lower Eddington ratios, pointing to more evolved hosts with reduced cold-gas reservoirs and less efficient black-hole fueling. This interpretation is consistent with their elevated gas-to-dust ratios and high Balmer decrements, which indicate substantial gas columns but relatively little dust, implying that obscuration and fueling are partially decoupled. By contrast, NLUnabs exhibit star-formation levels comparable to BL AGNs, suggesting that they reside in actively star-forming hosts where the absence of broad lines is not linked to global quenching but rather to line-of-sight dust or host-dilution effects. BLAbs, which match the BL population in SFR and accretion rates at high redshift, reinforce the view that their X-ray absorption is driven by external or geometrically complex absorbers rather than by differences in fueling.
We also examined the long-term X-ray variability of the sources using the X-ray multi-mission catalogue from the XMM2Athena project (Quintin et al. 2024), which provides flux-based variability estimates across multiple epochs. No significant differences were found among the four AGN populations within any redshift bin, apart from a tentative indication that BLAbs at z > 0.8 appear less variable than their unabsorbed counterparts. This trend, however, is likely driven by lower signal-to-noise ratios in absorbed sources rather than by intrinsic variability differences. Overall, X-ray variability does not appear to be a distinguishing factor among the populations considered here.
Taken together, these host and accretion diagnostics reinforce the broader picture. NL AGNs are dust- and gas-rich systems with relatively inefficient accretion at low redshift. NLUnabs combine dust-dominated signatures with apparently high Eddington ratios and BL-like star formation, marking them as a distinct population, although the absolute λEdd values for this subset remain more uncertain than for BL AGNs. BL AGNs show steadily increasing accretion efficiency with redshift, consistent with the canonical unobscured AGN sequence reported in previous works (e.g. Shen & Liu 2012; Schulze et al. 2015; Aird et al. 2018), while BLAbs highlight the presence of X-ray absorption unrelated to fueling differences. These complementary diagnostics suggest that the mismatched populations reflect genuine diversity in AGNs fueling and obscuration rather than classification uncertainties. We note that these trends are unlikely to arise from selection effects: our comparison samples occupy similar LX and redshift ranges within each bin, and the contrasts persist when luminosity-matched sub-samples are considered, indicating that the differences are intrinsic.
5. Summary
We investigated the relation between optical obscuration and X-ray absorption in a combined SDSS–XMM sample of 241 AGNs at z < 1.9, drawn from the 4XMM-DR11 catalogue (Webb et al. 2020) and the SDSS DR16Q quasar catalogue (Wu & Shen 2022). Bayesian X-ray spectral fits were obtained within the XMM2Athena framework (Webb et al. 2023; Viitanen et al. 2025), and host-galaxy properties were derived via SED fitting with CIGALE (Boquien et al. 2019; Mountrichas et al. 2024c). Our main results are:
-
Broad-line versus narrow-line AGNs: Among the 241 AGNs, 172 (∼71%) are classified as BL and 69 (∼29%) as NL. The majority of BL AGNs (∼94%) show no signs of X-ray absorption, whereas ∼84% of NL AGNs (58/69) appear unabsorbed in X-rays (Fig. 4), though this may partly reflect selection effects that disfavour strongly absorbed spectra.
-
Outlier populations: Two distinct subsets deviate from the standard optical–X-ray correspondence:
-
BLAbs: Eleven BL AGNs (∼6% of BL) exhibit significant X-ray absorption. Their SEDs remain type 1–like, indicating that the absorption arises from dust-free or geometrically complex gas rather than the classical torus.
-
NLUnabs: Fifty-eight NL AGNs (∼84% of the NL sample) show no detectable X-ray absorption. Nearly half display type 1–like SEDs and high Eddington ratios, consistent with BL dilution by dust or host light rather than the intrinsic absence of a BLR.
-
-
Gas-to-dust ratios: At z < 0.4, NL AGNs exhibit elevated NH/E(B − V) ratios relative to BL AGNs (median log NH/E(B − V)AGN = 22.8 vs. 21.1), consistent with their higher gas columns. BLAbs at z > 0.8 show extreme gas-to-dust ratios, revealing substantial X-ray–absorbing gas with little associated dust. NLUnabs have the lowest ratios, reflecting low NH despite comparable dust extinction. A subset of the high NH/E(B − V) outliers may trace late-stage mergers and potentially host dual AGNs, although confirming this will require high-resolution X-ray/IR imaging or IFU spectroscopy.
-
Optical line diagnostics: At z < 0.4, NL AGN display higher Balmer decrements than NLUnabs, indicating stronger dust reddening. For [O III]/Hβ, only two BLAbs have measurements, preventing firm conclusions. Overall, optical diagnostics support enhanced reddening in NL AGNs.
-
Host galaxies and accretion: NL AGNs tend to inhabit slightly more massive, lower-SFR hosts and show lower Eddington ratios than BL AGN, consistent with inefficient fueling and reduced cold-gas content. NLUnabs share BL-like SFRs and exhibit substantially higher Eddington ratios (up to log λEdd ∼ −0.4), identifying them as efficiently accreting, dust-dominated systems. BLAbs match the BL population in SFR and accretion properties, suggesting that their excess X-ray absorption originates from external or complex absorbers rather than fueling differences.
These complementary diagnostics demonstrate that obscuration in AGNs cannot be explained by orientation alone. Instead, it reflects a combination of circumnuclear geometry, host-scale dust, and temporal variability. The presence of BLAbs and NLUnabs highlights the need for multi-wavelength diagnostics to uncover the full diversity of AGN obscuration. Ongoing and upcoming wide-area surveys such as Euclid and LSST will benefit from this integrated approach, combining X-ray spectroscopy, optical line diagnostics, and SED fitting to disentangle nuclear and host-scale contributions to AGN obscuration.
Acknowledgments
GM and FJC acknowledges funding from grant PID2021-122955OB-C41 funded by MCIN/AEI/10.13039/501100011033 and by “ERDF/EU”. This work was partially supported by the European Union’s Horizon 2020 Research and Innovation program under the Maria Sklodowska-Curie grant agreement (No. 754510). FJC acknowledges support from Universidad de Cantabria and Consejería de Educación, Formación profesional y Universidades del Gobierno de Cantabria via the “Actividad estructural para el desarrollo de la investigación del Instituto de Física de Cantabria” project
References
- Aird, J., Coil, A. L., & Georgakakis, A. 2018, MNRAS, 474, 1225 [NASA ADS] [CrossRef] [Google Scholar]
- Antonucci, R. 1993, ARA&A, 31, 473 [Google Scholar]
- Arnaud, K. A. 1996, ASP Conf. Ser., 101, 17 [Google Scholar]
- Barquín-González, L., Mateos, S., Carrera, F. J., et al. 2024, A&A, 687, A159 [NASA ADS] [CrossRef] [EDP Sciences] [Google Scholar]
- Boquien, M., Burgarella, D., Roehlly, Y., et al. 2019, A&A, 622, A103 [NASA ADS] [CrossRef] [EDP Sciences] [Google Scholar]
- Bruzual, G., & Charlot, S. 2003, MNRAS, 344, 1000 [NASA ADS] [CrossRef] [Google Scholar]
- Buat, V., Ciesla, L., Boquien, M., Małek, K., & Burgarella, D. 2019, A&A, 632, A79 [NASA ADS] [CrossRef] [EDP Sciences] [Google Scholar]
- Buat, V., Mountrichas, G., Yang, G., et al. 2021, A&A, 654, A93 [NASA ADS] [CrossRef] [EDP Sciences] [Google Scholar]
- Buchner, J. 2019, PASP, 131, 108005 [Google Scholar]
- Buchner, J. 2021, JOSS, 6, 3001 [NASA ADS] [CrossRef] [Google Scholar]
- Buchner, J., & Bauer, F. E. 2017, MNRAS, 465, 4348 [Google Scholar]
- Buchner, J., Georgakakis, A., Nandra, K., et al. 2014, A&A, 564, A125 [NASA ADS] [CrossRef] [EDP Sciences] [Google Scholar]
- Burtscher, L., Davies, R. I., Graciá-Carpio, J., et al. 2016, A&A, 586, A28 [NASA ADS] [CrossRef] [EDP Sciences] [Google Scholar]
- Carrasco Kind, M., & Brunner, R. J. 2013, MNRAS, 432, 1483 [Google Scholar]
- Charlot, S., & Fall, S. M. 2000, ApJ, 539, 718 [Google Scholar]
- Civano, F., Elvis, M., Brusa, M., et al. 2012, ApJS, 201, 30 [Google Scholar]
- Dale, D. A., Helou, G., Magdis, G. E., et al. 2014, ApJ, 784, 83 [Google Scholar]
- Elitzur, M., & Ho, L. C. 2009, ApJ, 701, L91 [Google Scholar]
- Georgantopoulos, I., Pouliasis, E., Mountrichas, G., et al. 2023, A&A, 673, A67 [NASA ADS] [CrossRef] [EDP Sciences] [Google Scholar]
- Goulding, A. D., Alexander, D. M., Bauer, F. E., et al. 2012, ApJ, 755, 5 [Google Scholar]
- Goulding, A. D., Alexander, D. M., Mullaney, J. R., et al. 2011, MNRAS, 411, 1231 [Google Scholar]
- Granato, G. L., Danese, L., & Franceschini, A. 1997, ApJ, 486, 147 [Google Scholar]
- Harrison, C. M. 2017, Nat. Astron., 1, 0165 [NASA ADS] [CrossRef] [Google Scholar]
- Hickox, R. C., & Alexander, D. M. 2018, ARA&A, 56, 625 [Google Scholar]
- Hickox, R. C., Jones, C., Forman, W. R., et al. 2009, ApJ, 696, 891 [Google Scholar]
- Hon, W. J., Wolf, C., Onken, C. A., Webster, R., & Auchettl, K. 2022, MNRAS, 511, 54 [NASA ADS] [CrossRef] [Google Scholar]
- Hopkins, P. F., Hernquist, L., Cox, T. J., et al. 2006, ApJSS, 163, 1 [Google Scholar]
- Jaffarian, G. W., & Gaskell, C. M. 2020, MNRAS, 493, 930 [NASA ADS] [CrossRef] [Google Scholar]
- Kormendy, J., & Ho, L. C. 2013, ARAA, 51, 511 [NASA ADS] [CrossRef] [Google Scholar]
- Koutoulidis, L., Mountrichas, G., Georgantopoulos, I., Pouliasis, E., & Plionis, M. 2022, A&A, 658, A35 [NASA ADS] [CrossRef] [EDP Sciences] [Google Scholar]
- LaMassa, S. M., Cales, S., Moran, E. C., et al. 2015, ApJ, 800, 144 [NASA ADS] [CrossRef] [Google Scholar]
- Lansbury, G. B., Gandhi, P., Alexander, D. M., et al. 2015, ApJ, 809, 115 [Google Scholar]
- Li, J., Xue, Y., Sun, M., et al. 2019, ApJ, 877, 5 [NASA ADS] [CrossRef] [Google Scholar]
- López-Navas, E., Arévalo, P., Bernal, S., et al. 2023, MNRAS, 518, 1531 [Google Scholar]
- Lusso, E., Comastri, A., Simmons, B. D., et al. 2012, MNRAS, 425, 623 [Google Scholar]
- MacLeod, C. L., Ross, N. P., Lawrence, A., et al. 2016, MNRAS, 457, 389 [Google Scholar]
- Maiolino, R., Marconi, A., Salvati, M., et al. 2001, A&A, 365, 28 [NASA ADS] [CrossRef] [EDP Sciences] [Google Scholar]
- Małek, K., Buat, V., Roehlly, Y., et al. 2018, A&A, 620, A50 [Google Scholar]
- Malizia, A., Bassani, L., Stephen, J. B., Bazzano, A., & Ubertini, P. 2020, A&A, 639, A5 [NASA ADS] [CrossRef] [EDP Sciences] [Google Scholar]
- Masoura, V. A., Georgantopoulos, I., Mountrichas, G., et al. 2020, A&A, 638, A45 [NASA ADS] [CrossRef] [EDP Sciences] [Google Scholar]
- Masoura, V. A., Mountrichas, G., Georgantopoulos, I., & Plionis, M. 2021, A&A, 646, A167 [EDP Sciences] [Google Scholar]
- Masoura, V. A., Mountrichas, G., Georgantopoulos, I., et al. 2018, A&A, 618, A31 [NASA ADS] [CrossRef] [EDP Sciences] [Google Scholar]
- Menzel, M.-L., et al. 2016, MNRAS, 457, 110 [NASA ADS] [CrossRef] [Google Scholar]
- Merloni, A., Bongiorno, A., Brusa, M., et al. 2014, MNRAS, 437, 3550 [Google Scholar]
- Mountrichas, G. 2023, A&A, 672, A98 [NASA ADS] [CrossRef] [EDP Sciences] [Google Scholar]
- Mountrichas, G., & Shankar, F. 2023, MNRAS, 518, 2088 [Google Scholar]
- Mountrichas, G., & Georgantopoulos, I. 2024, A&A, 683, A160 [NASA ADS] [CrossRef] [EDP Sciences] [Google Scholar]
- Mountrichas, G., & Buat, V. 2023, A&A, submitted [arXiv:2309.15909] [Google Scholar]
- Mountrichas, G., Georgantopoulos, I., Ruiz, A., & Kampylis, G. 2020, MNRAS, 491, 1727 [NASA ADS] [CrossRef] [Google Scholar]
- Mountrichas, G., Buat, V., Georgantopoulos, I., et al. 2021a, A&A, 653, A70 [NASA ADS] [CrossRef] [EDP Sciences] [Google Scholar]
- Mountrichas, G., Buat, V., Yang, G., et al. 2021b, A&A, 653, A74 [NASA ADS] [CrossRef] [EDP Sciences] [Google Scholar]
- Mountrichas, G., Buat, V., Yang, G., et al. 2021c, A&A, 653, A74 [NASA ADS] [CrossRef] [EDP Sciences] [Google Scholar]
- Mountrichas, G., Buat, V., Yang, G., et al. 2022a, A&A, 663, A130 [NASA ADS] [CrossRef] [EDP Sciences] [Google Scholar]
- Mountrichas, G., Masoura, V. A., Xilouris, E. M., et al. 2022b, A&A, 661, A108 [NASA ADS] [CrossRef] [EDP Sciences] [Google Scholar]
- Mountrichas, G., Masoura, V. A., Corral, A., & Carrera, F. J. 2024a, A&A, 683, A143 [NASA ADS] [CrossRef] [EDP Sciences] [Google Scholar]
- Mountrichas, G., Ruiz, A., Georgantopoulos, I., et al. 2024b, A&A, 688, A79 [NASA ADS] [CrossRef] [EDP Sciences] [Google Scholar]
- Mountrichas, G., Yang, G., Buat, V., et al. 2023, A&A, 675, A137 [NASA ADS] [CrossRef] [EDP Sciences] [Google Scholar]
- Mountrichas, G., Siudek, M., & Cucciati, O. 2024c, A&A, 686, A229 [NASA ADS] [CrossRef] [EDP Sciences] [Google Scholar]
- Mountrichas, G., Viitanen, A., Carrera, F. J., et al. 2024d, A&A, 683, A172 [NASA ADS] [CrossRef] [EDP Sciences] [Google Scholar]
- Pierre, M., Pacaud, F., Adami, C., et al. 2016, A&A, 592, A1 [NASA ADS] [CrossRef] [EDP Sciences] [Google Scholar]
- Planck Collaboration VI 2018, A&A, 641, A6 [Google Scholar]
- Prieto, M. A., Mezcua, M., Fernández-Ontiveros, J. A., & Tristram, K. R. W. 2014, MNRAS, 442, 2145 [CrossRef] [Google Scholar]
- Quintin, E., Webb, N. A., Georgantopoulos, I., et al. 2024, A&A, 687, A250 [NASA ADS] [CrossRef] [EDP Sciences] [Google Scholar]
- Reichert, G. A., Mushotzky, R. F., Holt, S. S., & Petre, R. 1985, ApJ, 296, 69 [Google Scholar]
- Ricci, C., Trakhtenbrot, B., Koss, M. J., et al. 2017, Nature, 549, 488 [NASA ADS] [CrossRef] [Google Scholar]
- Ricci, C., Kara, E., Loewenstein, M., et al. 2020, ApJ, 898, L1 [Google Scholar]
- Risaliti, G., Elvis, M., & Gilli, R. 2002, ApJL, 566, 67 [Google Scholar]
- Ruiz, A., Corral, A., Mountrichas, G., & Georgantopoulos, I. 2018, A&A, 618, A52 [NASA ADS] [CrossRef] [EDP Sciences] [Google Scholar]
- Scargle, J. D. 1998, ApJ, 504, 405 [Google Scholar]
- Scargle, J. D., Norris, J. P., Jackson, B., & Chiang, J. 2013, ApJ, 764, 167 [Google Scholar]
- Schulze, A., Bongiorno, A., Gavignaud, I., et al. 2015, MNRAS, 447, 2085 [NASA ADS] [CrossRef] [Google Scholar]
- Shen, Y., & Liu, X. 2012, ApJ, 753, 125 [NASA ADS] [CrossRef] [Google Scholar]
- Shen, Y., Richards, G. T., Strauss, M. A., et al. 2011, ApJS, 194, 45 [Google Scholar]
- Stalevski, M., Fritz, J., Baes, M., Nakos, T., & Popović, L. Č. 2012, MNRAS, 420, 2756 [Google Scholar]
- Stalevski, M., Ricci, C., Ueda, Y., et al. 2016, MNRAS, 458, 2288 [Google Scholar]
- Tranin, H., Godet, O., Webb, N., & Primorac, D. 2022, A&A, 657, A138 [NASA ADS] [CrossRef] [EDP Sciences] [Google Scholar]
- Urry, C. M., & Padovani, P. 1995, PASP, 107, 803 [NASA ADS] [CrossRef] [Google Scholar]
- Viitanen, A., Mountrichas, G., Stiele, H., et al. 2025, A&A, 704, A16 [NASA ADS] [CrossRef] [EDP Sciences] [Google Scholar]
- Villa-Velez, J. A., Buat, V., Theule, P., Boquien, M., & Burgarella, D. 2021, A&A, 654, A153 [NASA ADS] [CrossRef] [EDP Sciences] [Google Scholar]
- Webb, N. A., Coriat, M., Traulsen, I., et al. 2020, A&A, 641, A136 [NASA ADS] [CrossRef] [EDP Sciences] [Google Scholar]
- Webb, N. A., Carrera, F. J., Schwope, A., et al. 2023, Astron. Nachr., 344 [Google Scholar]
- Wu, Q., & Shen, Y. 2022, ApJS, 263, 42 [NASA ADS] [CrossRef] [Google Scholar]
- Yang, G., Brandt, W. N., Luo, B., et al. 2016, ApJ, 831, 145 [NASA ADS] [CrossRef] [Google Scholar]
- Yang, G., Boquien, M., Buat, V., et al. 2020, MNRAS, 491, 740 [Google Scholar]
- Yang, G., Boquien, M., Brandt, W. N., et al. 2022, ApJ, 927, 192 [NASA ADS] [CrossRef] [Google Scholar]
- Yang, Q., Wu, X.-B., Fan, X., et al. 2018, ApJ, 862, 109 [Google Scholar]
- Zou, F., Yang, G., Brandt, W. N., & Xue, Y. 2019, ApJ, 878, 11 [Google Scholar]
All Tables
Number of sources, median redshift, and X-ray luminosity (log LX) for the AGN populations in different redshift bins.
Comparison between SED-based AGN classifications (using the criteria of Mountrichas et al. 2021a, i.e. EBV, AGN = 0.15) and spectroscopic classifications.
Comparison between SED-based AGN classifications using the updated criteria (EBV, AGN threshold is set to 0.25, see text for more details) and spectroscopic classifications.
Median gas-to-dust ratios (with IQR in brackets) for the AGN populations in different redshift bins, and for the combined z < 1.9 sample.
Median log NH values (cm−2; with IQR in brackets) for the AGN populations in different redshift bins.
Counts of sources per AGN class and redshift interval for which either Balmer decrement or [O III]c/Hβ measurements are available.
Median stellar masses (log M★ [M⊙]) with IQRs for the AGN populations in different redshift bins.
Median SFRs (logSFR [M⊙ yr−1]) with IQRs for AGN populations in different redshift bins.
Median Eddington ratios (log λEdd) with IQRs for AGN populations in different redshift bins.
All Figures
|
Fig. 1. Distribution of the FWHM for the 241 sources included in the analysis. The plotted value corresponds to the emission line used for each source (e.g., Hβ, Mg II), depending on redshift (see text for more details). |
| In the text | |
|
Fig. 2. Distribution of the 241 sources in the LX–z plane. The definitions of absorbed broad (BLAbs) and unabsorbed narrow (NLUnabs) are given in Sect. 4.1. |
| In the text | |
|
Fig. 3. Distribution of [O III]λ5007 FWHM values for the AGN sample. |
| In the text | |
|
Fig. 4. FWHM versus X-ray absorption (NH). Different AGN populations are plotted using the colours and symbols indicated in the legend. The horizontal dashed line marks the FWHM threshold used to separate sources by the width of their optical lines, while the vertical dashed line indicates the NH threshold adopted to identify X-ray–absorbed sources (see text for details). |
| In the text | |
|
Fig. 5. Classification based on SED fitting for the four AGN populations, using the updated SED fitting criteria (see text for more details). |
| In the text | |
|
Fig. 6. Gas-to-dust ratios for the four AGN populations, expressed as log(NH/E(B − V)AGN) (top panel) and log(NH/AVISM) (bottom panel). Whiskers extend to 1.5 × IQR, and individual points beyond this range are shown as single circles. Populations with only one available measurement (e.g. BLAbs at z < 0.4) are shown as single points to indicate the lack of statistical constraints. Median values and IQRs for different redshift intervals are presented in Table 4. |
| In the text | |
|
Fig. 7. Box plots of the Balmer decrement (Hα/Hβ) for the BL, BLAbs, NL, and NLUnabs populations, shown in three redshift intervals. The boxes indicate the IQR, with the median marked by a horizontal line. Whiskers extend to 1.5 × IQR, and individual points beyond this range are shown as single circles. For subclasses represented by a single measurement (e.g. BLAbs at z < 0.4), the data point is plotted directly. |
| In the text | |
|
Fig. 8. Box plots of host galaxy stellar mass (M★, top), SFR (middle), and Eddington ratio (λEdd, bottom) for the four AGN populations, in three redshift intervals. Whiskers extend to 1.5 × IQR, and individual points beyond this range are shown as single circles. For classes represented by a single measurement (e.g. BLAbs at low redshift), the individual data point is plotted directly. Median values and IQRs for different redshift intervals are presented in Tables 7, 8, and 9. |
| In the text | |
Current usage metrics show cumulative count of Article Views (full-text article views including HTML views, PDF and ePub downloads, according to the available data) and Abstracts Views on Vision4Press platform.
Data correspond to usage on the plateform after 2015. The current usage metrics is available 48-96 hours after online publication and is updated daily on week days.
Initial download of the metrics may take a while.