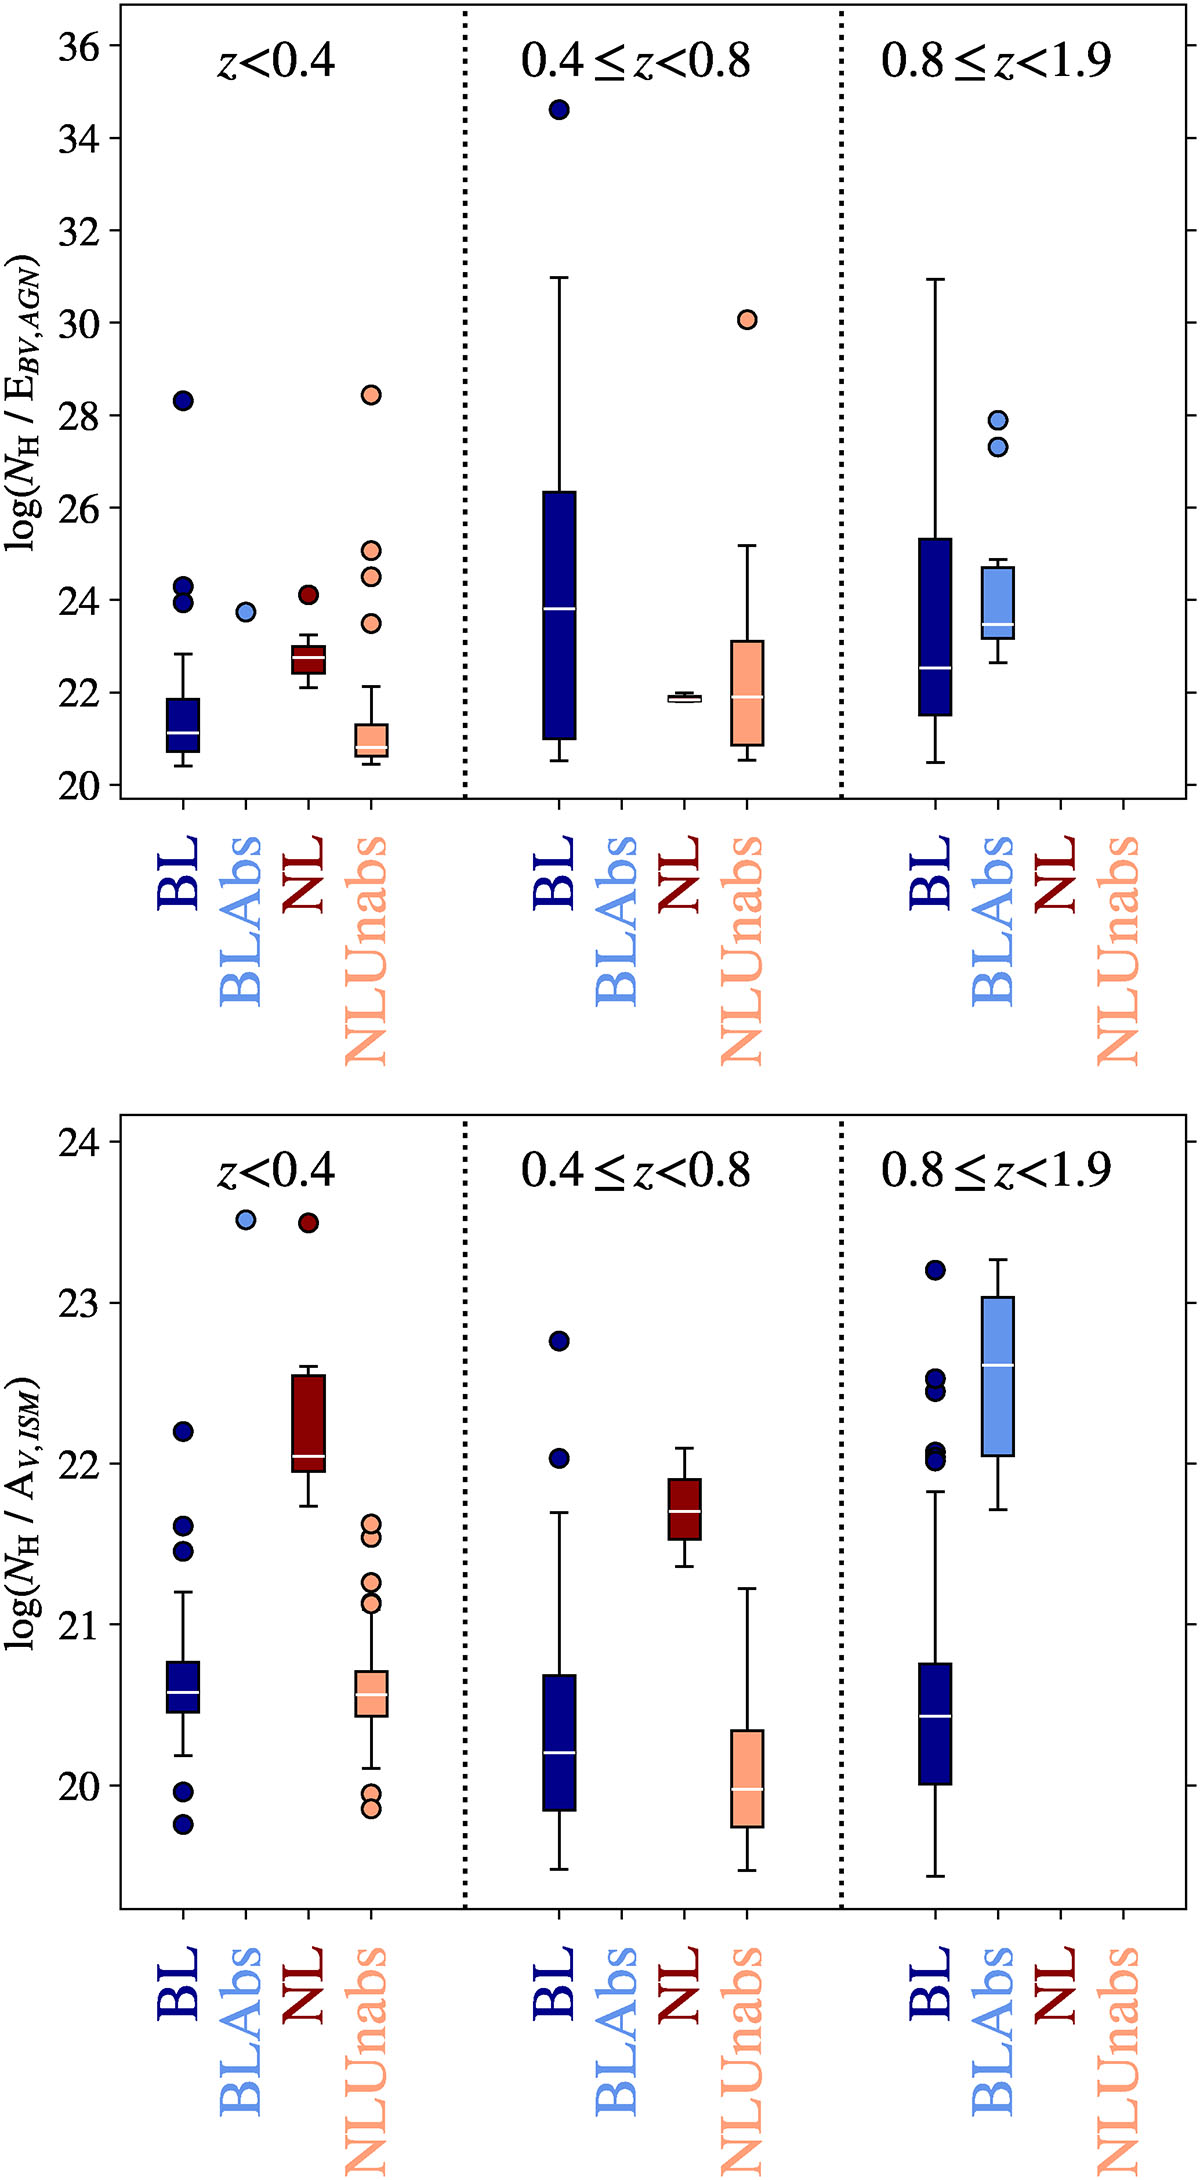
Fig. 6.
Download original image
Gas-to-dust ratios for the four AGN populations, expressed as log(NH/E(B − V)AGN) (top panel) and log(NH/AVISM) (bottom panel). Whiskers extend to 1.5 × IQR, and individual points beyond this range are shown as single circles. Populations with only one available measurement (e.g. BLAbs at z < 0.4) are shown as single points to indicate the lack of statistical constraints. Median values and IQRs for different redshift intervals are presented in Table 4.
Current usage metrics show cumulative count of Article Views (full-text article views including HTML views, PDF and ePub downloads, according to the available data) and Abstracts Views on Vision4Press platform.
Data correspond to usage on the plateform after 2015. The current usage metrics is available 48-96 hours after online publication and is updated daily on week days.
Initial download of the metrics may take a while.