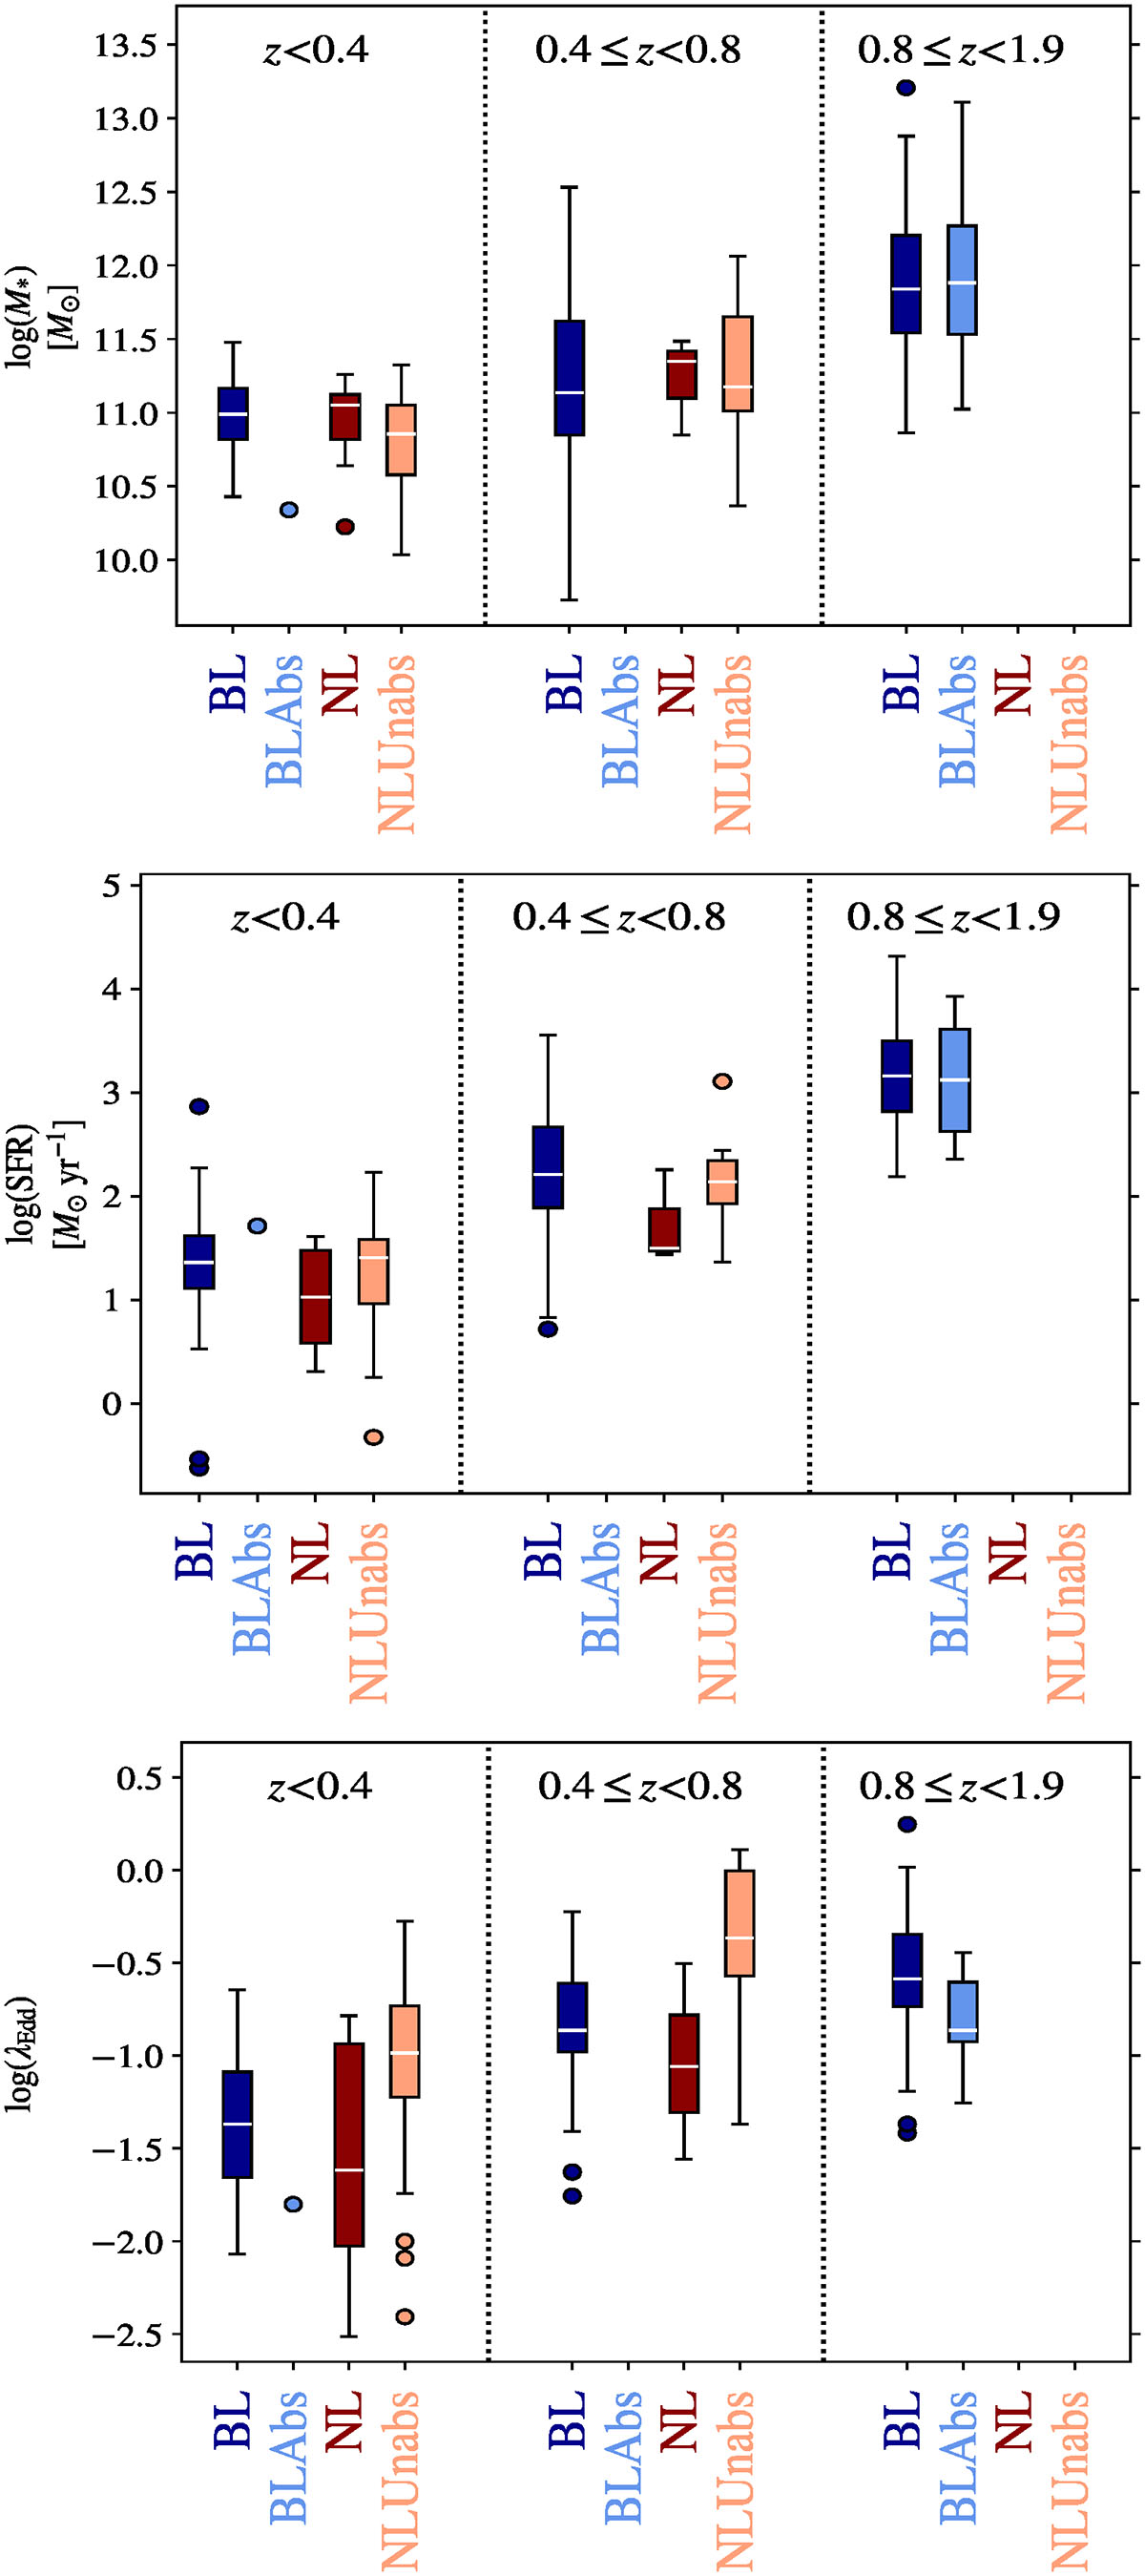
Fig. 8.
Download original image
Box plots of host galaxy stellar mass (M★, top), SFR (middle), and Eddington ratio (λEdd, bottom) for the four AGN populations, in three redshift intervals. Whiskers extend to 1.5 × IQR, and individual points beyond this range are shown as single circles. For classes represented by a single measurement (e.g. BLAbs at low redshift), the individual data point is plotted directly. Median values and IQRs for different redshift intervals are presented in Tables 7, 8, and 9.
Current usage metrics show cumulative count of Article Views (full-text article views including HTML views, PDF and ePub downloads, according to the available data) and Abstracts Views on Vision4Press platform.
Data correspond to usage on the plateform after 2015. The current usage metrics is available 48-96 hours after online publication and is updated daily on week days.
Initial download of the metrics may take a while.