Fig. 4.
Download original image
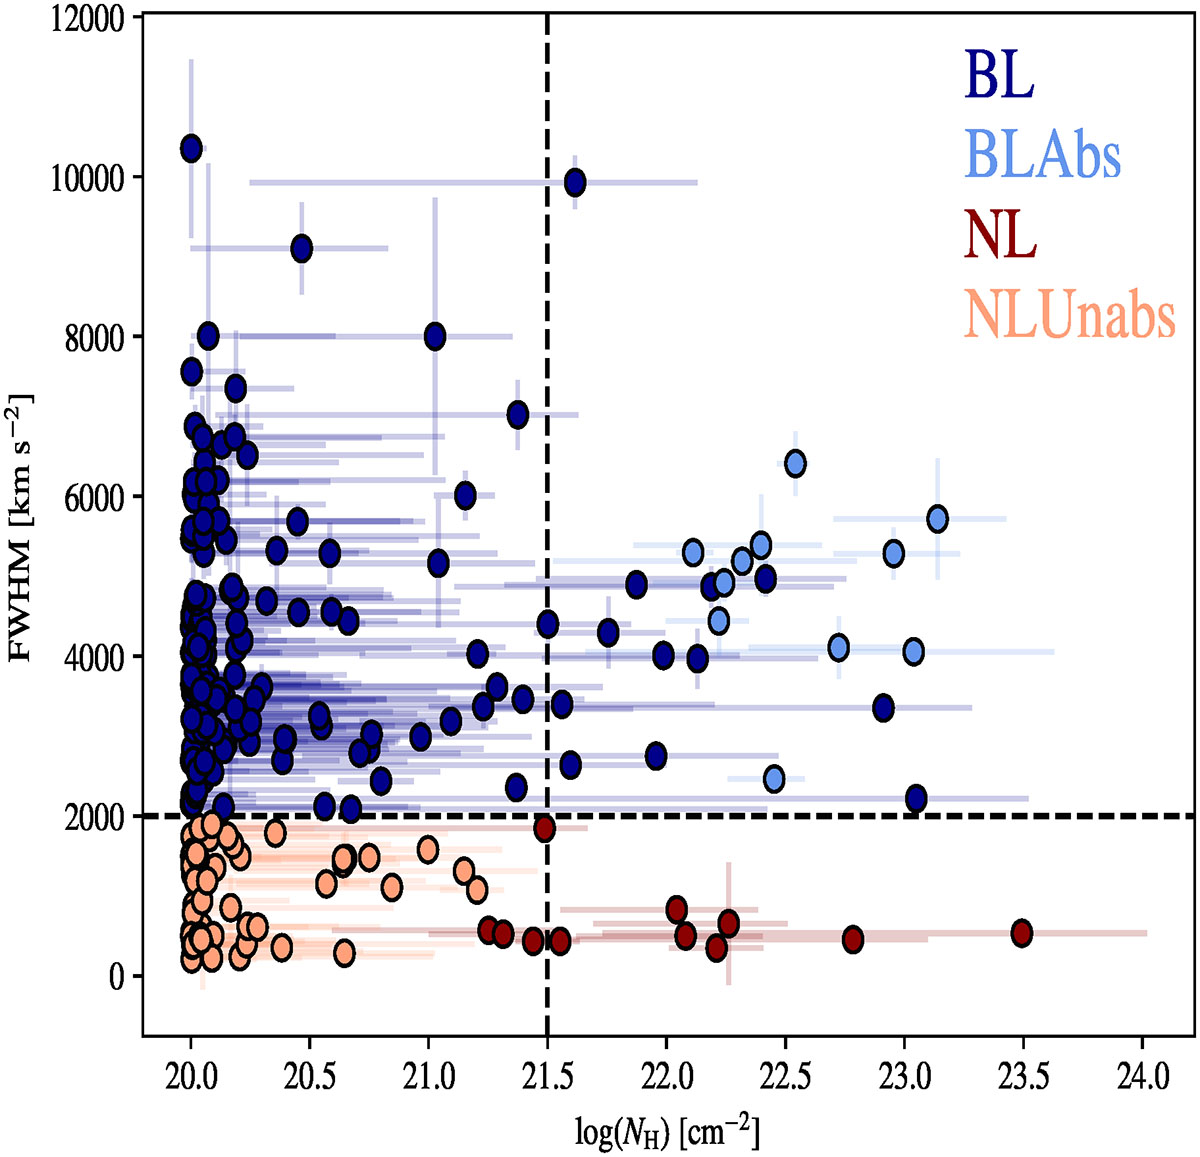
FWHM versus X-ray absorption (NH). Different AGN populations are plotted using the colours and symbols indicated in the legend. The horizontal dashed line marks the FWHM threshold used to separate sources by the width of their optical lines, while the vertical dashed line indicates the NH threshold adopted to identify X-ray–absorbed sources (see text for details).
Current usage metrics show cumulative count of Article Views (full-text article views including HTML views, PDF and ePub downloads, according to the available data) and Abstracts Views on Vision4Press platform.
Data correspond to usage on the plateform after 2015. The current usage metrics is available 48-96 hours after online publication and is updated daily on week days.
Initial download of the metrics may take a while.