| Issue |
A&A
Volume 708, April 2026
|
|
|---|---|---|
| Article Number | A299 | |
| Number of page(s) | 14 | |
| Section | Stellar structure and evolution | |
| DOI | https://doi.org/10.1051/0004-6361/202558169 | |
| Published online | 24 April 2026 | |
Dynamical masses of young stellar objects with the VLBA: DYNAMO-VLBA
Trigonometric parallaxes and proper motions of YSOs in Orion
1
Max-Planck-Institut für Radioastronomie, Auf dem Hügel 69, D-53121 Bonn, Germany
2
Instituto de Radioastronomía y Astrofísica, Universidad Nacional Autónoma de México, Morelia 58089, Mexico
3
Departamento de Astronomía, Universidad de Guanajuato, Apartado Postal 144, 36000 Guanajuato, Mexico
4
Black Hole Initiative at Harvard University, 20 Garden Street, Cambridge, MA 02138, USA
5
David Rockefeller Center for Latin American Studies, Harvard University, 1730 Cambridge Street, Cambridge, MA 02138, USA
6
Department of Physics and Astronomy, University of North Florida, 1 UNF Dr., Jacksonville, FL 32224, USA
7
Instituto Nacional de Astrofísica, Óptica y Electrónica, Apartado Postal 51 y 216, 72000 Puebla, Mexico
8
Instituto de Astronomia, Geofísica e Ciências Atmosféricas, Universidade de São Paulo, Rua do Matão, 1226, Cidade Universitária, 05508-090 São Paulo-SP, Brazil
9
National Radio Astronomy Observatory, Domenici Science Operations Center, 1003 Lopezville Road, Socorro, NM 87801, USA
10
Departament de Física Quàntica i Astrofísica (FQA), Universitat de Barcelona (UB), c/ Martí i Franquès 1, 08028 Barcelona, Catalunya, Spain
11
Institut de Ciències del Cosmos (ICCUB), Universitat de Barcelona (UB), c/ Martí i Franquès 1, 08028 Barcelona, Catalunya, Spain
12
Centre for Astrophysics Research, University of Hertfordshire, College Lane, Hatfield AL10 9AB, UK
13
Center for Astrophysics | Harvard & Smithsonian, 60 Garden St, MS 72 Cambridge, MA 02138, USA
14
Facultad de Ingeniería, Universidad Autónoma de Yucatán, Avenida Industrias No Contaminantes por Anillo Periférico Norte s/n, 97302 Mérida, Yucatán, Mexico
★ Corresponding author: This email address is being protected from spambots. You need JavaScript enabled to view it.
Received:
18
November
2025
Accepted:
10
February
2026
Abstract
We present results from a multi-epoch Very Long Baseline Array (VLBA) survey of compact radio sources in the Orion complex, conducted within both the DYNAMO–VLBA and GOBELINS projects. We detected 216 compact radio sources, of which 58 yielded reliable multi-epoch astrometric solutions. For these sources, we derived trigonometric parallaxes and proper motions with typical precisions of about 0.05 mas and 0.10 mas yr−1, respectively. The measured parallaxes range between 2.26 and 2.65 mas, corresponding to distances of 380–440 pc, and delineate the depth of the Orion star-forming complex. We determined mean distances of 405 ± 16 pc for NGC 2068, 403 ± 5 pc for NGC 2024, 407 ± 12 pc for the σ Orionis region, 388.5 ± 1.7 pc for the Orion Nebula Cluster, and 438 ± 12 pc for L1641. A comparison with Gaia DR3 astrometry for 28 common sources revealed negligible mean parallax offsets (Δϖ= − 0.02 ± 0.01 mas) and small systematic differences in proper motions (∼0.07 mas yr−1), likely due to the residual rotation of the Gaia reference frame. Our results demonstrate the capability of high-precision radio astrometry to map embedded stellar populations and to provide an independent calibration of the Gaia reference system in obscured regions.
Key words: astrometry / parallaxes / proper motions / stars: activity / stars: distances / stars: pre-main sequence
© The Authors 2026
 Open Access article, published by EDP Sciences, under the terms of the Creative Commons Attribution License (https://creativecommons.org/licenses/by/4.0), which permits unrestricted use, distribution, and reproduction in any medium, provided the original work is properly cited.
This article is published in open access under the Subscribe to Open model.
Open access funding provided by Max Planck Society.
1. Introduction
Young stellar objects (YSOs) are often deeply embedded within their natal molecular clouds, where high extinction hinders optical astrometry. Radio interferometry offers a complementary means to locate such sources and to trace their kinematics with sub-milliarcsecond precision. Gyrosynchrotron emission from magnetically active coronae produces compact, nonthermal radio sources that are ideally suited for very long baseline interferometry (VLBI) observations. Facilities such as the Very Long Baseline Array (VLBA) enable the measurement of trigonometric parallaxes and proper motions with micro-arcsecond accuracy (e.g., Menten et al. 2007; Loinard et al. 2007; Dzib et al. 2011).
Over the past decade, advances in wide-field VLBI correlation, particularly the implementation of the DIFX software correlator (Deller et al. 2011), have enabled large multi-epoch surveys that can target hundreds of radio-emitting YSOs within a single primary beam. These surveys, such as Gould’s Belt Distances Survey (GOBELINS; Loinard et al. 2011; Ortiz-León et al. 2017), have provided high-precision astrometry for nearby star-forming regions, complementing and extending the Gaia mission to heavily obscured environments.
The Orion molecular complex represents one of the richest laboratories for studying young stellar populations across a wide range of masses and evolutionary stages. Its distance structure has been investigated through both optical and radio VLBI observations (e.g., Kounkel et al. 2017; Großschedl et al. 2018). The Dynamical Masses of multiple YSOs with the VLBA (DYNAMO-VLBA) project is building upon these previous efforts by obtaining new VLBA observations aimed primarily at monitoring the orbital motions of binary YSOs in nearby star-forming regions. In addition, these observations provide the opportunity to measure precise parallaxes and proper motions not only for known binaries, but also for all compact radio sources within each observed field.
In this first paper of the Orion DYNAMO–VLBA series, we focus on the astrometric results for the full sample of detected radio sources, independent of their multiplicity. We combine our new observations with archival data from the GOBELINS project to derive updated distances to the main Orion subregions and to compare our results with Gaia Data Release 3 (DR3) astrometry. A companion paper (Dzib et al. 2026, hereafter Paper II) will present the detailed orbital analysis and dynamical masses of the binary and multiple systems.
2. Data and analysis methods
2.1. DYNAMO-VLBA observations
The DYNAMO-VLBA observations were obtained under the VLBA project code BD215. For sources in the Orion constellation, we divided our target sources into seven distinct blocks (named from F to L; see Table 1). These blocks were chosen to observe known and suspected binaries that were reported by Kounkel et al. (2017, hereafter KHL17), and are known radio sources. Additionally, each block targeted radio sources located inside the primary beam of the antennas, which mostly consisted of other known YSOs and other radio sources of unknown origin. The blocks were observed a total of six times (labeled from 0 to 5), and the cadence of the observation per block was chosen according to the suspected period of known binaries in the field from GOBELINS results. In total, there are 42 DYNAMO-VLBA observations of targets in Orion, whose epochs are listed in Table 2.
Observed blocks.
DYNAMO–VLBA observed epochs.
The observations were obtained with the VLBA telescope at a central frequency of 5.0 GHz (λ = 6.0 cm) with a total bandwidth of 256 MHz. The total duration of each observation was three hours. The first 25 minutes were spent observing around a dozen quasars distributed over the entire sky (i.e., a geodetic block). The observation continues by pointing three secondary phase calibrators (SPCs), which are observed with one-minute scans. Then, a two-minute scan on the target source bracketed with one-minute scans on a nearby main phase calibrator (MPC) are observed. This cycle is repeated for 30 minutes, when the SPCs are observed once more. The cycle SPCs[3 min] – (MPC[1 min]-target[2 min])[30 min] – SPCs[3 min] is repeated a few times. The last 25 minutes are used to observe a second geodetic block, completing the three-hour observation. All MPCs and SPCs used in these observations are listed in Table 3, together with the position assumed for correlation. These positions are consistent with those used by KHL17 within the GOBELINS project.
Calibrators and the pointed positions in our observations.
The data calibration followed a standard scheme for astrometric phase-referenced VLBI observations and included multiple SPCs and geodetic group-delay blocks. Residual atmospheric and ionospheric phase gradients were mitigated using the AIPS task ATMCA (Fomalont & Kogan 2005), which exploits the information from multiple calibrators to improve phase transfer to the target sources.
This calibration strategy follows the core principles of multi-calibrator (or MultiView) phase referencing, in which spatially distributed calibrators are used to reduce residual atmospheric and ionospheric systematics, particularly important at frequencies around 5 GHz (e.g., Loinard et al. 2007; Dzib et al. 2010; Ortiz-León et al. 2017). While recent dedicated MultiView implementations explicitly model ionospheric phase wedges to further improve astrometric accuracy (e.g., Rioja et al. 2017; Hyland et al. 2022), we did not perform such post-correlation corrections here. Instead, the use of multiple secondary calibrators together with ATMCA provides redundancy in phase transfer and significantly reduces systematic errors, as supported by the empirical error analysis presented in Sect. 3.4.
After calibration, the data were imaged using a pixel size of 200 μas and a square image of size 4096 pixels (i.e.,  ). Then, we proceeded to image the detected brightest emission peak by centering the new image on it, with a pixel size of 100 μas and a square image of size 1024 pixels (i.e.,
  ). Both images used a natural weighting scheme (Robust = 5 in AIPS). The mean noise level in the final images is in the range 20–50 μJy beam−1 (see Table 2).
The positions and flux densities of the detected sources were measured using a 2D Gaussian ellipsoid fitting procedure (AIPS task JMFIT). The measured flux densities are corrected for primary beam attenuation using the same methodology as in other multi-phase-center VLBA experiments (e.g., Deane et al. 2024, O’Kelly et al., in prep.). The primary-beam response was approximated by an Airy pattern corresponding to a uniformly illuminated circular antenna,
 (1)
(1)
In this equation, J1(x) is the Bessel function of order one, D is the antenna diameter, λ is the observing wavelength, and θ is the source angular offset from the pointing center. For the VLBA, we adopted an effective antenna diameter of D = 25.48 m (Middelberg et al. 2013). The corrected flux densities were then obtained by dividing the measured values by P(θ).
Finally, it is worth noticing at this point that source positions have different contributing errors. First, the statistical errors from the fitting. Second, systematic errors as residuals from the phase transfer from the MPC to the target source. These systematic errors are estimated to be on the order of 0.1 mas per each degree of separation between them. Finally, radio active galactic nucleus and quasar positions are constantly being refined with additional VLBI observations from programs of geodesy and absolute astrometry and constitute the Radio Fundamental Catalog (RFC), whose positions are tied to the International Celestial Reference Frame (ICRF); a detailed description is given by Petrov & Kovalev (2025). The positions of the MPCs (see Table 3) used in our observations were obtained more than a decade ago, and differ from their more accurate values known to date (listed in Table A.1). This difference is reflected in the final position of the targets, which are expected to be shifted by the same positional differences of the MPC. In Table 3 we also list the difference between the correlated position and the position reported in the RFC, which we used to correct the position of the detected radio sources after astrometric fitting.
2.2. GOBELINS data
To complement our astrometric analysis, we used VLBA observations reported by KHL17, obtained as part of the GOBELINS project (Ortiz-León et al. 2017, Loinard et al., in prep.). We note that the GOBELINS project observed a total of 46 fields targeting 300 radio sources in Orion previously uncovered with the Very Large Array by (Kounkel et al. 2014). Source properties were reported by KHL17, and we used the source positions listed in their Table 4. Additional, as-yet unpublished, observations of Orion sources were obtained as part of the GOBELINS project after the publication of KHL17. These additional GOBELINS observations were calibrated and imaged using the same procedure described above. Details on these observed epochs are listed in Table 4.
Previously unpublished GOBELINS observations.
DYNAMO-VLBA and GOBELINS observations used the same observation strategy, and common stars in the two projects were observed with the same MPC and SPCs. The MPC and SPC positions for correlation were also the same in the two projects; see also Table 2 in KHL17. This simplifies the astrometric combination of the two datasets. It is important to note, however, that the flux densities reported by KHL17 were not corrected for primary beam attenuation, whereas such corrections were applied in the present work.
2.3. Astrometric fitting equations and procedures
The fitting of the motion of the detected sources was performed according to the complexity of the system. We have classified the sources into four main categories: (1) single stars, (2) astrometric binaries, (3) visual radio binaries, and (4) known spectroscopic or visual binaries.
For single sources, the trajectory on the plane of the sky has been fitted using a combination of proper motion and trigonometric parallax. The equations used in this case are
 (2)
(2)
 (3)
(3)
where (α0, δ0) are the reference coordinates at a given epoch, (μα, μδ) are the components of the proper motion, π is the parallax, and (fα, fδ) represents the parallactic factors projected along right ascension and declination. These projections depend on the barycentric position of Earth and the direction to the source (Seidelmann 1992).
For astrometric binaries, where only one radio source is detected but which exhibit a nonlinear trajectory revealing the presence of an unseen companion, an acceleration term has been added to the model. This approach is appropriate for systems with orbital periods significantly longer than the time span of our observations (typically < 5 years). In such cases, it is reasonable to assume a constant acceleration (see, e.g., Loinard et al. 2007), and the motion is described by
 (4)
(4)
 (5)
(5)
where  (=
(= ) and
) and  are the components of the acceleration in right ascension and declination, respectively.
In the case of visual radio binaries, where the two components are detected simultaneously in radio images at multiple epochs, the position of each component has been fitted by combining the astrometric parameters with the orbital motion around the center of mass of the system:
 (6)
(6)
 (7)
(7)
where Qα(t) and Qδ(t) are the projections of the orbital motion along right ascension and declination, respectively, and a1 is the projected semimajor axis of the orbit for the primary component. When the secondary component is also detected, the same model is applied using a2, taking into account that the two components trace the same orbit but are 180° out of phase with respect to the barycenter.
For known binaries detected as single radio sources, we can use information from the literature (e.g., from spectroscopic observations) to fit the orbital motion of the detected component around the center of mass of the system. In most cases, spectroscopic binaries provide the mass ratio q = M2/M1, but they can also provide other astrometric parameters that can be fixed in our astrometric fits. This approach allows us to estimate the individual stellar masses, even when only one component is detected.
2.4. Gaia DR3
The Gaia DR3 data (Gaia Collaboration 2023), and data from previous catalogs, can be accessed from the Gaia archive1. Using the tools offered in the Gaia archive, we searched for optical counterparts of our detected radio sources. For the cross-matching between radio and optical sources, we used a radius of  .
.
For the matched sources, we retrieved the Gaia renormalized unit weight error (RUWE), which is a goodness-of-fit metric for the single-star astrometric solution. Values significantly larger than unity indicate potentially problematic solutions (e.g., unresolved binarity or calibration issues). In this work, RUWE is used solely as a quality indicator to identify such cases.
3. Results
In this section we present the astrometric results from our observations of the young stellar population with radio emission in the Orion complex. We summarize the detection statistics, describe the identification of background contaminants, provide astrometric solutions for 58 sources, and assess the impact of systematic position errors. The orbital solutions are presented and discussed in the companion Paper II.
3.1. Detection statistics
Due to the limited number of baselines and the high angular resolution of VLBI arrays, the resulting images often contain noise peaks exceeding 5σ, which can lead to false-positive detections (see the discussion in Forbrich et al. 2021). To mitigate this, semi-blind VLBI surveys typically adopt a conservative detection threshold of S/N > 6 (e.g., Herrera Ruiz et al. 2017; Forbrich et al. 2021). In this work we adopted a slightly lower, but still conservative, detection limit of 5.5σ. Sources detected in only one epoch with 5.5 < S/N < 6.0 are classified as candidate detections. In specific cases, we allowed a relaxed threshold down to 5σ when a source position is consistent, within the expected motion from proper motion and parallax, with that of a ≥5.5σ detection from another epoch. In Table 5 we present the properties of all sources detected in Orion from both the GOBELINS and DYNAMO-VLBA projects. We note that, due to our more stringent detection criteria, some of the sources reported by KHL17 are not included in our list.
Properties of detected radio sources.
By combining DYNAMO-VLBA observations with previous and new results from GOBELINS, we detected a total of 200 distinct radio sources across various regions of Orion. Of these, 77 sources (39%) were detected in only one epoch, 44 (22%) in two epochs, 21 (10%) in three epochs, and 58 sources (29%) in more than three epochs. Table 5 lists each source along with the observing project, Julian date of observation, equatorial coordinates (right ascension and declination), statistical position errors derived from jmfit, and measured flux densities with their uncertainties. Multiple entries for a given source correspond to observations from different VLBA projects, all of which are indicated in the table.
Some sources are known to be YSOs. However, the nature of several radio sources remains uncertain. To investigate this, we analyzed the spread of source positions across multiple epochs. We note that position differences are expected for sources at the distances of the Orion star-forming regions. First, the intrinsic proper motions, for example, in the case of the Orion Nebula Cluster (ONC), are on the order of a few milliarcseconds per year (Dzib et al. 2017, 2021). Additionally, there is the periodic apparent motion associated with the trigonometric parallax. For Orion sources (RA ≃ 5–6 h), the dominant parallactic displacement has a peak-to-peak amplitude of 2ϖ≃5 mas and reaches its extrema close to the equinoxes, owing to the geometry of the parallax factors for this sky position. DYNAMO-VLBA, on the other hand, employed a different cadence for observations, with a minimum separation of two months; however, position changes could still be noticeable.
3.2. Astrometric results
The main focus of this paper is to determine accurate trigonometric parallaxes and proper motions for compact radio sources in the Orion complex. We obtained astrometric solutions for single radio sources associated with YSOs that are not known to belong to multiple systems, as well as for several radio sources that are members of binary or multiple systems. Although the orbital analysis of these binaries will be presented in the companion Paper II, we include their measured parallaxes and proper motions here for completeness.
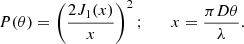
In total, 22 radio sources associated with YSOs and detected in four or more epochs were modeled with parallax and linear proper-motion fits. For five additional sources, the linear solutions yielded relatively large post-fit residuals showing clear periodic variations, suggesting binarity with orbital periods comparable to the VLBA time baseline. Figure 1 illustrates one such case, V* V1399 Ori, which was previously not reported as a binary system; our astrometric residuals reveal a periodic variation consistent with orbital motion. We repeated the fit to these sources and including orbital components, which resulted in substantially improved astrometric solutions. A further 13 radio sources correspond to components of 9 known binary or multiple systems. Together, these 14 multiple systems are the subject of Paper II, where they are analyzed in detail. The resulting astrometric parameters are listed in Table 6. The measured trigonometric parallaxes range from 2.26 to 2.65 mas, consistent with membership in the Orion complex.
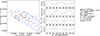 |
Fig. 1. Left: astrometric motion of V* V1399 Ori. Filled circles indicate the measured positions, with 1σ uncertainties. The dotted blue curve shows the best-fit linear model to the motion, with filled squares indicating the model positions at the observed epochs. Measured and model positions are color-coded by observing epoch, and line segments connect the corresponding epochs. The dotted red line represents the motion after subtracting the trigonometric parallax, with red squares indicating the corresponding model positions. Central panels: Position offsets in declination (top) and right ascension (second panel) as a function of time, obtained after subtracting the best-fit linear proper motion, together with the best-fit parallax model (dashed lines). The two lower panels show the post-fit residuals in declination and right ascension. Symbols are color-coded by observing epoch, as in the left panel. Right: Parameters derived from the linear motion fit. |
VLBA astrometric parameters at epoch J2016.0.
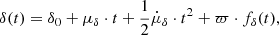
Following a similar approach as Galli et al. (2018), for each source, we computed the unique pairwise position (absolute) differences between detections in different epochs and then estimated the mean of these differences. In Fig. 2 we plot the histograms of the estimated separations. We note that the histograms are strongly peaked at separations below ∼1.5 mas, with a clear tail toward larger values corresponding to sources with measurable astrometric motion. We therefore adopted 1.5 mas as an empirical threshold separating sources whose inter-epoch positional changes are consistent with the typical residual astrometric uncertainties from those exhibiting statistically significant motion. In this context, sources with position changes < 1.5 mas are likely background sources and will be discussed in Sect. 3.3. Sources with larger positional shifts are likely young stars in star-forming regions of Orion.
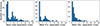 |
Fig. 2. Histograms showing the separation of sources through epochs. |
An additional 18 sources are detected only two or three times and show significant positional displacements (see Sect. 3.1). For these, we determined barycentric positions at the reference epoch 2016.0 and fitted proper motions by fixing the parallax to π = 2.5 ± 0.35 mas, adopted as a representative value within the distance range of the Orion subregions. These sources are listed in Table 7.
VLBA proper motions of YSOs detected in two or three epochs determined by assuming a trigonometric parallax of ϖ = 2.50 ± 0.35 mas.
3.3. Background sources
There are radio sources whose positions remain consistent across different observed epochs, with mean inter-epoch positional differences ≲1.5 mas (see Fig. 1), consistent with the expected level of systematic errors (Sect. 3.4), indicating that they are likely background Galactic or extragalactic sources. Regarding GOBELINS results, Kounkel et al. (2017) noticed the following cases:2 VLBA 39, 40, 41, 42, 47, 48, 55, 56, 83, 84, 85, 88, 89, 90, 94, 95, 96, 146, and 147. In addition to these sources, we also noted that the following radio sources have no indications of measurable parallaxes and proper motions: VLBA 1, 2, 15, 17, 21, 23, 24, 25, 29, 30, 31, 35, 36, 38, 43, 44, 49, 52, 54, 57, 65, 66, 70, 71, 72, 73, 74, 75, 76, 77, 78, 79, 87, 91, 92, 97, 98, 99, 100, 101, 102, 128, 139, 144, 151, 156, and 166. These sources are also listed in Table 5 for completeness; however, we did not further analyze them.
The case of VLBA 2 is noteworthy. It is a background radio source, likely extragalactic, located  from the center of the ONC and has a flux density of 5 mJy, and a variability of ∼10%. While its flux density is too low to serve as an MPC, it could be used for additional phase corrections in future VLBI observations of the ONC to improve phase calibration. Such a strategy has successfully been used in the past for other VLBA observations (e.g., Dzib et al. 2013).
3.4. Systematic position errors
In modeling the motion of the radio sources, we initially accounted for only the statistical position uncertainties, including the contribution from thermal noise, derived from JMFIT. For weak sources, this thermal-noise component dominates the formal positional uncertainty. However, as noted in Sect. 2, these errors reflect image-fitting uncertainties alone and do not account for additional sources of error, such as phase transfer imperfections. Estimating the magnitude and origin of such systematic errors is inherently challenging.
To compensate for residual position errors introduced during phase transfer, we adopted a procedure in which systematic uncertainties were added in quadrature to the statistical errors until the reduced χred2 = 1.0 was achieved in the astrometric fits. This adjustment was performed independently for each source, depending on its flux density and number of detections. On average, the additional systematic errors required were σα,sys = 0.27 mas and σδ,sys = 0.39 mas. Because these are post-fit residuals conditioned on the best-fit astrometric model, their distribution is expected to be narrower than that of unconditioned Gaussian measurement errors, and a high fraction of points within ±1σ does not imply overestimated uncertainties.
We further assessed these systematic errors using a subset of background radio sources identified in previous sections. Assuming these are predominantly extragalactic (and thus have negligible motion), any measured positional offsets between epochs can be interpreted as an empirical estimate of residual systematics. Figure 3 shows histograms of the measured position differences for these sources, with dispersions of 0.25 mas in right ascension and 0.46 mas in declination, values consistent with those added during our astrometric fits. This agreement supports the robustness of the systematic error model we adopted.
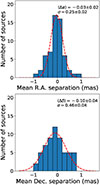 |
Fig. 3. Histograms showing the pairwise separation of background sources through epochs. |
Additionally, we note that the positions of the MPCs used in this work were not corrected using the latest available reference frame solutions. Since target positions are directly tied to the MPC positions, this implies that target coordinates also inherit any systematic offsets. For consistency with future comparisons, we have opted to report uncorrected positions in Table 5, while the MPC positions and differences with current catalogs are listed in Table 3.
We justify this choice by noting that radio calibrator catalogs are continuously refined with new VLBI observations. Providing uncorrected target positions allows for more consistent future comparisons, using whatever MPC positions are available at the time. Nevertheless, we emphasize that when comparing our astrometry with external datasets (e.g., Gaia), the MPC position offsets should be accounted for. Therefore, after performing the astrometric fits, we applied the corresponding current MPC correction (see Table 3) to the final derived positions (at epoch J2016.0).
4. Discussion
Our VLBA observations of YSOs in Orion provide one of the most comprehensive astrometric datasets available for this region. The precision of these measurements enables us not only to trace the internal kinematics of individual stars and multiple systems, but also to derive robust dynamical masses and refine the distances to the main star-forming regions. In this section we discuss the implications of our results in three contexts. First, we examine the orbital solutions of binary and multiple systems and compare the derived dynamical masses with predictions from stellar evolutionary models. Second, we utilize the parallaxes of individual sources to constrain the distances to different subregions of Orion, thereby placing them within the broader framework of the complex 3D structure. Finally, we compare our VLBA results with those from Gaia DR3 to evaluate potential systematics in both datasets and to assess the consistency between radio and optical reference frames.
4.1. Distances to star-forming regions within Orion
Precise distances are essential for characterizing stars, their environment, and related phenomena. In star-forming regions, obtaining accurate distance estimates to all individual stars can be challenging due to high extinction, variability, and stellar crowding. Consequently, it is common practice to adopt a single representative distance per region, based on a subset of well-measured sources.
Using the parallaxes listed in Table 5, we computed weighted average parallaxes and distances for the five observed regions in Orion. The results are given in Table 8, together with previous VLBA estimates from KHL17. Although the larger number of epochs in our data would normally lead to smaller uncertainties, the errors reported by KHL17 are often smaller. This is because their analysis does not account for residual systematic effects (e.g., phase gradients) and, in some cases, relies on only three detections, making their quoted uncertainties likely optimistic. For this reason, we do not interpret the comparison as a strict statistical consistency test based solely on the quoted uncertainties. Quantitatively, the distance differences (this work − KHL17; Table 8) are +17 pc (NGC 2068), −20 pc (NGC 2024), +0.5 pc (ONC), and +10 pc (L1641), corresponding to 0.9σ, 1.3σ, 0.1σ, and 0.6σ, respectively. For σ Orionis, KHL17 do not provide a regional distance estimate, and the value listed in Table 8 refers to a single problematic source; it is therefore not used for a region-level comparison.
Mean parallaxes and distances to Orion star-forming regions derived from VLBA (this work) and Gaia DR3 data.
We further compared our VLBA-based distances with independent estimates derived from Gaia DR3. We selected Gaia sources with 2.222 ≤ ϖ ≤ 2.85 mas and RUWE ≤1.4, and adopted region-dependent search radii encompassing the spatial extent of each complex. For L1641, owing to its elongated morphology and the small number of VLBA detections, we used the mean position of the two radio sources and a 10′ search radius. The adopted parameters and resulting weighted averages are summarized in Table 8.
The VLBA and Gaia parallaxes agree within ≲2σ for most regions when the quoted uncertainties are combined in quadrature. The largest offsets occur for NGC 2024 (∼2σ level) and for the ONC (∼3σ). These differences should be interpreted cautiously, given the small number of regions and the presence of residual systematic effects in both datasets. In the case of NGC 2024, local astrophysical effects such as internal substructure may also contribute (van Terwisga et al. 2020).
Finally, for each region we assessed whether the observed parallax dispersion indicates measurable line-of-sight depth. The expected dispersion (σexp) was estimated as the rms of the individual parallax uncertainties, and the intrinsic dispersion was defined as  when σobs > σexp, and zero otherwise. For both VLBA and Gaia data, we find σobs ≤ σexp in all regions, yielding σint = 0 within the uncertainties. Thus, no statistically significant depth is detected, and the observed distance dispersions should be interpreted as upper limits on the physical extent along the line of sight.
4.2. Comparison with Gaia
The astrometric precision of VLBI observations provides a unique opportunity to assess and validate the accuracy of Gaia DR3 measurements. In this section we directly compare the positions, parallaxes, and proper motions derived from our VLBI analysis with those reported by Gaia for sources common to the two datasets. This comparison allows us to quantify systematic differences, examine possible offsets, and assess the consistency between the radio and optical reference frames. We first examine positional offsets, then extend the analysis to parallax and proper motion measurements.
4.2.1. Positions
The astrometric precision achieved with VLBI is comparable to that of Gaia. For those radio sources with full astrometric solutions from our VLBI fitting (Table 6) and with counterparts in the Gaia archive, we conducted a direct comparison of the derived positions. We identified 28 such sources with entries in Gaia DR3. In Table B.1 we report the VLBI–Gaia positional offsets in right ascension (ΔVGα), declination (ΔVGδ), and total separation (ΔVG,total).
Previous studies have reported systematic offsets between VLBI and Gaia positions (e.g., Lindegren 2020; Dzib et al. 2021; Lunz et al. 2023). For example, Dzib et al. (2021) found a systematic offset of 1.03 ± 0.16 mas in declination between VLBA and Gaia DR2 positions in the ONC. In that work, the phase calibrator (J0541–0541) had a reported positional correction of 0.23 mas, which does not fully account for the observed discrepancy (Dzib et al. 2021).
To reexamine this issue, we followed a similar approach as Dzib et al. (2021) using our expanded and updated dataset. Figure 4 shows the distribution of the VLBI–Gaia position offsets. We classified the sources into three categories: (i) those known to be binary or multiple systems, for which astrometric solutions included orbital or acceleration terms (green points); (ii) sources with elevated RUWE values (RUWE > 1.4), suggesting unresolved multiplicity or astrometric anomalies (red points); and (iii) likely single stars, with RUWE ≤1.4 and no additional orbital modeling (black points).
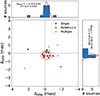 |
Fig. 4. Distribution of the differences between Gaia and VLBA positions. The central panel shows the offsets in right ascension and declination for three categories of sources: single stars (black circles), sources with RUWE > 1.4 (red stars), and sources identified as multiple systems (green crosses). The red ellipse represents a 3σ contour derived from a 2D Gaussian fit to the single-star and RUWE ≤1.4 distributions. The top and right panels display the corresponding histograms of offsets in right ascension and declination, respectively, for single stars, and RUWE ≤1.4. Dashed red lines show the best-fit Gaussian models, with the fitted mean and standard deviation indicated in each subplot. |
For the single-star sample, we constructed histograms of the position offsets in right ascension and declination and fitted Gaussian distributions. The resulting mean offsets are −0.19 mas (RA) and −0.28 mas (Dec), with standard deviations of 0.27 and 0.20 mas, respectively, reflecting the overall scatter of the offset distributions.
Individual sources can exhibit offsets at the milliarcsecond level (see Table 6), arising from a combination of measurement uncertainties, residual systematics, and source-specific effects. To assess whether a global systematic offset is present, the relevant quantity is the uncertainty on the mean offset, given by the standard error of the mean ( ). For N = 12 sources, this yields uncertainties of ∼0.08 mas (RA) and ∼0.06 mas (Dec). The measured mean offsets are therefore small compared to the overall scatter and indicate no evidence for a large global systematic positional offset between the VLBA and Gaia reference frames.
Based on the width of the offset distributions, we adopted a conservative threshold of 1.0 mas (approximately 3σ) to assess whether VLBA and Gaia sources are co-located; larger separations can indicate unresolved multiplicity or non-coincidence between the optical and radio emission. Finally, we note that both VLBI and Gaia astrometric calibrations have improved since the earlier analysis by Dzib et al. (2021), which likely contributes to the reduced level of systematic offsets in the present results.
4.2.2. Parallax and proper motions
A comparison between astrometric results from Gaia and VLBI is highly valuable for assessing consistency and identifying potential systematic effects. It is well established that Gaia parallaxes suffer from a zero-point offset, which leads to a systematic overestimation of distances. This offset was first identified in Gaia DR2 (Lindegren et al. 2018) and varies with sky position, G-band magnitude, and (BP–RP) color. For Gaia DR2, the zero-point offset was estimated to lie between −29 and −80 μas (Lindegren et al. 2018), whereas for Gaia Early Data Release 3 (EDR3) and Gaia DR3 the global mean offset is closer to −17 μas (Lindegren et al. 2021).
Proper motion systematics in Gaia are subtler. Although the global zero-point for proper motions is generally consistent with zero (Lindegren et al. 2021), the reference frame of bright stars is known to exhibit rotation relative to the extragalactic reference frame, introducing systematic proper motion biases ranging from 10 to 80 μas yr−1 (Lindegren 2020; Cantat-Gaudin & Brandt 2021).
VLBI has played a crucial role in validating the Gaia parallax zero point. For instance, Xu et al. (2019) compared parallaxes from Gaia DR2 with those from VLBI, finding a systematic offset of −75 ± 29 μas. More recently, Ding et al. (2025) compared parallaxes from Gaia DR3 with those derived from Hubble Space Telescope, VLBI, and orbital solutions. Their best estimate of the parallax zero point came from the VLBI comparison, yielding an offset of −14.8 ± 10.6 μas, consistent with the expected DR3 offset.
In contrast, studies specifically quantifying systematic offsets in Gaia proper motions using VLBI are less common. While comparisons exist (e.g., Lindegren et al. 2021; Dzib et al. 2021; Cantat-Gaudin & Brandt 2021), systematic frame offset analyses have primarily been carried out using a limited number of bright radio stars. Notably, Lindegren (2020) analyzed the spin of Gaia bright-star reference frame using VLBI positions, confirming a small but measurable rotation.
With this context in mind, we now compare VLBA parallaxes and proper motions with those from Gaia DR3 for sources with reliable matches. In the top panels of Fig. 5, we plot Gaia DR3 values against the corresponding VLBI results. Points are color-coded: red for sources likely in multiple systems (based on binary classification, RUWE > 1.4, or position offsets ΔVG,total > 1.0 mas), and black for likely single stars.
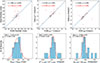 |
Fig. 5. VLBA-Gaia parallax (left panel) and proper motion (μα* in the center, and μδ to the right) comparisons. Top panels: scatter plots of measured values. Red symbols indicate sources related to multiple systems, and black symbols are likely single sources. The dashed line is the equality line, which is included for eye guidance. The determined correlation coefficient (r) and its statistical significance are included in each case. Lower panels: histograms showing the differences between VLBI and Gaia EDR3 astrometric parameters for matched likely single sources. |
We computed the Pearson correlation coefficient (r) for each case. For single stars, the correlation is strong (r ≥ 0.87) and statistically significant, indicating excellent agreement between VLBI and Gaia. For sources in multiple systems, the correlation weakens, likely due to un-modeled orbital motion in the Gaia solution.
For the single-star subsample, we further analyzed the differences in astrometric parameters between Gaia and VLBI. The bottom panels of Fig. 5 show histograms of these differences. We find a mean parallax offset of −0.02 ± 0.01 mas and a standard deviation of 0.06 ± 0.01 mas, indicating consistency within uncertainties and no statistically significant offset. However, the proper motion differences are +0.07 ± 0.02 mas yr−1 in right ascension and −0.08 ± 0.02 mas yr−1 in declination. These offsets are statistically significant at the 3.5σ and 4σ levels, respectively. Although small, they may reflect residual rotation in the Gaia reference frame, as previously reported.
4.3. Discussion on individual sources
4.3.1. Brun 555
is listed as the radio source with the largest proper motion in our sample. However, we point out that this proper motion is likely not real, but rather the result of detecting two distinct radio sources. This is supported by its positional shift with its Gaia counterpart, which is of a similar magnitude to the measured proper motion. The proper motion of its Gaia counterpart is low and compared with the values of other stars in the region(Dzib et al. 2021). Because its low number of detections (2), no further astrometric analysis is possible, and this star is not discussed among the binary stars in Paper II.
We report two radio sources associated with the star V* LQ Ori. Each radio source was detected in two epochs, and, interestingly, none of them appears to coincide with the position of its Gaia counterpart. We note that Forbrich et al. (2021) and Dzib et al. (2021) previously reported a radio source related to this star and observed with the VLBA; their source [FMR2016] 37. Interestingly, the Gaia-radio position shift they reported is 56.8 mas, which is different from those measured with the radio sources here reported.
KHL17 reported two radio sources, VLBA 81 and VLBA 82, which we associated with the star HD 288313B, the companion of the intermediate-mass star HD 288313. The two sources were detected in the same observed epoch, with a separation of about  , significantly smaller than the known separation of
  between the optical components of the system. Because both radio detections occurred in a single epoch, these authors did not discuss them further. Nevertheless, we notice that systems of this kind are of particular interest, as multi-epoch VLBA monitoring can yield full orbital solutions and dynamical masses (see, e.g., Paper II).
[BCB89] IRS 15 is known to be a YSO. The position changes of the associated radio source VLBA 58, detected through 17 epochs, were nicely described by a linear motion. The associated Gaia source has RUWE = 1.1, also consistent with single–star astrometry. However, several clues suggest that the system could, in fact, be multiple. First, in their first observed epoch, (KHL17) reported three radio sources associated with this object, VLBA 58 (S/N = 15), VLBA 59 (S/N = 9.0), and VLBA 60 (S/N = 5.8). Although only VLBA 58 was detected in subsequent epochs by either GOBELINS or DYNAMO–VLBA. Second, the position offset between the Gaia and the VLBA radio source is 2.13 mas, exceeding the 1 mas co-location threshold established in our analysis above. Finally, the Gaia and VLBA proper motions in right ascension are inconsistent at a level ∼3σ. Even though [BCB89] IRS 15 is likely a multiple system, its luminosity and mass appear dominated by a single component, which explains the nearly linear astrometric behavior observed in both datasets.
CXOU J054146.1−015622 is a visual radio binary where two components are clearly detected in several epochs. However, in the epoch BD215-J0, we detected only one radio source whose measured position falls in the middle of the expected positions of the two components detected in the other epochs. Thus, we could not clearly associate the radio source detected in this epoch with any of the radio sources known in this system. Consequently, we could not unambiguously associate this detection with either of the known components. It remains uncertain whether this additional emission originates from a third, unresolved companion or from transient magnetospheric activity between the stars, such as large-scale magnetic structures (e.g., helmet streamers; Massi et al. 2008). In our catalog, we identified this radio source as VLBA 61-62.
We associated four compact radio sources with the variable star V* V363 Ori. Two of them, VLBA 105 and VLBA 158, were originally reported by KHL17. VLBA 105 was detected in a total of five epochs, including two new detections presented here. VLBA 158 was detected in one epoch at a separation of ∼17 mas from VLBA 105. Two additional faint sources were detected in single epochs in our new observations, following the International Astronomical Union (IAU) naming convention: J053540.77481−050901.5226 (epoch BL175K0; S/N = 6.3) and J053540.78209−050901.6597 (epoch BD215F4; S/N = 5.8). None of these sources is coincident with the Gaia DR3 position of V* V363 Ori. The Gaia astrometric solution for this star has a high RUWE value (8.9), suggesting that its motion deviates from a simple linear model and may be affected by multiplicity. Given the relatively low S/N of several detections, we cannot exclude the possibility that some of the faintest sources are spurious. Nonetheless, the presence of multiple, spatially clustered detections around V* V363 Ori makes this system an interesting candidate for future high-sensitivity monitoring to confirm its multiplicity.
The X-ray source COUP 625 was associated with three distinct compact radio sources; VLBA 109 (detected in three epochs), VLBA 142 (detected in one epoch), and DYNAMO-VLBA J053514.3318–052317315 (detected in one epoch). Sources VLBA 109 and VLBA 142 are associated with the radio sources [FRM2016] 177-1 and [FRM2016] 177-2 reported by Forbrich et al. (2021) and Dzib et al. (2021), which have also been observed with the VLBA.
We report the first detection of a mas-scale radio source associated with θ1 Ori C. The radio source was detected at a S/N = 6.7 in a single epoch. We notice that its position is offset by about 14 mas to the east from the optical position of the massive star. θ1 Ori C is known to have a companion with an eccentric orbit, with an orbital period of 11.26 ± 0.05 years, and semimajor axis of 44 ± 3 mas (Kraus et al. 2009). Given the orbital configuration of this system (see Fig. 8 in Kraus et al. 2009) it is likely that the radio source is associated with this companion. However, the estimated mass of the companion, ∼11 M⊙ (Balega et al. 2014), places it well above the mass range of magnetically active stars typically responsible for nonthermal radio emission. Additional multi-epoch VLBA observations will be required to confirm the nature of the detected source.
The radio source VLBA 13, was detected in four epochs. A linear proper-motion fit does not adequately reproduce the positional changes, suggesting possible multiplicity or orbital motion. The nearest bright optical counterpart in the Gaia DR3 catalog is associated with the massive star θ2 Ori A, located at an angular separation of  from the radio source; thus, it is not listed in Table B.1. The position angle of the radio source relative to the massive star is 296°. Preibisch et al. (1999) reported a 3–7 M⊙ companion to θ2 Ori A located at a separation of 383 ± 10 mas with a position angle of
  . Because of the similar configuration, we associate the radio source with this companion.
5. Conclusions
This work presents new VLBA observations of YSOs in the Orion complex as part of the DYNAMO-VLBA project. The multi-epoch astrometry yields accurate parallaxes and proper motions for radio-emitting YSOs across several subregions of Orion, extending the reach of previous VLBI campaigns such as GOBELINS and offering improved astrometric solutions tied to the ICRF. The derived parallaxes confirm that Orion spans a depth of about 40 parsecs along the line of sight, with the ONC in the front edge of the complex at ∼389 ± 2 pc.
A direct comparison of VLBI astrometry with Gaia DR3 results for the subset of sources with reliable optical counterparts shows that the positional offsets between VLBI and Gaia are small, with no significant systematic shift detected for the likely single-star sample. Parallax measurements were also consistent, showing a negligible mean offset of −0.02 ± 0.01 mas. These findings are further evidence of the excellent agreement of the two techniques and validate the reported Gaia zero-point correction for its DR3 catalog. However, we did find statistically significant differences in proper motions: +0.07 ± 0.02 mas yr−1 in right ascension and −0.08 ± 0.02 mas yr−1 in declination. These results may reflect small residual systematics in the Gaia reference frame or physical effects related to unresolved binary motion in either dataset.
The DYNAMO–VLBA dataset thus provides the most accurate radio-based distances yet obtained for Orion, which can be used as a base for future comparison with the coming Gaia catalogs. By combining the present results with the forthcoming orbital analyses of multiple systems (Paper II), the DYNAMO-VLBA project offers a comprehensive view of the structure and dynamics of young stars in one of the nearest and most important star-forming regions.
Data availability
Table 5 is available at the CDS via https://cdsarc.cds.unistra.fr/viz-bin/cat/J/A+A/708/A299
Acknowledgments
We thank the anonymous referee for their constructive comments that helped improve the clarity and quality of this paper. S.A.D. acknowledges the M2FINDERS project from the European Research Council (ERC) under the European Union’s Horizon 2020 research and innovation programme (grant No 101018682). L.L. acknowledges the support of DGAPA-PAPIIT grant IN108324 and SECIHTI grant CBF-2025-I-109. G.N.O.L. acknowledges the financial support provided by Secretaría de Ciencia, Humanidades, Tecnología e Innovación (Secihti) through grant CBF-2025-I-201. P.A.B.G. acknowledges financial support from the São Paulo Research Foundation (FAPESP, grant: 2020/12518-8) and Conselho Nacional de Desenvolvimento Científico e Tecnológico (CNPq, grant: 303659/2024-6). J.M.M.S. acknowledges financial support from the State Agency for Research of the Spanish Ministry of Science and Innovation under grants PID2022-136828NB-C41 and EX2024-001451-M funded by MICIU/AEI/10.13039/501100011033/ERDF/EU The National Radio Astronomy Observatory is a facility of the National Science Foundation operated under cooperative agreement by Associated Universities, Inc.
References
- Balega, Y. Y., Chentsov, E. L., Leushin, V. V., Rzaev, A. K., & Weigelt, G. 2014, Astrophys. Bull., 69, 46 [Google Scholar]
- Cantat-Gaudin, T., & Brandt, T. D. 2021, A&A, 649, A124 [NASA ADS] [CrossRef] [EDP Sciences] [Google Scholar]
- Deane, R. P., Radcliffe, J. F., Njeri, A., et al. 2024, MNRAS, 529, 2428 [Google Scholar]
- Deller, A. T., Brisken, W. F., Phillips, C. J., et al. 2011, PASP, 123, 275 [Google Scholar]
- Ding, Y., Liao, S., Wen, S., & Qi, Z. 2025, AJ, 169, 211 [Google Scholar]
- Dzib, S., Loinard, L., Mioduszewski, A. J., et al. 2010, ApJ, 718, 610 [NASA ADS] [CrossRef] [Google Scholar]
- Dzib, S., Loinard, L., Rodríguez, L. F., Mioduszewski, A. J., & Torres, R. M. 2011, ApJ, 733, 71 [NASA ADS] [CrossRef] [Google Scholar]
- Dzib, S. A., Rodríguez, L. F., Loinard, L., et al. 2013, ApJ, 763, 139 [Google Scholar]
- Dzib, S. A., Loinard, L., Rodríguez, L. F., et al. 2017, ApJ, 834, 139 [Google Scholar]
- Dzib, S. A., Forbrich, J., Reid, M. J., & Menten, K. M. 2021, ApJ, 906, 24 [NASA ADS] [CrossRef] [Google Scholar]
- Dzib, S. A., Ordonez-Toro, J., Loinard, L., et al. 2026, A&A, 708, A300 [NASA ADS] [CrossRef] [EDP Sciences] [Google Scholar]
- Fomalont, E., & Kogan, L. 2005, AIPS Memo 111, https://www.aips.nrao.edu/aipsmemo.html [Google Scholar]
- Forbrich, J., Dzib, S. A., Reid, M. J., & Menten, K. M. 2021, ApJ, 906, 23 [NASA ADS] [CrossRef] [Google Scholar]
- Gaia Collaboration (Vallenari, A., et al.) 2023, A&A, 674, A1 [NASA ADS] [CrossRef] [EDP Sciences] [Google Scholar]
- Galli, P. A. B., Loinard, L., Ortiz-Léon, G. N., et al. 2018, ApJ, 859, 33 [Google Scholar]
- Großschedl, J. E., Alves, J., Meingast, S., et al. 2018, A&A, 619, A106 [Google Scholar]
- Herrera Ruiz, N., Middelberg, E., Deller, A., et al. 2017, A&A, 607, A132 [NASA ADS] [CrossRef] [EDP Sciences] [Google Scholar]
- Hyland, L. J., Reid, M. J., Ellingsen, S. P., et al. 2022, ApJ, 932, 52 [Google Scholar]
- Kounkel, M., Hartmann, L., Loinard, L., et al. 2014, ApJ, 790, 49 [Google Scholar]
- Kounkel, M., Hartmann, L., Loinard, L., et al. 2017, ApJ, 834, 142 [Google Scholar]
- Kraus, S., Weigelt, G., Balega, Y. Y., et al. 2009, A&A, 497, 195 [NASA ADS] [CrossRef] [EDP Sciences] [Google Scholar]
- Lindegren, L. 2020, A&A, 633, A1 [Google Scholar]
- Lindegren, L., Hernández, J., Bombrun, A., et al. 2018, A&A, 616, A2 [NASA ADS] [CrossRef] [EDP Sciences] [Google Scholar]
- Lindegren, L., Bastian, U., Biermann, M., et al. 2021, A&A, 649, A4 [EDP Sciences] [Google Scholar]
- Loinard, L., Mioduszewski, A. J., Torres, R. M., et al. 2011, Rev. Mex. Astron. Astrofis., 40, 205 [Google Scholar]
- Loinard, L., Torres, R. M., Mioduszewski, A. J., et al. 2007, ApJ, 671, 546 [NASA ADS] [CrossRef] [Google Scholar]
- Lunz, S., Anderson, J. M., Xu, M. H., et al. 2023, A&A, 676, A11 [NASA ADS] [CrossRef] [EDP Sciences] [Google Scholar]
- Massi, M., Ros, E., Menten, K. M., et al. 2008, A&A, 480, 489 [NASA ADS] [CrossRef] [EDP Sciences] [Google Scholar]
- Menten, K. M., Reid, M. J., Forbrich, J., & Brunthaler, A. 2007, A&A, 474, 515 [NASA ADS] [CrossRef] [EDP Sciences] [Google Scholar]
- Middelberg, E., Deller, A. T., Norris, R. P., et al. 2013, A&A, 551, A97 [NASA ADS] [CrossRef] [EDP Sciences] [Google Scholar]
- Ortiz-León, G. N., Loinard, L., Kounkel, M. A., et al. 2017, ApJ, 834, 141 [Google Scholar]
- Petrov, L. Y., & Kovalev, Y. Y. 2025, ApJS, 276, 38 [NASA ADS] [CrossRef] [Google Scholar]
- Preibisch, T., Balega, Y., Hofmann, K.-H., Weigelt, G., & Zinnecker, H. 1999, New Astron., 4, 531 [NASA ADS] [CrossRef] [Google Scholar]
- Rioja, M. J., Dodson, R., Orosz, G., Imai, H., & Frey, S. 2017, AJ, 153, 105 [NASA ADS] [CrossRef] [Google Scholar]
- Seidelmann, P. K. 1992, Explanatory Supplement to the Astronomical Almanac. A Revision to the Explanatory Supplement to the Astronomical Ephemeris and the American Ephemeris and Nautical Almanac [Google Scholar]
- van Terwisga, S. E., van Dishoeck, E. F., Mann, R. K., et al. 2020, A&A, 640, A27 [NASA ADS] [CrossRef] [EDP Sciences] [Google Scholar]
- Xu, S., Zhang, B., Reid, M. J., Zheng, X., & Wang, G. 2019, ApJ, 875, 114 [NASA ADS] [CrossRef] [Google Scholar]
The source numbers quoted here follow the VLBA numbering scheme introduced by Kounkel et al. (2017) and can be directly cross-matched with the source names given in Table 5
Appendix A: Current calibrator positions
The positions of calibrators are being refined over time. The most recent values are listed in the RFC described by Petrov & Kovalev (2025). Its most recent version is the 2025B and is available through https://astrogeo.org/rfc/. In Table A.1 we list the RFC 2025B positions of the calibrators used in this work.
Calibrators and positions from the RFC 2025B.
Appendix B: VLBA and Gaia astrometric solutions
This appendix presents the complete astrometric solutions derived from the VLBA observations, together with the corresponding Gaia DR3 parameters and their positional differences at epoch J2016.0. In addition to the parallaxes and proper motions summarized in Table 6, Table B.1 includes the VLBA–Gaia offsets, the Gaia derived parallaxes and proper motions, and their corresponding RUWE values, allowing a detailed source-by-source comparison between the two datasets.
VLBA and Gaia parallaxes and proper motions.
All Tables
VLBA proper motions of YSOs detected in two or three epochs determined by assuming a trigonometric parallax of ϖ = 2.50 ± 0.35 mas.
Mean parallaxes and distances to Orion star-forming regions derived from VLBA (this work) and Gaia DR3 data.
All Figures
|
Fig. 1. Left: astrometric motion of V* V1399 Ori. Filled circles indicate the measured positions, with 1σ uncertainties. The dotted blue curve shows the best-fit linear model to the motion, with filled squares indicating the model positions at the observed epochs. Measured and model positions are color-coded by observing epoch, and line segments connect the corresponding epochs. The dotted red line represents the motion after subtracting the trigonometric parallax, with red squares indicating the corresponding model positions. Central panels: Position offsets in declination (top) and right ascension (second panel) as a function of time, obtained after subtracting the best-fit linear proper motion, together with the best-fit parallax model (dashed lines). The two lower panels show the post-fit residuals in declination and right ascension. Symbols are color-coded by observing epoch, as in the left panel. Right: Parameters derived from the linear motion fit. |
| In the text | |
|
Fig. 2. Histograms showing the separation of sources through epochs. |
| In the text | |
|
Fig. 3. Histograms showing the pairwise separation of background sources through epochs. |
| In the text | |
|
Fig. 4. Distribution of the differences between Gaia and VLBA positions. The central panel shows the offsets in right ascension and declination for three categories of sources: single stars (black circles), sources with RUWE > 1.4 (red stars), and sources identified as multiple systems (green crosses). The red ellipse represents a 3σ contour derived from a 2D Gaussian fit to the single-star and RUWE ≤1.4 distributions. The top and right panels display the corresponding histograms of offsets in right ascension and declination, respectively, for single stars, and RUWE ≤1.4. Dashed red lines show the best-fit Gaussian models, with the fitted mean and standard deviation indicated in each subplot. |
| In the text | |
|
Fig. 5. VLBA-Gaia parallax (left panel) and proper motion (μα* in the center, and μδ to the right) comparisons. Top panels: scatter plots of measured values. Red symbols indicate sources related to multiple systems, and black symbols are likely single sources. The dashed line is the equality line, which is included for eye guidance. The determined correlation coefficient (r) and its statistical significance are included in each case. Lower panels: histograms showing the differences between VLBI and Gaia EDR3 astrometric parameters for matched likely single sources. |
| In the text | |
Current usage metrics show cumulative count of Article Views (full-text article views including HTML views, PDF and ePub downloads, according to the available data) and Abstracts Views on Vision4Press platform.
Data correspond to usage on the plateform after 2015. The current usage metrics is available 48-96 hours after online publication and is updated daily on week days.
Initial download of the metrics may take a while.