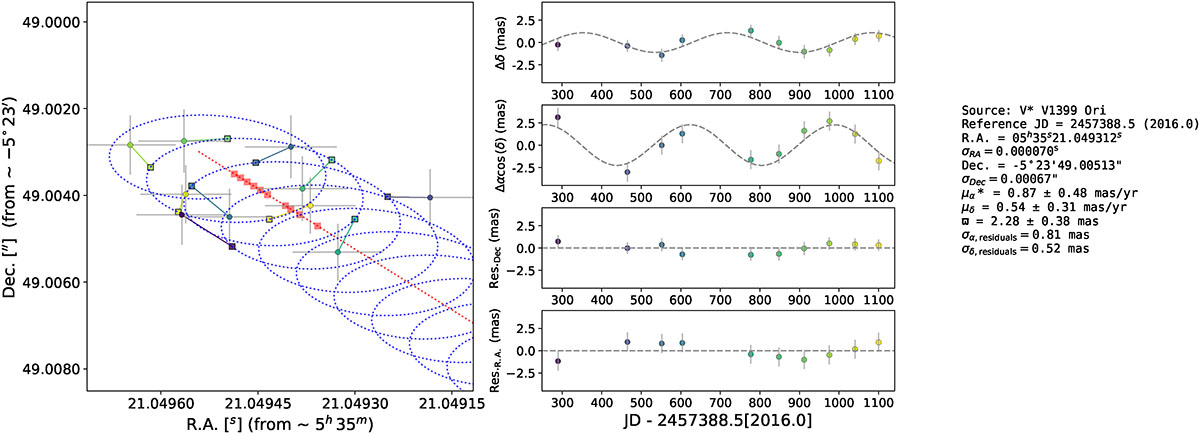
Fig. 1.
Download original image
Left: astrometric motion of V* V1399 Ori. Filled circles indicate the measured positions, with 1σ uncertainties. The dotted blue curve shows the best-fit linear model to the motion, with filled squares indicating the model positions at the observed epochs. Measured and model positions are color-coded by observing epoch, and line segments connect the corresponding epochs. The dotted red line represents the motion after subtracting the trigonometric parallax, with red squares indicating the corresponding model positions. Central panels: Position offsets in declination (top) and right ascension (second panel) as a function of time, obtained after subtracting the best-fit linear proper motion, together with the best-fit parallax model (dashed lines). The two lower panels show the post-fit residuals in declination and right ascension. Symbols are color-coded by observing epoch, as in the left panel. Right: Parameters derived from the linear motion fit.
Current usage metrics show cumulative count of Article Views (full-text article views including HTML views, PDF and ePub downloads, according to the available data) and Abstracts Views on Vision4Press platform.
Data correspond to usage on the plateform after 2015. The current usage metrics is available 48-96 hours after online publication and is updated daily on week days.
Initial download of the metrics may take a while.