| Issue |
A&A
Volume 686, June 2024
|
|
|---|---|---|
| Article Number | A176 | |
| Number of page(s) | 12 | |
| Section | Celestial mechanics and astrometry | |
| DOI | https://doi.org/10.1051/0004-6361/202243818 | |
| Published online | 11 June 2024 | |
Very long baseline interferometry detection of nearby (<100 pc) young stars
Pilot observations
1
Max-Planck-Institut für Radioastronomie,
Auf dem Hügel 69,
53121
Bonn,
Germany
e-mail: This email address is being protected from spambots. You need JavaScript enabled to view it.
2
Instituto de Radioastronomía y Astrofísica, Universidad Nacional Autónoma de México,
58090,
Morelia,
Michoacán,
Mexico
3
Max-Planck-Institut für Astronomie,
Königstuhl 17,
69117
Heidelberg,
Germany
Received:
19
April
2022
Accepted:
6
March
2024
Abstract
To increase the number of sources with very long baseline interferometry (VLBI) astrometry available for comparison with the Gaia results, we have observed 31 young stars with recently reported radio emission. These stars are all in the Gaia DR3 catalog and were suggested, on the basis of conventional interferometry observations, to be nonthermal radio emitters and are therefore good candidates for VLBI detections. The observations were carried out with the Very Long Baseline Array (VLBA) at two epochs separated by a few days and yielded ten detections (a roughly 30% detection rate). Using the astrometric Gaia results, we extrapolated the target positions to the epochs of our radio observations and compared them with the position of the radio sources. For seven objects, the optical and radio positions are coincident within five times their combined position errors. Three targets, however, have position discrepancies above eight times the position errors, indicating different emitting sources at optical and radio wavelengths. In one case, the VLBA emission is very likely associated with a known companion of the primary target. In the two other cases, we associated the VLBA emission with previously unknown companions, but further observations will be needed to confirm this.
Key words: radiation mechanisms: non-thermal / techniques: interferometric / astrometry / stars: kinematics and dynamics
© The Authors 2024
 Open Access article, published by EDP Sciences, under the terms of the Creative Commons Attribution License (https://creativecommons.org/licenses/by/4.0), which permits unrestricted use, distribution, and reproduction in any medium, provided the original work is properly cited.
This article is published in open access under the Subscribe to Open model.
Open Access funding provided by Max Planck Society.
1 Introduction
Stellar radio astrometry with very long baseline interferometry (VLBI) at centimeter wavelengths achieves angular resolutions of a few milli-arcseconds and an astrometric accuracy on the order of 0.1 mas (e.g., Reid & Honma 2014). For young stars, VLBI radio astrometry has primarily been used to better constrain star-forming region distances, which were poorly known at the time or were debated due to discrepant results from indirect methods (e.g., Loinard et al. 2005, 2007; Dzib et al. 2010; Ortiz-León et al. 2017b). In young stars, radio emission detectable with VLBI is nonthermal and is produced in stellar coronae (Güdel 2002) that typically extend up to a few radii and remain unresolved with VLBI observations at centimeter wavelengths. Thus, the astrometry derived from these radio observations directly traces the stellar motion. Recently, the Gaia mission (Gaia Collaboration 2016, 2021, 2023) has been delivering astrometry of over a billion stars, including many nearby young stars. Not surprisingly, Gaia results have confirmed the astrometric results previously reported using the VLBI technique (e.g., Ortiz-León et al. 2018; Galli et al. 2019).
Gaia and VLBI astrometry accuracies are comparable, so the two techniques are complementary (e.g. Dzib et al. 2021). Comparing trigonometric parallaxes measured with both can constrain the Gaia zero-point offset (Lindegren et al. 2018; Lindegren 2020; Riess et al. 2018; Zinn et al. 2019; Xu et al. 2019). Also, high precision VLBI astrometry allows for the linking of the optical stellar reference frames to the radio extra-galactic reference frame since VLBI stellar astrometry is relative to them (Lestrade et al. 1999). Recently, Lindegren (2020) analyzed 41 stars in the Gaia catalog with existing VLBI stellar astrometry. He noticed discrepancies between the VLBI and Gaia-derived astrometry and rejected 15 stars for further analysis. These rejected stars are binary and multiple systems that do not comply with the linear motion prescription currently used for Gaia astrometry. From the remaining 26 stars, he estimated the rotation of the Gaia bright stars (G ≤ 13 mag) reference frame with respect to the distant quasar frame (the so-called Gaia Celestial Reference Frame). Lindegren (2020) recognized that stellar VLBI astrometry can provide independent astrometric results that could be used to test results from current and future Gaia releases. He also noted that for this purpose, it will be necessary to re-observe stars with VLBI and identify new stars that can be detected with the VLBI technique. There are, however, few stars with suspected nonthermal radio emission that have not already been observed with the VLBI technique.
Looking to increase the number of stars with both VLBI and Gaia astrometry, the main goal of the present work is to obtain VLBI observations of nearby young stars with suspected nonthermal radio emission and compare their positions with those reported by Gaia. Here we report VLBI observations of 31 nearby (<100 pc) young stars (<100 Myr) that were recently reported to be radio emitters by Launhardt et al. (2022). These authors also suggested that the radio emission is likely of nonthermal nature and could thus be detected with VLBI observations. The stars have optical counterparts, and most of them are bright stars in the Gaia catalog. In Table 1, these stars are listed together with their astrometric solution from Gaia DR3 (Gaia Collaboration 2021, 2023) and other known properties.
Target sources.
Observed epochs.
2 Observations
The observations were obtained at 20 epochs in the first half of 2021 with the Very Long Baseline Array (VLBA) using the C-band receivers (λ = 6.0 cm; v = 4.8 GHz). This band was selected as a compromise between the angular resolution, strength of radio fluxes, and the high sensitivity offered by this band. We used the newly offered recording bit rate of 4 Gbps, which improves the sensitivity of the array by a factor of  with respect to the previous system for an equal observing time. For the present observations, about 45 min were spent on each target source per observation, expecting a noise level of 19 µJy beam−1, while with the previous system was 27 µJy beam−1.
2.1 Observation strategy
The radio emission from the stars in our sample is known to be rapidly variable, and thus we scheduled two observing runs separated by a few days to increase the chances of detection. The observations were scheduled close to the maximum trigonometric parallax extension in right ascension so that they could be combined with future observations to measure the trigonometric parallaxes of the detected sources. The observing dates are listed individually for all 31 radio stars in Table 2.
As the target sources are weak, phase-referencing was used (e.g., Lestrade et al. 1990; Beasley & Conway 1995). This means that the target observing scans (2 min.) are bracketed with scans (1 min.) on a relatively bright quasar with an angular separation of ≲3º. The phase corrections determined for the quasar were transferred to the target so the target source positions are referenced to the quasars. The use of this technique, including antenna slewing time, increases the total telescope time by 60% (for instance, for 30 minutes on source, we would need 48 minutes in total). Additionally, to reduce the impact of errors in the troposphere models used by the correlator, we observed so-called geodetic blocks (i.e., ~15-minute blocks at the beginning and/or middle and/or end of the observation) dedicated to observations of five to six bright quasars distributed over the entire sky (Reid & Brunthaler 2004).
To reduce the overheads caused by the geodetic blocks, we organized the targets into 11 groups of sources with similar right ascensions (and therefore also similar dates of maximum parallax elongation). We named these groups using alphabetic letters from A to K. We have one group of one target, three groups of two targets, four groups of three targets, and three groups of four targets (see Table 2). For the groups with one and two targets, we used two geodetic blocks (at the beginning and the end of the session). For groups with three or four targets, we used three geodetic blocks (at the beginning, middle, and end of the sessions). A second advantage of the grouping strategy is that we could schedule the observations such that the (u, υ) plane coverage is maximized. This was achieved by intertwining several blocks of 24 min of the different sources with similar right ascension throughout the duration of the session.
2.2 Calibration and imaging
The data were edited and calibrated using the software Astronomical Image Processing System (AIPS; Greisen 2003). After a detailed inspection, flawed data were removed. The data were calibrated following the standard schemes plus a calibration of the group delay (i.e., the rate of phase change with frequency). The calibration of the group delay was used to further reduce systematic errors caused by tropospheric zenith delays and ionospheric content delays (Reid & Brunthaler 2004). With this purpose, we additionally observed ICRF quasars distributed over the sky over a wide range of frequencies (also known as the geodetic blocks; Reid & Brunthaler 2004). First, the geodetic block data were calibrated using a standard procedure. Second, the clock delays and tropospheric terms were derived using the AIPS task DELZN and applied to the target data set using the CALIB. A detailed description of the calibration strategy has been summarized by Loinard et al. (2007); Dzib et al. (2010) and Ortiz-León et al. (2017b).
After calibration, the data were imaged in two steps. First, for the detection experiment, the (u, υ) data of the two epochs for each target were combined using the task DBCON in AIPS. This was done with the purpose of decreasing the noise level in the images (by a factor of  ) and increasing the chances of detections. Some of the target sources have very high proper motion (up to 250 mas yr−1, see Table 1), so before concatenating the data of the two observed epochs, we corrected the position of the second epoch to coincide with that of the first epoch. This procedure is described in Appendix A. After the concatenation of the two epochs, we imaged large areas around the expected positions of the target sources. These images are 2″ × 2″ with 4096 pixels, 500 µas each, along both directions, and they used a natural weighting scheme (Robust = 5 in AIPS)1.
In the second step, a new image was obtained for each source around the peak emission on the first image. These new images are 0.1″ × 0.1″ with 1024 pixels, 100 µas each, and they also used natural weighting. We consider a source detection when the peak value has a signal-to-noise ratio (SNR) >6.5 in this last image (see discussion by Forbrich et al. 2021). The final images were produced at the position of the detected sources in each of the data sets of individual epochs using the parameters of the previous image. Only in two cases was the detected emission strong enough (with S /N > 20) that we could produce final images using an intermediate weighting scheme between natural and uniform (Robust=0 in AIPS; Briggs 1995) and obtain a better position measurement. The rms noise levels in the final images are ~20 µJy beam−1, similar to the VLA images reported by Launhardt et al. (2022). The flux densities and positions of the detected sources were measured using a two-dimensional Gaussian fitting procedure (task JMFIT in AIPS). Statistical errors resulting from JMFIT are given for each detection in Cols. 4 and 6 in Table 4. Additionally, systematic residual phase errors caused by the transfer of the calibration from the phase calibrator to the target were expected. These errors are on the order of 0.1 mas per degree of the angular separation (e.g., Reid et al. 2017). Given that the maximum angular separation between our targets and their phase calibrators is 3°.2, our systematic errors are expected to be ≤0.32 mas. These systematic errors were calculated specifically for each detected target source. Overall, we note that the position errors for weak sources (Sν,peak < 200 µJy beam−1) are dominated by the statistical errors, and for the strongest sources, they are dominated by the systematic residual phase errors.
3 Results
Radio emission was detected for ten of our 31 targets. The properties of the final images and the flux densities are listed in Table 3, and the positions of the radio sources are given in Table 4.
In the plots of Fig. 1, we show an example of a detected radio source, and the remaining images of other detected radio sources are shown in Fig. A.1. In most cases, single sources are detected in the images. A possible exception is source HD 199143, where two emission peaks separated by a few milli-arcseconds are detected in the first epoch. Given the low signal-to-noise ratio of the second peak, however, it is not possible to clearly establish that the second peak is a real source. Sources HD 82558 and HD 82159 are single sources in both epochs, but their positions change appreciably from one epoch to the next due to their high proper motion. As mentioned earlier, the combined image aligns both epochs to the position in the first image. The radio sources are rapidly variable, and in several cases, their flux density changes by a factor larger than two in a few days. This high variability was also noticed in the VLA observation (Launhardt et al. 2022) and is typical of stellar sources with magnetic activity (e.g., Güdel 2002).
4 Discussion
4.1 Comparison with VLA results
The radio sources associated with our target stars are listed in Table 1 and were first reported by Launhardt et al. (2022). These authors measured the variability of the radio sources and pointed out that they are nonthermal emitter candidates, motivating the follow-up VLBA observations presented here. We confirm the nonthermal nature of the radio sources detected with the VLBA, as they require brightness temperatures > 106 K to be detected with interferometric baselines of ~8000 km (see chapter 9 of Thompson et al. 2017). These brightness temperatures are a strong indication of the nonthermal radio emission associated with young stars (Feigelson & Montmerle 1999).
The angular resolution of VLA images presented by Launhardt et al. (2022) is ~2″, which is insufficient to resolve potential tight binaries. As an example, in the case of EC 95 in Serpens, VLA observations showed the presence of a single radio source (Eiroa et al. 2005). Follow-up VLBA observations showed that the radio source is a hierarchical triple system, with three nonthermal variable radio emitters unresolved at the VLA angular resolution. The first VLBA observations of EC 95 showed a close binary with an angular separation of about 15 mas (Dzib et al. 2010), and later a third radio source was detected at an angular distance of about 140 mas from the close binary (Ortiz-León et al. 2017a). Because of their variability, not all components were detected in all observed epochs. Thus, whether the radio sources detected in this work are identical to the radio sources reported by Launhardt et al. (2022) needs to be analyzed. Indeed, the analysis by Launhardt et al. (2022) showed that, in some cases, the radio emission can have contributions from both components in known binary systems or be related to an unknown companion.
For our analysis, we compared the positions derived from the VLBA and the VLA. First, we assumed that the radio sources share the trigonometric parallax and proper motions of the associated stars reported by Gaia (see Table 1) to extrapolate the positions reported from the VLA observations to the epoch of the corresponding first VLBA observation. Then, we computed the offset between the position determined by the VLBA observations and the extrapolated position from VLA observations (∆αradio, ∆δradio and ∆θradio). The position offsets of these radio observations are listed in Cols. 7–9 of Table 4 and are shown graphically in Figs. 2 and B.1. Given the differences in angular resolution, the dominant error in the position offsets is the VLA position error, which is two orders of magnitude larger than those from the VLBA.
The offsets between the VLA and VLBA positions are less than three times the errors for nine out of the ten detected sources. In these cases, the VLA and VLBA radio sources presumably correspond to the same emitting source. In the case of HD 199143, the separation is larger than three times the errors. This indicates that the radio source detected with the VLBA corresponds to a different object than the one reported from VLA observations. Launhardt et al. (2022) argued that the radio source detected in the VLA observations is positionally consistent with the expected position of the fainter companion, HD 199143 B (not in the Gaia DR3 catalog), located 0″.84 northwest of the main stellar component (Hagelberg et al. 2020, see also Fig. 2). In the next section, we show that the radio source detected in the VLBA images corresponds to the primary stellar component in this system or to a very nearby companion.
Image properties and measured fluxes of detected radio sources.
Astrometry of detected radio sources.
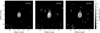 |
Fig. 1 VLBA images of the radio source related to V 875 Per. The images are centered in the position of the radio source as detected in the first epoch (see Table 4). Images, from left to right, correspond to epochs 1, 2, and the combination of both epochs. Contour levels are −3, 3, 6, 9, 12, and 15 times the noise level of the image as listed in Table 3. The yellow open ellipse in the bottom−left corner represents the size of the synthesized beam of the image as listed in Table 3. The predicted optical position in epochs 1 and 2 are shown as red and cyan crosses, respectively. |
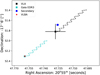 |
Fig. 2 Positions of the radio and optical sources related to HD 199143. The red star indicates the position of the radio source in the first detected epoch by the VLBA observations. The Cyan dashed line indicates the optical trajectory of the primary component of the HD 199143 stellar system from 2016.0 to the epoch of detection of the radio source with the VLBA. The optical position of the star at the VLBA observed epoch is indicated with the cyan square. The blue square indicates the position of the secondary, HD 199143 B, whose absolute coordinates are unknown. Coordinates relative to the primary from the WDS catalog were used to estimate the absolute position. Gaia DR3 and VLBA position errors are smaller than the symbol sizes. The black line is the trajectory followed by the radio source detected with the VLA (Launhardt et al. 2022), assuming the derived astrometry at optical wavelengths from the VLA observed epoch to the VLBA observed epoch. The black square indicates the extrapolated position of the VLA radio source at the epoch of the VLBA detection. The black cross size indicates the VLA positional error. |
4.2 Comparison with optical astrometry
To examine the relationship between the radio sources detected with the VLBA and the targeted stars, we have used the astrometric results from optical wavelengths (i.e., Gala) to determine the stellar positions at the epoch of the VLBA observations. Then, we determined the angular offsets between the radio source and the optical counterpart (∆ = Posradio − PosOpt.). The initial parameter uncertainties (optical: position, proper motion, and parallax; radio: position) were propagated to estimate the angular separation error by using a Monte Carlo approach. In Cols. 10, 11, and 12 of Table 4, we list the angular separation in right ascension, ∆α* = ∆α · cos (Dec) and in declination, (∆δ), and the total angular separation (∆θ) between the VLBA and optical sources. Expected systematic errors in the source position caused by residual phase calibration errors are listed in column 11 and were added quadratically to the errors provided by JMFIT.
Seven of the ten radio sources are consistent with the expected position from Gaia results within five times the errors. We argue that, in these cases, the radio emission is tracing the stellar corona of the stars seen at optical wavelengths. Stellar coronae of young stars could be of sizes up to 10 R* (see the review by Güdel 2002). For a conservative value for the stellar radii, we assumed 1 R* = 1.15 R⊙, as the observed stars are of spectral types F8 or later and about to enter the main sequence. At the distances of our targets, this implies angular sizes of less than 2.9 mas. On the other hand, the measured positions of the other three radio sources (HD 62237, SAO 135659, and HD 199143) are not consistent with the results from Gaia, and the offset cannot be attributed to the stellar coronae structure, as they would require structures greater than 40 R*.
To look for clues on the origin of the radio-optical position discrepancies in these three sources, we first turned to the Gaia results. The Gaia catalog includes a measure of the quality of the astrometric fits called the renormalized unit weight error (RUWE; listed Table 5 for our targets). The RUWE index is expected to be close to 1.0 for stars whose motion is well described by a uniform linear motion, while a large RUWE value (>1.4) indicates a significant deviation from a linear uniform motion and is suggestive of the presence of an unseen companion. Interestingly, two of the three sources where we found discrepancies between the VLBA and optical positions (HD 62237 and SAO 135659) have very large RUWE values (7.3 and 13.8, respectively). A second relevant piece of information is provided by the proper motion anomaly (PMa) introduced by Kervella et al. (2019) and Kervella et al. (2022) and listed in the fifth column of Table 5. The PMa quantifies discrepancies between the proper motions measured by the HIPPARCOS and Gaia astrometric missions. A large PMa indicates significantly different proper motions in the HIPPARCOS and Gaia catalogs and suggests the presence of a low-mass companion with an orbital period larger than the Gaia observation window (668 days for Gaia DR3). The third source where we found a discrepancy between the VLBA and optical positions (HD 199143) has a very large PMa (56.7).
In summary, the three sources where the VLBA and optical positions do not coincide have astrometric evidence of multiplicity. In contrast, the sources where the VLBA and optical positions do coincide have RUWE values close to unity and either small PMa values or no PMa at all.
Given the evidence presented above that the sources with discrepant VLBA and optical positions are multiple, our next step was to look for known companions. We searched the Washington Visual Double Star Catalog (WDS; Mason et al. 2001, 2022) for companions to our target stars2. We list the stellar companions and their angular separation in Table 5. In cases where there is more than one known companion, we include only the companion with the smallest angular separation to the targeted star. For HD 62237 and HD 199143, the angular separation of the visual binaries is much larger than the VLBA-optical astrometric discrepancy ∆θ. In the case of SAO 135659, however, the values are comparable. We come back to this point momentarily. We also investigated if our targets had been reported as spectroscopic binaries. Four of our target sources (HD 22213, SAO 135659, GJ 4199, and HD 199143) were included in the spectroscopic analysis by Zúñiga-Fernández et al. (2021). Only HD 22213 was confirmed as a spectroscopic binary. In particular, none of the stars with discrepant optical and VLBA positions are a known spectroscopic binary.
Armed with the information gathered for each system, we are now in a position to discuss the three targets where the VLBA and optical positions do not coincide. Particularly, we discuss if the origin of the position discrepancy can be explained by known companions.
Firstly, SAO 135659 is known to be a binary star with stellar components of similar masses (0.77 and 0.64 M⊙ for the primary and secondary, respectively). The angular separation of the system is ~0″.1 almost in the north-south direction at the epoch of the observations reported by Elliott et al. (2015). At a distance of 50 pc and given the total mass, we can estimate the period of the system to be roughly 9 years. Coincidentally, this is similar to the separation between the observations realized by Elliott et al. (2015) in May 2012 and our VLBA observations in April 2021. Consequently, we expect the relative offset between the two stars to also be on order of ~0″.1 in the north-south direction at the time of our VLBA observations. In our observations, the position of the VLBA source was found to be located about ~0″.07 north of the expected Gaia position (Fig. B.1). The similarity between the relative position of the optical and VLBA sources and the expected relative positions of the two stars in SAO 135659 strongly suggests that the VLBA source is associated with the secondary (WDS 08138-0738). The small difference in separation (~0″.1 vs. ~0″.07) could easily be caused by the somewhat different orbit phase seen during our observations compared to those of Elliott et al. (2015) and by the fact that Gaia presumably traces the position of the photocenter of the system rather than the exact position of the primary.
The source HD 199143 exhibits a large PMa. The detailed analysis from Launhardt et al. (2022) shows that this can be explained by the known companion HD 199143 B located at ~0″.84 (see Fig. 12 from Launhardt et al. 2022). The VLA source reported by Launhardt et al. (2022) coincides with that companion (see also Fig. 2). The VLBA source we detect here, however, is located very near the primary of the system (Fig. 2). The small but significant offset between the VLBA position and the expected position of the primary (4.4 ± 0.5 mas) could be due to the presence of another hitherto undetected companion located very close to the primary. Given the small offset, however, further observations will be needed. To finish on this source, we note that we searched for a second VLBA radio source in the expected position of the companion but found none. The flux of the companion star was below 110 µJy beam−1 (6.5 times the noise level in our image) during the VLBA observations. The radio source detection by Launhardt et al. (2022) and the one reported here is interesting but unsurprising, and it points to the highly variable nature of the radiation mechanisms in magnetically active stars (e.g., Güdel 2002).
Regarding HD 62237, it has no known companion, but the large Gaia RUWE value strongly suggests that such a companion exists. We argue that the VLBA source, offset by about 27 mas from the expected position of the primary, traces that companion. We note that, given the modest resolution of the VLA observations reported by Launhardt et al. (2022), the VLA source could coincide with either the primary or the secondary puta− tively traced by the VLBA (Fig. 2). This companion should be less luminous than the primary star, as a clear offset between the Gaia and VLBA positions indicates that the system photo− center is coincident or close to the primary star. However, the mass of the companion must be significant to cause the linear fitting by Gaia DR3 to not properly describe the motion of the system (RUWE value is 7.3). The spectral type of HD 62237 is G5V, indicating a star with a mass of 0.93 M⊙ (Zombeck 1990). Assuming that the companion has a mass between 0 and 0.5 M⊙, the mass of the system ranges from 0.93 to 1.43 M⊙. We also assume that the optical-radio offset of 26.6 ± 0.6 mas (3.32 ± 0.08 au at a distance of 124.76 pc) is the semi-major axis of the orbit, and we roughly estimate an orbital period of the system in the range from 5.1 to 6.3 yr.
Previous companion information.
5 Conclusions
We have presented a series of VLBA observations of a sample of 31 nearby young stars previously reported as radio sources, obtaining ten detections (for a detection rate on the order of 30%). The radio sources are compact at our angular resolution of a few milli-arcseconds and are highly variable; both properties confirm they are nonthermal radio emitters. All detected radio sources are associated with stars with good astrometry from Gaia DR3. Using these results, we extrapolated the position of the optical stars to the epoch of the radio observations to compare the radio and optical positions. For seven of the ten detected radio sources, the optical and radio positions are consistent. Three radio sources, however, have position discrepancies above eight times the errors. All three of these sources show independent evidence of multiplicity, and we attribute the position discrepancies to the presence of companions.
Follow-up observations of the detected radio sources will be of high interest for comparison with Gaia astrometry. Such observations could provide some clues on the Gaia parallax zero point and on the relative orientation of the Gaia and ICRF reference frames by increasing the current numbers of stars with Gaia- and VLBI-derived astrometry.
Acknowledgements
We thank the anonymous referee for his/her careful review and insightful comments. We thank Eduardo Ros for reading the paper and providing suggestions that improve the readability of the paper. S.A.D. acknowledges the M2FINDERS project from the European Research Council (ERC) under the European Union’s Horizon 2020 research and innovation programme (grant No 101018682). L.L. acknowledges the support of UNAM-DGAPA PAPIIT grants IN108324 and IN112820 and CONACYT-CF grant 263356. J.O.-T. acknowledges a stipend from CONAHCYT, Mexico. The National Radio Astronomy Observatory is a facility of the National Science Foundation operated under cooperative agreement by Associated Universities, Inc. This work has made use of data from the European Space Agency (ESA) mission Gaia (https://www.cosmos.esa.int/gaia), processed by the Gaia Data Processing and Analysis Consortium (DPAC, https://www.cosmos.esa.int/web/gaia/dpac/consortium). Funding for the DPAC has been provided by national institutions, in particular the institutions participating in the Gaia Multilateral Agreement.
Appendix A Images of detected radio sources
We detected ten of our 31 targets. The obtained images from our VLBA observations are presented in this appendix. The plots in Figure A.1 are the intensity maps of nine detected radio sources; the remaining source is presented in the main text. The figures include the expected positions of the stars at the epochs of the VLBA observations as calculated from Gaia DR3 (Gaia Collaboration 2021, 2023).
To produce the images combining the data from both epochs, we corrected the position of the second epoch, assuming that the optical astrometric parameters could be applied to the radio observations. In AIPS, this was done with the task CLCOR using the operation code ANTC. The position correction for each target was performed by specifying the offsets in right ascension and declination in arcsecond units (clcorprm(5,6) =αoffset, δoffset). The values of these offsets are listed in Table A.1.
We assumed the upper limits for the nondetected sources to be 6.5 times the noise levels of images where the two observed epochs of each source were combined. These noise level values are also listed in Table A.1.
Offsets applied to combine data of the two observed epochs and the noise level of the obtained image.
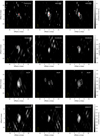 |
Fig. A.1 VLBA images of detected radio sources. The images are centered in the position of the radio source as detected in the first epoch (see Table 4). The name of the stellar source related to the radio sources is indicated in the top-left corner. The images, from left to right, correspond to the epochs 1, 2, and the combination of both epochs. Contour levels are -3, 3, 6, 9, 12, and 15 times the noise level of the image as listed in Table 3. The yellow open ellipse in the bottom-left corner represents the size of the synthesized beam of the image as listed in Table 3. The predicted optical position in epochs 1 and 2 are shown as red and cyan crosses, respectively. For HD 62237 and SAO 135659, these positions fall outside the region shown. |
Appendix B Figures comparing VLBA, VLA, and Gaia astrometric results
Figure B.1 shows the measured VLBA position of detected radio sources. In these plots, for comparison, we also show the position of the VLA radio sources detected by Launhardt et al. (2022), where we have extrapolated its position to the epoch of the VLBA observation using the results of optical astrometry. The expected optical position at the epoch of VLBA observations is also shown. Finally, in two cases, SAO 135659 and HD 199143, the relative position to the primary of a companion was obtained from the Washington Visual Double Star catalog (Mason et al. 2001, 2022) and are also shown in these plots.
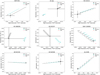 |
Fig. B.1 Positions of radio and optical sources related to our target sources. The name of source is indicated at the top of each plot. Red stars indicate the position of the radio source in the first detected epoch by the VLBA observations. The black line is the trajectory followed by the radio source detected with the VLA (Launhardt et al. 2022), assuming the derived astrometry at optical wavelengths (see Table 4) from the VLA observed epoch to the VLBA observed epoch. The black square indicates the extrapolated position of the VLA radio source at the epoch of the VLBA detection. The black cross size indicates the VLA positional error. The cyan line indicates the trajectory of the optical results from 2016.0 to the epoch of detection of the radio source with the VLBA; the position of the optical source at this epoch is indicated with the cyan square. Gaia DR3 and VLBA position errors are smaller than the symbol sizes. Companion relative positions are shown as blue squares. |
References
- Beasley, A. J., & Conway, J. E. 1995, in Very Long Baseline Interferometry and the VLBA, eds. J. A. Zensus, P. J. Diamond, & P. J. Napier, Astronomical Society of the Pacific Conference Series, 82, 327 [NASA ADS] [Google Scholar]
- Bell, C. P. M., Mamajek, E. E., & Naylor, T. 2015, MNRAS, 454, 593 [Google Scholar]
- Briggs, D. S. 1995, PhD thesis, New Mexico Institute of Mining and Technology, USA [Google Scholar]
- Carpenter, J. M., Bouwman, J., Mamajek, E. E., et al. 2009, ApJS, 181, 197 [Google Scholar]
- da Silva, L., Torres, C. A. O., de La Reza, R., et al. 2009, A&A, 508, 833 [NASA ADS] [CrossRef] [EDP Sciences] [Google Scholar]
- Desidera, S., Covino, E., Messina, S., et al. 2015, A&A, 573, A126 [NASA ADS] [CrossRef] [EDP Sciences] [Google Scholar]
- Dzib, S., Loinard, L., Mioduszewski, A. J., et al. 2010, ApJ, 718, 610 [NASA ADS] [CrossRef] [Google Scholar]
- Dzib, S. A., Forbrich, J., Reid, M. J., & Menten, K. M. 2021, ApJ, 906, 24 [NASA ADS] [CrossRef] [Google Scholar]
- Eiroa, C., Torrelles, J. M., Curiel, S., & Djupvik, A. A. 2005, AJ, 130, 643 [NASA ADS] [CrossRef] [Google Scholar]
- Elliott, P., Huélamo, N., Bouy, H., et al. 2015, A&A, 580, A88 [NASA ADS] [CrossRef] [EDP Sciences] [Google Scholar]
- Feigelson, E. D., & Montmerle, T. 1999, ARA&A, 37, 363 [Google Scholar]
- Forbrich, J., Dzib, S. A., Reid, M. J., & Menten, K. M. 2021, ApJ, 906, 23 [NASA ADS] [CrossRef] [Google Scholar]
- Gaia Collaboration (Prusti, T., et al.) 2016, A&A, 595, A1 [NASA ADS] [CrossRef] [EDP Sciences] [Google Scholar]
- Gaia Collaboration (Brown, A. G. A., et al.) 2021, A&A, 649, A1 [NASA ADS] [CrossRef] [EDP Sciences] [Google Scholar]
- Gaia Collaboration (Vallenari, A., et al.) 2023, A&A, 674, A1 [NASA ADS] [CrossRef] [EDP Sciences] [Google Scholar]
- Galicher, R., Marois, C., Macintosh, B., et al. 2016, A&A, 594, A63 [NASA ADS] [CrossRef] [EDP Sciences] [Google Scholar]
- Galli, P. A. B., Loinard, L., Bouy, H., et al. 2019, A&A, 630, A137 [NASA ADS] [CrossRef] [EDP Sciences] [Google Scholar]
- Greisen, E. W. 2003, in Information Handling in Astronomy – Historical Vistas, ed. A. Heck, Astrophysics and Space Science Library, 285, 109 [NASA ADS] [Google Scholar]
- Güdel, M. 2002, ARA&A, 40, 217 [Google Scholar]
- Hagelberg, J., Engler, N., Fontanive, C., et al. 2020, A&A, 643, A98 [EDP Sciences] [Google Scholar]
- Høg, E., Fabricius, C., Makarov, V. V., et al. 2000, A&A, 355, A27 [NASA ADS] [Google Scholar]
- Kenyon, S. J., & Hartmann, L. 1995, ApJS, 101, 117 [Google Scholar]
- Kervella, P., Arenou, F., Mignard, F., & Thévenin, F. 2019, A&A, 623, A72 [NASA ADS] [CrossRef] [EDP Sciences] [Google Scholar]
- Kervella, P., Arenou, F., & Thévenin, F. 2022, A&A, 657, A7 [NASA ADS] [CrossRef] [EDP Sciences] [Google Scholar]
- Launhardt, R., Loinard, L., Dzib, S. A., et al. 2022, ApJ, 931, 43 [NASA ADS] [CrossRef] [Google Scholar]
- Lestrade, J. F., Rogers, A. E. E., Whitney, A. R., et al. 1990, AJ, 99, 1663 [CrossRef] [Google Scholar]
- Lestrade, J. F., Preston, R. A., Jones, D. L., et al. 1999, A&A, 344, 1014 [NASA ADS] [Google Scholar]
- Lindegren, L. 2020, A&A, 633, A1 [Google Scholar]
- Lindegren, L., Hernandez, J., Bombrun, A., et al. 2018, A&A, 616, A2 [NASA ADS] [CrossRef] [EDP Sciences] [Google Scholar]
- Loinard, L., Mioduszewski, A. J., Rodriguez, L. F., et al. 2005, ApJ, 619, L179 [NASA ADS] [CrossRef] [Google Scholar]
- Loinard, L., Torres, R. M., Mioduszewski, A. J., et al. 2007, ApJ, 671, 546 [NASA ADS] [CrossRef] [Google Scholar]
- Mason, B. D., Wycoff, G. L., Hartkopf, W. I., Douglass, G. G., & Worley, C. E. 2001, AJ, 122, 3466 [Google Scholar]
- Mason, B. D., Wycoff, G. L., Hartkopf, W. I., Douglass, G. G., & Worley, C. E. 2022, VizieR Online Data Catalog: B/wds [Google Scholar]
- Montes, D., López-Santiago, J., Gálvez, M. C., et al. 2001, MNRAS, 328, 45 [NASA ADS] [CrossRef] [Google Scholar]
- Ortiz-León, G. N., Dzib, S. A., Kounkel, M. A., et al. 2017a, ApJ, 834, 143 [Google Scholar]
- Ortiz-León, G. N., Loinard, L., Kounkel, M. A., et al. 2017b, ApJ, 834, 141 [Google Scholar]
- Ortiz-León, G. N., Loinard, L., Dzib, S. A., et al. 2018, ApJ, 869, L33 [Google Scholar]
- Reid, M. J., & Brunthaler, A. 2004, ApJ, 616, 872 [Google Scholar]
- Reid, M. J., & Honma, M. 2014, ARA&A, 52, 339 [NASA ADS] [CrossRef] [Google Scholar]
- Reid, M. J., Brunthaler, A., Menten, K. M., et al. 2017, AJ, 154, 63 [NASA ADS] [CrossRef] [Google Scholar]
- Riess, A. G., Casertano, S., Yuan, W., et al. 2018, ApJ, 861, 126 [NASA ADS] [CrossRef] [Google Scholar]
- Stanford-Moore, S. A., Nielsen, E. L., De Rosa, R. J., Macintosh, B., & Czekala, I. 2020, ApJ, 898, 27 [NASA ADS] [CrossRef] [Google Scholar]
- Thompson, A. R., Moran, J. M., & Swenson, G. W., J. 2017, Interferometry and Synthesis in Radio Astronomy, 3rd edn (Springer) [CrossRef] [Google Scholar]
- van Leeuwen, F. 2007, A&A, 474, 653 [CrossRef] [EDP Sciences] [Google Scholar]
- Weise, P., Launhardt, R., Setiawan, J., & Henning, T. 2010, A&A, 517, A88 [NASA ADS] [CrossRef] [EDP Sciences] [Google Scholar]
- Xu, S., Zhang, B., Reid, M. J., Zheng, X., & Wang, G. 2019, ApJ, 875, 114 [NASA ADS] [CrossRef] [Google Scholar]
- Zinn, J. C., Pinsonneault, M. H., Huber, D., & Stello, D. 2019, ApJ, 878, 136 [Google Scholar]
- Zombeck, M. V. 1990, Handbook of Space Astronomy and Astrophysics (Cambridge: University Press) [Google Scholar]
- Zúñiga-Fernández, S., Bayo, A., Elliott, P., et al. 2021, A&A, 645, A30 [NASA ADS] [CrossRef] [EDP Sciences] [Google Scholar]
The robust scheme weights the visibilities considering the length of the baselines. A natural weighting scheme can be set with Robust=5 in AIPS and gives more weight to the interferometer’s shortest baselines. A uniform scheme weights all the baselines equally and is set with Robust=−5 in AIPS. The first scheme resulted in images with better sensitivity, and the second scheme resulted in the smallest synthesized beam but with higher noise.
For completeness, we searched the WDS catalog for companions to all of our targets, not just for HD 62237, SAO 135659, and HD 199143.
All Tables
Offsets applied to combine data of the two observed epochs and the noise level of the obtained image.
All Figures
|
Fig. 1 VLBA images of the radio source related to V 875 Per. The images are centered in the position of the radio source as detected in the first epoch (see Table 4). Images, from left to right, correspond to epochs 1, 2, and the combination of both epochs. Contour levels are −3, 3, 6, 9, 12, and 15 times the noise level of the image as listed in Table 3. The yellow open ellipse in the bottom−left corner represents the size of the synthesized beam of the image as listed in Table 3. The predicted optical position in epochs 1 and 2 are shown as red and cyan crosses, respectively. |
| In the text | |
|
Fig. 2 Positions of the radio and optical sources related to HD 199143. The red star indicates the position of the radio source in the first detected epoch by the VLBA observations. The Cyan dashed line indicates the optical trajectory of the primary component of the HD 199143 stellar system from 2016.0 to the epoch of detection of the radio source with the VLBA. The optical position of the star at the VLBA observed epoch is indicated with the cyan square. The blue square indicates the position of the secondary, HD 199143 B, whose absolute coordinates are unknown. Coordinates relative to the primary from the WDS catalog were used to estimate the absolute position. Gaia DR3 and VLBA position errors are smaller than the symbol sizes. The black line is the trajectory followed by the radio source detected with the VLA (Launhardt et al. 2022), assuming the derived astrometry at optical wavelengths from the VLA observed epoch to the VLBA observed epoch. The black square indicates the extrapolated position of the VLA radio source at the epoch of the VLBA detection. The black cross size indicates the VLA positional error. |
| In the text | |
|
Fig. A.1 VLBA images of detected radio sources. The images are centered in the position of the radio source as detected in the first epoch (see Table 4). The name of the stellar source related to the radio sources is indicated in the top-left corner. The images, from left to right, correspond to the epochs 1, 2, and the combination of both epochs. Contour levels are -3, 3, 6, 9, 12, and 15 times the noise level of the image as listed in Table 3. The yellow open ellipse in the bottom-left corner represents the size of the synthesized beam of the image as listed in Table 3. The predicted optical position in epochs 1 and 2 are shown as red and cyan crosses, respectively. For HD 62237 and SAO 135659, these positions fall outside the region shown. |
| In the text | |
|
Fig. B.1 Positions of radio and optical sources related to our target sources. The name of source is indicated at the top of each plot. Red stars indicate the position of the radio source in the first detected epoch by the VLBA observations. The black line is the trajectory followed by the radio source detected with the VLA (Launhardt et al. 2022), assuming the derived astrometry at optical wavelengths (see Table 4) from the VLA observed epoch to the VLBA observed epoch. The black square indicates the extrapolated position of the VLA radio source at the epoch of the VLBA detection. The black cross size indicates the VLA positional error. The cyan line indicates the trajectory of the optical results from 2016.0 to the epoch of detection of the radio source with the VLBA; the position of the optical source at this epoch is indicated with the cyan square. Gaia DR3 and VLBA position errors are smaller than the symbol sizes. Companion relative positions are shown as blue squares. |
| In the text | |
Current usage metrics show cumulative count of Article Views (full-text article views including HTML views, PDF and ePub downloads, according to the available data) and Abstracts Views on Vision4Press platform.
Data correspond to usage on the plateform after 2015. The current usage metrics is available 48-96 hours after online publication and is updated daily on week days.
Initial download of the metrics may take a while.