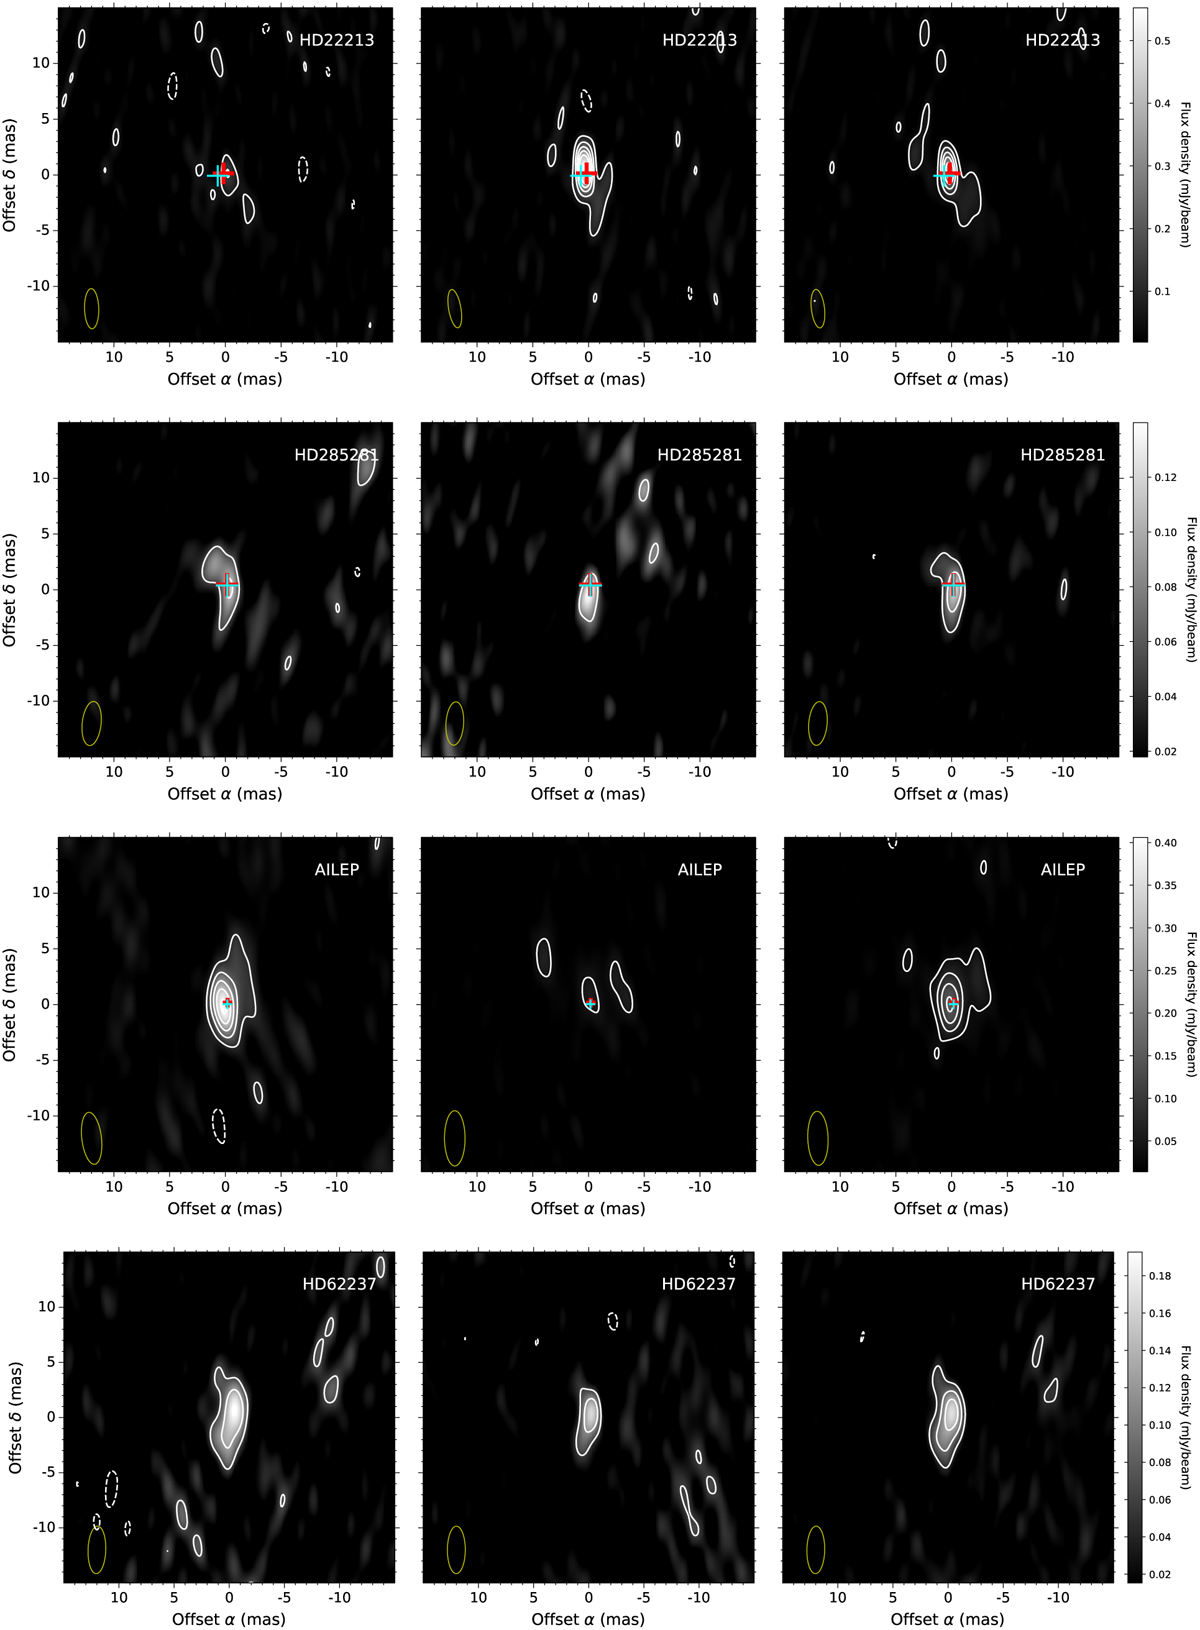
Fig. A.1
Download original image
VLBA images of detected radio sources. The images are centered in the position of the radio source as detected in the first epoch (see Table 4). The name of the stellar source related to the radio sources is indicated in the top-left corner. The images, from left to right, correspond to the epochs 1, 2, and the combination of both epochs. Contour levels are -3, 3, 6, 9, 12, and 15 times the noise level of the image as listed in Table 3. The yellow open ellipse in the bottom-left corner represents the size of the synthesized beam of the image as listed in Table 3. The predicted optical position in epochs 1 and 2 are shown as red and cyan crosses, respectively. For HD 62237 and SAO 135659, these positions fall outside the region shown.
Current usage metrics show cumulative count of Article Views (full-text article views including HTML views, PDF and ePub downloads, according to the available data) and Abstracts Views on Vision4Press platform.
Data correspond to usage on the plateform after 2015. The current usage metrics is available 48-96 hours after online publication and is updated daily on week days.
Initial download of the metrics may take a while.