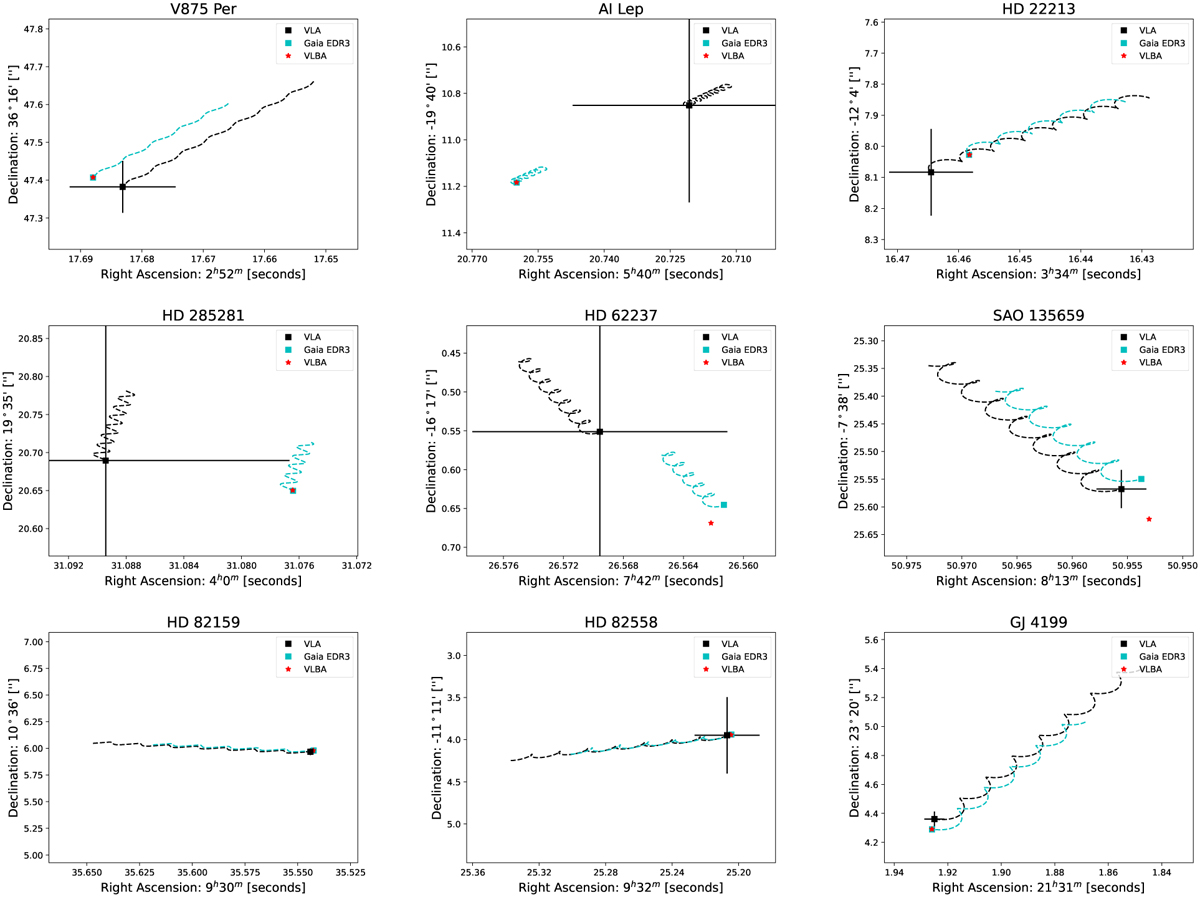
Fig. B.1
Download original image
Positions of radio and optical sources related to our target sources. The name of source is indicated at the top of each plot. Red stars indicate the position of the radio source in the first detected epoch by the VLBA observations. The black line is the trajectory followed by the radio source detected with the VLA (Launhardt et al. 2022), assuming the derived astrometry at optical wavelengths (see Table 4) from the VLA observed epoch to the VLBA observed epoch. The black square indicates the extrapolated position of the VLA radio source at the epoch of the VLBA detection. The black cross size indicates the VLA positional error. The cyan line indicates the trajectory of the optical results from 2016.0 to the epoch of detection of the radio source with the VLBA; the position of the optical source at this epoch is indicated with the cyan square. Gaia DR3 and VLBA position errors are smaller than the symbol sizes. Companion relative positions are shown as blue squares.
Current usage metrics show cumulative count of Article Views (full-text article views including HTML views, PDF and ePub downloads, according to the available data) and Abstracts Views on Vision4Press platform.
Data correspond to usage on the plateform after 2015. The current usage metrics is available 48-96 hours after online publication and is updated daily on week days.
Initial download of the metrics may take a while.