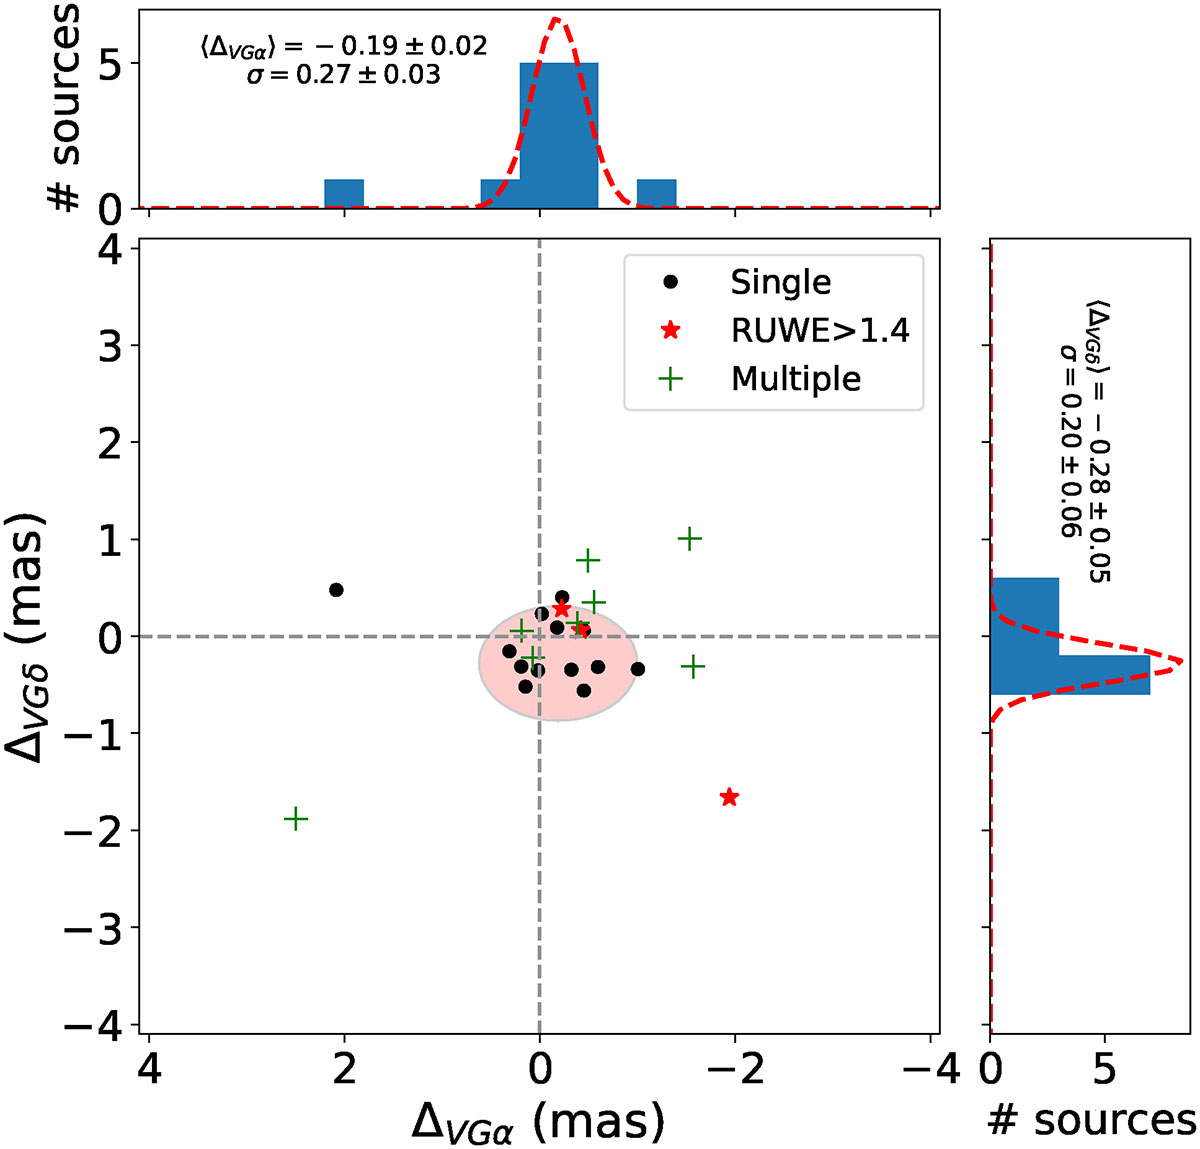
Fig. 4.
Download original image
Distribution of the differences between Gaia and VLBA positions. The central panel shows the offsets in right ascension and declination for three categories of sources: single stars (black circles), sources with RUWE > 1.4 (red stars), and sources identified as multiple systems (green crosses). The red ellipse represents a 3σ contour derived from a 2D Gaussian fit to the single-star and RUWE ≤1.4 distributions. The top and right panels display the corresponding histograms of offsets in right ascension and declination, respectively, for single stars, and RUWE ≤1.4. Dashed red lines show the best-fit Gaussian models, with the fitted mean and standard deviation indicated in each subplot.
Current usage metrics show cumulative count of Article Views (full-text article views including HTML views, PDF and ePub downloads, according to the available data) and Abstracts Views on Vision4Press platform.
Data correspond to usage on the plateform after 2015. The current usage metrics is available 48-96 hours after online publication and is updated daily on week days.
Initial download of the metrics may take a while.