Fig. 5.
Download original image
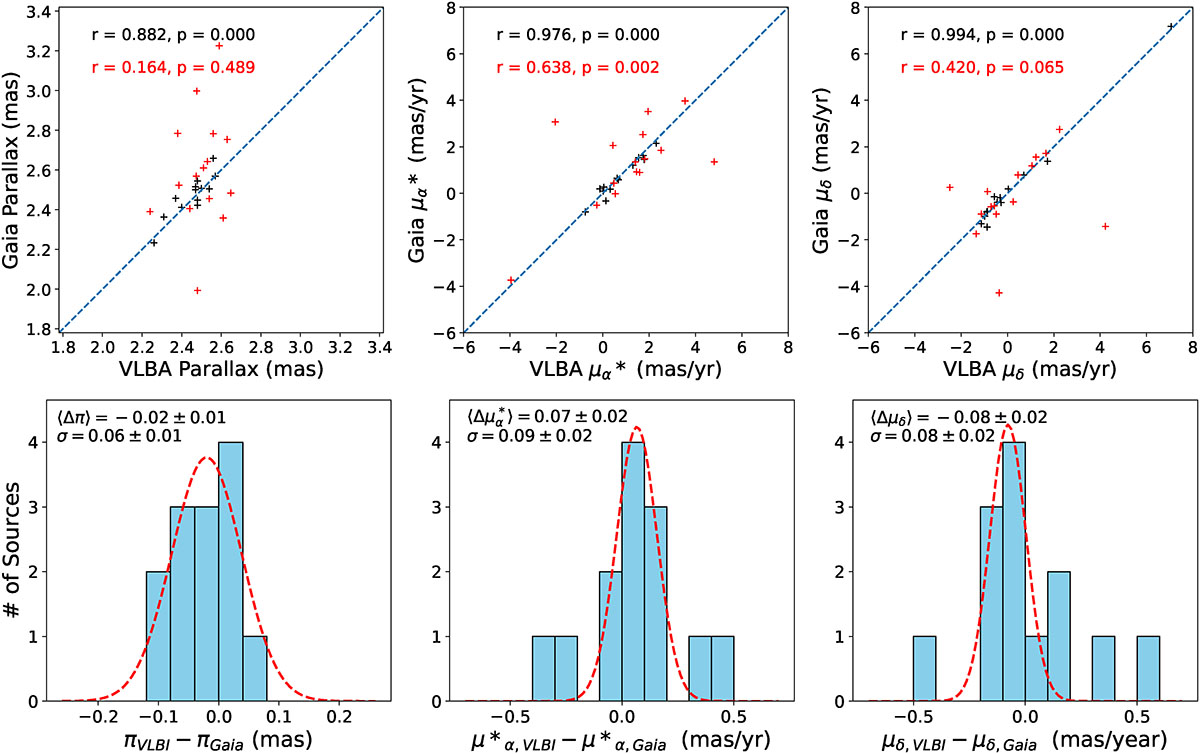
VLBA-Gaia parallax (left panel) and proper motion (μα* in the center, and μδ to the right) comparisons. Top panels: scatter plots of measured values. Red symbols indicate sources related to multiple systems, and black symbols are likely single sources. The dashed line is the equality line, which is included for eye guidance. The determined correlation coefficient (r) and its statistical significance are included in each case. Lower panels: histograms showing the differences between VLBI and Gaia EDR3 astrometric parameters for matched likely single sources.
Current usage metrics show cumulative count of Article Views (full-text article views including HTML views, PDF and ePub downloads, according to the available data) and Abstracts Views on Vision4Press platform.
Data correspond to usage on the plateform after 2015. The current usage metrics is available 48-96 hours after online publication and is updated daily on week days.
Initial download of the metrics may take a while.