| Issue |
A&A
Volume 694, February 2025
|
|
|---|---|---|
| Article Number | A27 | |
| Number of page(s) | 12 | |
| Section | Interstellar and circumstellar matter | |
| DOI | https://doi.org/10.1051/0004-6361/202452625 | |
| Published online | 30 January 2025 | |
Hunting pre-stellar cores with APEX IRAS16293E (Oph464)
1
Max-Planck-Institut für Extraterrestrische Physik,
Giessenbachstrasse 1,
85748
Garching,
Germany
2
European Southern Observatory,
Karl-Schwarzschild-Strasse 2,
85748
Garching,
Germany
3
Department of Physics,
PO Box 64,
00014
University of Helsinki,
Finland
4
Univ. Rennes, CNRS, IPR (Institut de Physique de Rennes) – UMR 6251,
35000
Rennes,
France
5
National Astronomical Observatory of Japan,
Osawa 2-21-1,
Mitaka, Tokyo
181-8588,
Japan
6
Max-Planck-Institut für Radioastronomie,
Auf dem Hügel 69,
53121
Bonn,
Germany
★ Corresponding author; spezzano@mpe.mpg.de
Received:
15
October
2024
Accepted:
16
December
2024
Context. Pre-stellar cores are the first steps in the process of star and planet formation. However, the dynamical and chemical evolution of pre-stellar cores is still not well understood. Our partial knowledge of the chemical and physical structure of pre-stellar cores, as well as how they are fed and influenced by the surrounding environment, limits the level of knowledge that we can achieve at later stages in the star and planet formation process, from protostellar cores to exoplanets.
Aims. Our aims are to estimate the central density of the pre-stellar core IRAS16293E and to carry out an inventory of molecular species towards the density peak of the core.
Methods. We observed high-J rotational transitions of N2H+ and N2D+, and several other molecular lines towards the dust emission peak using the Atacama Pathfinder EXperiment (APEX) telescope, and derived the density and temperature profiles of the core using far-infrared surface brightness maps from Herschel. The N2H+ and N2D+ lines were analysed by non-local thermodynamic equilibrium (non-LTE) radiative transfer modelling.
Results. Our best-fit core model consists of a static inner region, embedded in an infalling envelope with an inner radius of approximately 3000 au (21″ at 141 pc). The observed high-J lines of N2H+ and N2D+ (with critical densities greater than 106 cm−3) turn out to be very sensitive to depletion; the present single-dish observations are best explained with no depletion of N2H+ and N2D+ in the inner core. The N2D+/N2H+ ratio that best reproduces our observations is 0.44, one of the highest observed to date in pre-stellar cores. Additionally, half of the molecules that we observed are deuterated isotopologues, confirming the high level of deuteration towards this source.
Conclusions. Non-LTE radiative transfer modelling of N2H+ and N2D+ lines proved to be an excellent diagnostic of the chemical structure (i.e. molecular freeze-out) and dynamics (infall velocity profile) of a pre-stellar core. Probing the physical conditions immediately before the protostellar collapse is a necessary reference for theoretical studies and simulations with the aim of understanding the earliest stages of star and planet formation and the timescale of this process.
Key words: ISM: clouds / ISM: lines and bands / ISM: molecules
© The Authors 2025
 Open Access article, published by EDP Sciences, under the terms of the Creative Commons Attribution License (https://creativecommons.org/licenses/by/4.0), which permits unrestricted use, distribution, and reproduction in any medium, provided the original work is properly cited.
This article is published in open access under the Subscribe to Open model.
Open Access funding provided by Max Planck Society.
1 Introduction
Molecular emission is of paramount importance when we try to understand the process of star formation. The wealth of information contained in molecular spectra from star-forming regions encompasses the physical processes driving the phenomena and the chemical budget available for the forming planets. Pre-stellar cores are gravitationally bound objects on the verge of forming a protostar. They represent the initial conditions in stars and planets formation (e.g. Crapsi et al. 2007). Most of the ingredients that build up a planet are already present at this stage, from the organic molecules that form pre-biotic material to the solids that form the refractory part of the planet (Caselli & Ceccarelli 2012). Despite their importance, the dynamical and chemical evolution of pre-stellar cores is still not well understood. Our partial knowledge of the chemical and physical structure of pre-stellar cores, and how they are fed and influenced by the surrounding environment, limits the level of knowledge that we can achieve at later stages in the star and planet formation process, from protostellar cores to exoplanets.
This paper is part of a systematic effort aiming to provide a representative sample of dynamically evolved cores that can also be used as targets for higher-resolution studies of the inner core structure, dynamics, and chemistry. The whole sample is presented in Caselli et al. (in prep.). We performed a survey of nearby pre-stellar cores with the Atacama Pathfinder EXperiment (APEX) telescope in the rotational lines of N2H+ and N2D+ around 300 GHz and 460 GHz. The pre-stellar cores targeted in this survey represent the densest starless cores within 200 pc of the Sun identified in the Herschel Gould Belt Survey (HGBS, >Andre et al. 2010). Through these observations, we want to confirm the high central density derived from Herschel data, and to use the N2 D+ /N2H+ ratio to estimate their evolutionary stage. With this sample we are probing the physical conditions immediately before the protostellar birth, necessary to guide theoretical studies and simulations with the overall aim of understanding the earliest stages of star and planet formation and the timescale of this process. For chemical reasons, N2H+ and N2D+ are indicators of an advanced evolutionary stage of a dense core. These molecules form relatively slowly in dense gas from molecular nitrogen, N2 , and benefit from the depletion of CO. They too deplete in the dense kernel, but the effect is not as severe as for CO and other molecules. Deuterium fractionation is enhanced when CO disappears from the gas phase (Roberts et al. 2003). As shown by Crapsi et al. (2005), a high N2D+/N2H+ abundance ratio (≥ 0.1) is a clear signature of a centrally concentrated core with a very high degree of CO depletion.
This paper focuses on the pre-stellar core IRAS 16293E (hereafter I16293E), located within the L1689N molecular cloud in the Rho Ophiuchi cloud complex at a distance of ~141 pc (Dzib et al. 2018). I16293E shows some of the highest deuteration levels in the interstellar medium; several multiply deuterated molecules have been observed there, including triply deuterated ammonia, ND3 (Lis et al. 2016). The environment where I16293E is embedded is quite active. The low-mass protostellar system IRAS16923-2422 A and B is located just 90″ (12700 au) to the west of the pre-stellar core (Stark et al. 2004). Furthermore, there is observational evidence that the large-scale outflows that are driven by the protostellar system have interacted with the pre-stellar core. The area around (and including) I16293E has been extensively studied with both interferometer and single-dish facilities (e.g. Lis et al. 2016 and Kahle et al. 2023, and references therein), showing a pattern of velocity that can be explained by the interaction between the pre-stellar core and the molecular outflow emanating from the nearby solartype protostars. Through Herschel observations of water and singly deuterated ammonia, Lis et al. (2016) showed that the outflow wraps around and largely avoids the pre-stellar core. These authors suggest that the shock associated with the outflow has already propagated through the north-eastern part of the core and what can be observed is quiescent, cold, shock- compressed, dense gas, that is blue-shifted with respect to the systemic velocity of the cloud. The broader line profiles in the western–south-western part of the core suggest instead an ongoing interaction with the outflow towards the south.
For this paper, we used a non-local thermodynamic equilibrium (non-LTE) radiative transfer code to model several rotational lines of N2H+ and N2D+, exhibiting critical densities up to 5× 106 cm−3, thus probing the dense central part of the pre-stellar core. Additionally, we investigated the rich chemistry towards I16293E by comparing the line shapes and velocity components in several molecular emission lines of about 20 different species.
This paper is structured as follows. In Sect. 2 we present the observations; the non-LTE modelling of the N2H+ and N2D+ lines is described in Sect. 3. The line emission observed in several molecules is presented in Sect. 4. We discuss the results in Sect. 5, and summarise our conclusions in Sect. 6.
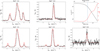 |
Fig. 1 APEX observations of several transitions of N2H+ and N2D+ towards the dust peak of the pre-stellar core I16293E (black histograms) and results of the LOC non-LTE radiative transfer model (red curve). The physical model of I16293E computed from Herschel SPIRE and PACS data is shown in the upper right panel. The black curve (left y-axis) shows the total volume density |

2 Observations
2.1 APEX
The spectra observed with APEX towards the dust emission peak of I16293E are shown in Figures 1 and 2. The molecular emission data presented in this work were collected with the APEX telescope as part of the large core sample described in Caselli et al. (in prep.). Two tunings of the SEPIA345 receiver were used to cover the N2H+ 3–2 and N2D+ 4–3 transitions at 279.5 GHz and 308.4 GHz, respectively. These observations were performed in July and October 2022 (Proposal ID: O-0110.F-9310A-2022). The N2D+ 3–2 line was covered with the nFLASH230 receiver, whilst the N2D+ 6–5 and N2H+ 5–4 transitions were covered simultaneously with one tuning of nFLASH460. These observations, collected under project M-0110.F-9501C-2022, were performed in September and November 2022.
All observations were performed in ON-OFF position switching (with the OFF position being +212″ in RA and Dec) towards the core central position (RA(J2000) = 16h32m29s.07 and Dec(J2000) = −24°29′09″.0), consistent with the continuum peak emission at 970 µm observed with the ALMA compact array (Lis et al. 2016). We used the FFTS backend with a spectral resolution of 64 kHz. This translates into velocity resolution from ∆Vch ~ 0.08 km s−1 at 230 GHz to ~0.04 km s−1 at 460 GHz. The calibration accuracy for the APEX observations is ~10%.
We reduced the data using the CLASS package of the GILDAS software, and subtracted the baseline using a first-order polynomial. The intensity scale was converted into main beam temperature TMB assuming the forward efficiency Feff = 0.95 and computing the main-beam efficiency at each frequency according to ηMB = 1.00797 − 0.000857 * v(GHz)1.
The spectra in Figures 1 and 2 show the presence of a very rich chemistry as well as a very complex physical structure. In particular, we can see different velocity components in all bright lines, with the exception of the spectra of N2H+ and N2D+ likely because they only trace the pre-stellar core. The relevant information on the targeted transitions of N2H+ and N2D+ is given in Table 1.
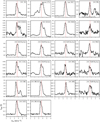 |
Fig. 2 Molecular lines observed towards the dust peak of I16293E with APEX. The vertical red dotted line shows the vLSR of the core, 3.7 km s−1. Given the complexity of the environment around I16293E, the rest velocity slightly changes depending on the molecule, as already pointed out in Lis et al. (2016) and Kahle et al. (2023). Both lines present in the panel of fully deuterated ammonia (ND3), top right corner, are hyperfine components of the same rotational transition of ND3 . The stick spectrum at the bottom of the panel of ND3 shows the hyperfine structure of the transition. Their spectroscopic parameters are reported in Table 2. |
Parameters of the targeted N2H+ and N2D+ lines.
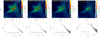 |
Fig. 3 Far-infrared maps and averaged intensity profiles of I16293E. Top: Herschel SPIRE HiRes and PACS surface brightness maps at 500 µm, 350 µm, 250 µm, and 160 µm. The latter three are smoothed to the SPIRE HiRes resolution 15″. The hatched areas are masked out in the calculation of intensity profiles to avoid a contribution from IRAS16293-2422. Bottom: circularly averaged surface brightness profiles. The error bars show standard deviations within annular regions. The solid curves show Plummer-type functions fitted to the averages. |
2.2 Herschel
The top row of Fig. 3 shows the thermal dust emission maps of the core at four Herschel wavelengths. The bottom row shows the circularly averaged intensity profiles as a function of the impact parameter. The calibration accuracy for SPIRE and PACS has been estimated to be ~15% (Ladjelate et al. 2020). To perform the non-LTE radiative transfer analysis, we computed a spherically symmetric model of the core based on these intensity profiles. The radial density and dust temperature profiles, ρ(r) and Td(r), of the core model were determined using the method described in Roy et al. (2014). According to Eq. (3) of Roy et al. (2014), the product ρ(r) Bλ(Td) κλ, where Bλ is the Planck function at wavelength λ and κλ is the dust opacity at this wavelength, can be obtained from the inverse Abel transformation of the surface brightness gradient dIλ/dr as a function of the impact parameter. The density and temperature profiles were fitted by determining the surface brightness gradient at four wavelengths. For the dust opacity, we assumed κ250µm = 0.1 cm2 g−1 and a dust opacity index of β = 2.0 (Hildebrand 1983). We used deconvolved Herschel/SPIRE HiRes images at λ = 250 µm, 350 µm, and 500 µm (1.2, 0.86, and 0.60 THz, respectively), and the Herschel/PACS image of the region at 160 µm (1.9 THz). The SPIRE HiRes images at 500 µm have a resolution of approximately 15″2. The images at shorter wavelengths were convolved to this resolution. The surface brightness profiles were determined by fitting Plummer-type functions to the concentric circular averages. The purpose of the fitting was to provide a smooth intensity gradient dIλ/dr. Figure 3 shows the surface brightness maps of a 10′ × 10′ region around I16293E. The starforming core IRAS 16293-2422 is masked out in the images, and this region was not used in the calculation of the intensity profiles. The error bars in the bottom panel represent the standard deviations of the averages, and the solid curves show Plummer- type fits to the average values. The resulting volume density and dust temperature distributions are shown in the top right panel of Fig. 1. The logarithmic fits of the temperature and density profiles beyond the apparent flat radius at 3000 au (21″) until 50 000 au (350″) are T ~ r0.12 and n ~ r−2·45. The dust temperature ranges from 10.5 to 15 K, slightly warmer compared to typical pre-stellar cores, where the temperatures range from ~6 to ~13 K. The volume density values go from a few times 103 cm−3 in the outer regions to a few times 106 cm−3 towards the centre.
3 Non-LTE modelling of N2H+ and N2D+
We used the radiative transfer code LOC (Juvela 2020) to prediet the observed N2H+ and N2D+ lines taking into account the overlap of the hyperfine components. As physical models of the source, we used the ρ(r) and T (r) profiles derived from Herschel data, as described in Section 2.2. We assume Tɡas = Tdust (Sokolov et al. 2017), where Tdust is derived from the modelling of the Herschel data shown in Figure 3. The output spectral cube is convolved with the corresponding observational beam and compared to the observed spectrum. To model our observations we used the hyperfine-resolved collisional coefficients taken from the EMAA catalogue3 . The collisional coefficients of N2H+ were computed by Lique et al. (2015), and those of N2D+ by Lin et al. (2020). We tested different abundance profiles for N2H+ and N2D+, and different distributions of the radial velocity and velocity dispersion.
Simulated spectra from the best-fit model are shown in red in Figure 1. Here, the turbulent velocity dispersion is set to σturb = 0.195 km s−1, and the radial velocity profile is a step function where the velocity is set to zero in the inner 3000 au (21″) and −0.5 km s−1 at larger radii (i.e. a static inner core surrounded by infalling envelope). The abundance profiles are also step functions with values of 4.5×10⁻¹⁰ for N2H+ and 2×10⁻¹⁰ for N2D+ in the inner 3000 au (21″) and a drop of 70% of the central values at radii larger than 3000 au.
Velocity profile. To reproduce the asymmetric line profile of the N2H+ 3−2 line, it is necessary to use a velocity radial profile with a velocity of −0.5 km s−1 at radii larger than 3000 au (21″) and equal to zero in the central part of the core. These values were determined by testing a range of typical values for similar objects. A negative velocity means that the gas is moving towards the centre of the core. Such infalling motions are responsible for red-shifted absorption. While it is possible to reproduce well the high-J transitions with a static core (i.e. v=0 in the whole core), the asymmetry in the N2H+ 3−2 central hyperfine transition can only be reproduced with an infall velocity profile. The results of our test with a static core are shown as a green curve in Figure A.1. We also tried to invert the step function of our bestmodel velocity profile, assuming our core to have an infalling central region and a static envelope. In this case the velocity was set to −0.5 km s−1 in the central part of the core and equal to zero at radii larger than 3000 au (21″). The results of this test are shown as a blue curve in Figure A.1. In this case, neither the low- J nor the high-J transitions are well reproduced. In particular, the high- J transitions of both N2H+ and N2D+ appear to have separated velocity components because of the infall velocity, which is not the case for the observed spectra.
A radius of 3000 au (21″) for the static core proves to be a good value to reproduce the APEX observations. When decreasing the radius to 1000 au (7″), the intensity of the high-J transitions decreases significantly as the lines become broader because of the effect of the infall. If we instead increase the radius of the static core to 4000 au (28″), the asymmetry in the N2H+ 3−2 line decreases and disappears with the further increase in this value. We note that a step function is obviously a very crude description of the velocity profile of I16293E. Nevertheless, our results show how powerful multi-line non-LTE modelling of N2H+ and N2D+ is when constraining the physical and dynamical structure of a pre-stellar core.
Abundance profile. Our N2H+ and N2D+ observations can be well reproduced using a step-function abundance profile with a drop of 70% at radii larger than 3000 au (21″). The central abundances that best reproduce our observations are 4.5×10⁻¹⁰ and 2×10⁻¹⁰ for N2H+ and N2D+, respectively, one of the highest D/H ratios in N2H+ observed to date (0.44). The central regions of the pre-stellar cores are characterised by very high densities (of the order of a few 106 cm−3) and very low temperatures (down to ~6 K). One of the consequences of such low temperatures and high densities is the freeze-out of molecules on top of the icy mantles of dust grains in the central regions of the cores, and hence a depletion of molecules from the gas phase. Recent ALMA observations of deuterated ammonia in the low-mass pre-stellar core L1544 in the Taurus molecular cloud showed an almost complete freeze-out in the inner 1800 au of the core, where ≥99% of the gas is frozen on the dust grains (Caselli et al. 2022; Pineda et al. 2022). To examine whether the same effect is observable in I16293E, we ran models with an abundance drop in the central part of the core. It turned out that such a drop would dramatically weaken the high-J lines of N2H+ and N2D+, and that models with a constant abundance in the core nucleus reproduce best the observations. Scaling up the fractional abundances, but keeping the centrally decreasing profiles would not help, because the high-J lines would still be too weak and the low-J lines would become optically thick. The results of our tests using different depletion radii are reported in the Appendix. A complete depletion in the inner 2000 au (14″) of the core significantly affects the high-J lines of both molecules (see the blue curve in Figure A.2). The high-J lines are much better reproduced if we consider a complete depletion in the inner 1000 au (7″) of the core (green curve in Figure A.2). The spatial resolution of the present observations is approximately 2000 au (14″), meaning that observations with higher angular resolution are necessary to make a conclusive statement about the freeze- out of N2H+ and N2D+ in the centre of I16293E. We note that the weaker hyperfine components of the 3−2 and 4−3 lines of N2D+ are overestimated by our best model shown in Figure 1. While scaling up the volume density profile and simultaneously decreasing the molecular abundance would help in this regard, we prefer to keep the physical structure of the core derived from the Herschel data fixed. Daniel et al. (2016) derived an abundance profile for N2H+ by modelling the maps of the 1-0 and 3−2 transitions. The abundance they derive at radii larger than 15″ (~2000 au) is 3−4×10⁻¹⁰, and it agrees quite well with the abundance derived in this work (3−4.5×10⁻¹⁰). Lis et al. (2002) showed that the emission of some simple hydrogenated and deuterated molecules in L1689N (the cloud where I16293E is embedded) comes from distinct physical regions. Bacmann et al. (2016) showed that the ND emission and the NH absorption in I16293E originate from different layers in the cloud. However, the authors point out that this might only be a consequence of the difference in excitation for the two species and that the molecules are both present in the inner dense region of the core, while only NH is present in the outer region. Our work here confirms this, as the emission of N2H+ and N2D+ is very well modelled assuming that the two molecules are co-spatial. As dissociative recombination of N2H+ and N2D+ with electrons is the main pathway to form NH and ND (Roueff et al. 2015), we can safely assume that NH and ND will also be present in the same gas in I16293E in the inner dense region of the core. This is also confirmed by the abundance profiles from the chemical model described in Sipilä et al. (2019), computed at 1×10⁵ yr, as shown in Figure A.4.
As discussed for the velocity profile, using a step function for the abundance profile is also a crude approximation of the true distribution of N2H+ and N2D+ across I16293E. Thus, we have also used a different approach and coupled the physical structure of I16293E derived from the Herschel observations (cf. Section 2) with the chemical model presented in Sipilä et al. (2019). The results of the LOC modelling using the abundance profiles from the chemical models are not satisfactory and in particular cannot reproduce the high-J lines of either N2H+ or N2D+ (see Figure A.3). The models in fact predict a severe depletion towards the inner part of the core starting already at radii larger than 5000 au (45″). Because the high-J transitions have high critical densities, the depletion in the central part of the core has a severe effect on the amount of gas that is traced by the N2H+ 5−4 and N2D+ 6−5 lines. The results of the modelling using the abundance profiles computed at 1×10⁵ yr are shown in Figure A.3 in blue. The abundance profiles extracted at later times are more affected by the depletion in the central part of the core, and consequently reproduce the observed high-J lines even less accurately. To decrease the effect of the depletion in the inner part of the core, we tested the effects of a different prescription for the cosmic-ray ionisation rate (ζ), described in Padovani et al. (2018). A higher ζ could be justified by the proximity to an active site of star formation, as energetic particles can be accelerated along the outflows driven by young stellar objects (Padovani et al. 2016). Additionally, a higher ζ is expected to keep more N2 in the gas phase in the central part of the core. We used two models with a radial dependence of ζ, one with the high model (ℋ) and one with the low model (ℒ) from Padovani et al. (2018), as done in Redaelli et al. (2021) to model the emission of N2H+ in the pre-stellar core L1544. The results of the modelling using these abundances are shown in Figure A.3, in green (ℋ) and red (ℒ). These models did not translate into a big improvement when reproducing the high-J lines because the depletion is still significant at radii larger than 3000 au. Additionally, these models predict N2H+ and N2D+ to be abundant in the outer parts of the core, resulting in overly bright (and broad) low-J lines of these molecules. Further studies on the effect of an enhanced cosmic-ray ionisation rate on the abundance of N2H+ and N2D+ are necessary to assess the effect of the environment on the depletion radius of these two molecules. More details on our tests with the chemical models are presented in the Appendix.
Spectroscopic parameters of the observed lines.
4 Molecular emission towards the dust peak of I16293E
While the main objective of the present observations was to use N2H+ and N2D+ lines to confirm the high central density of the core, the large bandwidths of the APEX receivers allowed us to simultaneously detect several additional molecular lines. They are listed in Table 2, and are shown in Figure 2. The results of the Gaussian fits (performed with the CLASS software) on all observed lines are also presented in Table 2. We observed simple species, such as diatomics and triatomics (C17O, CS, CN, SO, HDO, HDS, DCO+, HNC, and DNC), as well as larger molecules (H2CO, HDCO, D2CO, CH3OH, c-C3H2, NH2D, and ND3). Among the species that we observed, deuterated molecules are strikingly dominant. Half of the molecules reported in Table 2 are in fact deuterated, and we also observe relatively bright lines of a triply deuterated species, ND3.
Some of the lines shown in Figure 2 have single-Gaussian profiles and do not show hints of multiple velocity components. This is the case for HDO, HDS, NH2D, and ND3. Other lines instead show multiple velocity components. The brightest methanol and CS lines have a quite broad (~1.5 km s−1) velocity component blue-shifted from the vLS R, between 0.5 and 2 km s−1. The lines of CS, CN, c-C3H2, and D2CO instead have an additional component that is red-shifted with respect to the core vLS R, at ~4.5 km s−1. The blue-shifted and red-shifted velocity components are both shown in Figure 4. In order to understand where these velocity components might originate from, it is necessary to inspect the crowded area surrounding the pre-stellar core. Maps of over 30 molecules in the area around I16293E have recently been reported by Kahle et al. (2023), with an exhaustive study of the large-scale molecular emission in the pre-stellar core, the envelope surrounding the IRAS 16293-2422 A and B protostars, and the shocked dense gas in the area. The CO J=6−5 emission map shown in Figure 2 of Kahle et al. (2023) is dominated by the presence of two outflows that originate from the IRAS 16293-2422 A and B protostars and that interact with the pre-stellar core. In particular, the blue side of the east−west outflow broadens around the I16293E pre-stellar core, appearing to wrap around the dense core structure. The red side of the north-east−south-west outflow instead contributes to two emission peaks of shocked dense gas in the north of I16293E, E1 and E2. Given their velocity and vicinity to the core, we suggest that the red- and blue-shifted components observed in some of the emission lines towards the dust peak of I16293E trace gas from outflows that generated the E1 and HE2 emission peaks. This gas is not part of the pre-stellar core, but it is in the line of sight.
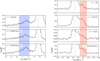 |
Fig. 4 Zoomed-in image of the blue-shifted and red-shifted velocity components present in some of the observed lines. The vertical red dotted line shows the vLS R of the core, 3.7 km s−1. |
5 Discussion: A dense pre-stellar core in an active environment
The non-LTE radiative transfer modelling of the N2H+ and N2D+ lines showed how sensitive these lines are to small changes in the velocity and abundance profiles, and have proved to be excellent diagnostics for the gas they trace. To reproduce the asymmetries observed in the low-J transitions, the gas needed to be infalling. The best velocity profile to reproduce all the observed lines of N2H+ and N2D+ is a static core in the inner 3000 au (21″) surrounded by an infalling gas layer. The velocity difference between the inner static core and the envelope in our model (0.5 km s−1) is consistent with the ND and NH observations in Bacmann et al. (2016), where NH absorption is red-shifted with respect to ND emission by ~0.4 km s−1.
The N2H+ and N2D+ lines proved to be very sensitive to depletion, in particular the high-J transitions. As discussed in Section 3, an abundance profile with no depletion in the centre reproduces our observations best. We also get good results with a depletion radius of 1000 au (7″), which is however a spatial scale that we cannot resolve with our Herschel observations, and hence in the physical structure that we use for the modelling. Our results using a depletion radius of 1000 au (7″) are in agreement with the very low abundance of N2D+ reported in Lis et al. (2016) with ALMA observations within a 1300 au (9″) beam. Testing the abundance profiles predicted by chemical models using the physical structure of I16293E gave us interesting insights into how to further develop the chemical models. The chemical model that we used (Sipilä et al. 2019) predicts too much depletion, and consequently cannot reproduce the high-J lines of N2H+ and N2D+. We also used two models with a radial dependence of the cosmic-ray ionisation rate, following the work of Padovani et al. (2018), and the one with the high cosmic-ray ionisation rate (H) does a good job reproducing the high-J lines, but not the low-J lines. A higher cosmic-ray ionisation rate keeps more molecular nitrogen, N2, in the gas phase in the central part of the core, but it also predicts high abundances of N2H+ and N2D+ in the outer parts of the core (see Figure A.4). The presence of a considerable amount of N2H+ and N2D+ in the outer gas layers, where the gas temperature is 13–15 K, translates into an additional broader line component in the N2H+ and N2D+ 3-2 lines (quite noticeable in the green and red curves in the left panels in Figure A.3), which is not consistent with the observed spectra.
To better reproduce the observed lines in a pre-stellar core such as I16293E, we plan to include the effects of the shock in the chemical models. A realistic model of I16293E should also combine chemistry with the dynamic evolution of the core. In particular, I16293E has likely evolved quickly into its present high-density state (e.g. due to shock compression), which is not captured by the present model, and hence the depletion is overestimated.
The N2D+/N2H+ ratio that best reproduces our observations is 0.44, one of the highest observed to date in pre-stellar cores. Using the LTE approach, Kahle et al. (2023) derived a ratio of ~10% (Table F.2 in their paper). The large discrepancy between the two values strongly suggests that non-LTE effects have quite an impact on these spectra. I16293E is well known to have some of the largest deuteration fractions among pre-stellar cores (Lis et al. 2016). How much of the observed deuteration is a consequence of the environment where the core is embedded still needs to be explored in a quantitative manner. It is important to note that half of the molecules that we observed in our spectra are deuterated isotopologues, confirming the high level of overall deuteration towards this source. A quantitative study of the deuteration of different classes of molecules will be relevant, but it is beyond the scope of this paper. Our results on N2H+ show that the complex morphology of the source warrants synergetic approaches that include observations, radiative transfer modelling, and chemical modelling, when possible. The presence of line components that are red-shifted and/or blue-shifted from the rest velocity of the core is a consequence of the complex morphology of the source as discussed in Section 4. We note that the N2D+ and N2H+ lines are the only bright lines in our sample that show no additional velocity components, thus proving to be excellent tracers of the dense core, also in the case of a crowded environment similar to the one where I16293E is embedded.
In a recent paper, Pagani et al. (2024) present para-D2H+ and ortho-H2D+ maps of the IRAS16293E core. The emission of both molecular ions peak approximately 25″ north-east from the dust emission peak (our centre position). Because H2D+ and D2H+ are predicted to be most abundant in cold, dense, and heavily depleted gas, Pagani et al. suggest that the true centre of the core lies at the D2H+ peak, and that the dust emission peak, which roughly coincides with the N2H+(4 − 3) and ND3(10 − 00) emission peaks as observed with ALMA (Lis et al. 2016) indicates a hotspot resulting from compression by outflows from IRAS 16293-2422. In Fig. B.1 we show the dust colour temperature (TC) and H2 column density (N(H2)) maps of the region, derived from Herschel PACS and SPIRE/HiRes images at the wavelengths λ = 70, 100, 160, 250, 350, and 500 µm. The maps are obtained by fitting a grey-body function pixel-by-pixel to the aligned surface brightness maps smoothed to a common resolution, with the TC and N(H2) as free parameters. The TC represents the line-of-sight average of the dust temperature. Both the dust emission peak and the D2H+ peak, indicated with the diamond in the maps, are found in a valley of relatively low colour temperatures (TC < 13 K), where the H2 column densities exceed 1023 cm−2. The N(H2) at the D2H+ peak is 1.5 × 1023 cm−2, which agrees with the core model of Pagani et al. (2024). The H2 column density reaches its maximum at the centre position adopted here. This is no surprise, because the position was chosen from Herschel HiRes column density maps provided by the HGBS archive. The N(H2) and TC distributions derived from Herschel reproduce very well the 850 µm surface brightness map of the core observed with SCUBA (Pattle et al. 2015), which also peaks at our (0,0). This position probably represents a true maximum in the total column density. Usually the highest densities are found in the direction of N(H2) maxima, and here it probably also contains a local density maximum. The present line observations, in particular the strong detection of the N2H+(5−4) and N2D+(6−5) transitions confirm that the density in this position exceeds 106 cm−3, which agrees with the estimate from the Abel transformation method described in Sect. 2.2. We note that according to the 1D physical model used by Pagani et al. (2024), the volume density at the offset 25″ from the D2H+ peak is ~4 × 105 cm−3. This density would be too low to produce the observed intensities of N2H+(5−4) and N2D+(6−5) in this position. However, according to our tests, another core resembling the inner portions (r < 1017 cm) of the model of Pagani et al. (2024) (see their Fig. 4) with a central temperature of 8 K can be placed in the direction of the D2H+ peak without substantial changes in the observable 850 µm map.
6 Summary and conclusions
Several rotational transitions of N2H+ and N2D+ have been observed towards the dust peak of the pre-stellar core I16293E using APEX, namely the N2H+ 3−2 and 5−4 and the N2D+ 3−2, 4−3, and 6−5 transitions. I16293E is a dense pre-stellar core located close to the well-studied low-mass binary protostar IRAS 16293−2422. The physical structure of I16293E, constrained from Herschel continuum maps, shows very high central density (~3×106 cm−3) and temperatures ranging from 11 to 15 K. The best model to reproduce our spectra of N2H+ and N2D+ hints at the presence of a static central core (~3000 au, 21″) surrounded by an infalling gas layer. Furthermore, the high-J N2H+ and N2D+ lines that we observe are very sensitive to depletion because of their high critical densities (up to~5×106 cm−3), and our best model does not include any depletion towards the centre of the core. Because I16293E is embedded in a very active environment, it might undergo a local enhancement of cosmic rays that could partially counteract high densities and low temperatures that cause molecular depletion towards the centre of pre-stellar cores (Ceccarelli et al. 2014; Padovani et al. 2016). Additionally, because of the possible passage of a shock (Lis et al. 2002, 2016), the high-density nucleus in I16293E may have formed quickly, leaving not enough time for substantial freeze-out. Our tests cannot completely exclude depletion, especially at radii <1000 au (7″). High angular resolution observations to derive the physical structure of the inner part of the pre-stellar core will be necessary in this regard. We could not reproduce the N2 H+ and N2D+lines using abundance profiles derived from chemical models. Nevertheless, the insights gained from these tests will be used to further constrain our models, especially concerning the radial dependence of the cosmic-ray ionisation rate.
I16293E exhibits some of the highest levels of deuterium fractionation observed in pre-stellar cores. This includes the detection of several multiply deuterated molecules. From the abundance profiles of our best models for N2H+ and N2D+, we derive a deuterium fraction of 0.44, among the largest values measured in similar objects.
The wide frequency coverage of the APEX data allowed us to detect the emission of 16 additional molecules, half of which are deuterated isotopologues. Given the complex morphology of the area and the limited angular resolution of our observations (13″–26″), we used the line profiles to disentangle different gas components in the line of sight. Some lines show multiple velocity components, and we suggest that some shocked gas from the outflows originating from the IRAS 16293-2422 A and B protostars contribute to the emission of molecules like CS and CH3OH. This is very clearly seen in the brightest lines shown in Figure 2. There are, however, some lines that show a single-Gaussian profile and no hints of multiple velocity components. This is the case for HDO, HDS, NH2D, and ND3, as well as N2H+ andN2D+.
High spectral resolution observations coupled with radiative transfer modelling and supported by state-of-the-art chemical models are mandatory in order to dissect the contribution of different gas components towards I16293E, and finally to determine the chemical ingredients that are available for the future planetary systems that will form in the area. Future studies coupling observations and modelling should in particular explore how the enhanced deuteration affects different classes of molecules, with a particular focus on complex organic molecules.
Acknowledgements
The authors wish to thank the anonymous referee for the careful review of the manuscript. S.S., E.R., P.C. O.S., J.E.P. gratefully acknowledge the support of the Max Planck Society. The data was collected under the Atacama Pathfinder Experiment (APEX) Project, led by the Max Planck Institute for Radio Astronomy at the ESO La Silla Paranal Observatory. This research has made use of data from the Herschel Gould Belt survey (HGBS) project (http://gouldbelt-herschel.cea.fr). The HGBS is a Herschel Key Programme jointly carried out by SPIRE Specialist Astronomy Group 3 (SAG 3), scientists of several institutes in the PACS Consortium (CEA Saclay, INAF-IFSI Rome and INAF-Arcetri, KU Leuven, MPIA Heidelberg), and scientists of the Herschel Science Center (HSC). This research has made use of spectroscopic and collisional data from the EMAA database (https://emaa.osug.fr and https://dx.doi.org/10.17178/EMAA). EMAA is supported by the Observatoire des Sciences de l’Univers de Grenoble (OSUG).
Appendix A Velocity profile and abundance profile tests
Different velocity and abundance profiles have been tested to reproduce the N2H+ and N2D+ lines using the physical structure derived from Herschel observations (see Section 2.2).
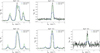 |
Fig. A.1 Results of tests for the velocity radial profile. The green curve shows the results of the non-LTE modelling done assuming a static core (i.e. v=0 in the whole core). The blue dashed curve shows the results of the non-LTE modelling done assuming a static envelope (the velocity was set to −0.5 km s−1 in the central part of the core and equal to zero at radii larger than 3000 au. |
The velocity radial profile that reproduces best our observations is represented by a static central core (v=0 at r< 3000 au) and an infalling outer gas layer (v=−0.5 km s−1 at r> 3000 au). Our tests using different velocity radial profiles are shown in Figure A.1. The asymmetry in the N2H+ 3-2 line cannot be reproduced with a static core (green curve in Figure A.1). Most of the lines, but particularly the high-J transitions of both N2H+ and N2D+, cannot be reproduced if we assume a static envelope and an infalling central part of the core (v=−0.5 km s−1 at r< 3000 au, see the blue dashed curve in Figure A.1.
The abundance profile that reproduces best our observations is a step function with values of 4.5×10⁻¹⁰ for N2H+ and 2×10⁻¹⁰ for N2D+ in the inner 3000 au and a drop of 30% of the central values at radii larger than 3000 au. It is however expected for molecules to freeze-out in the central regions of pre-stellar cores because of the high densities and low temperatures (Caselli et al. 2022). Our tests assuming a complete depletion in the central 2000 and 1000 au are shown in Figure A.2. The high-/ transitions of N2H+ and N2D+ are poorly reproduced if assuming a complete depletion in the central 2000 au (dashed blue curve in Figure A.2). It is important to note that these transitions have a high critical density (~107 cm−3) and they are presumably emitting only in the dense gas at the centre of the pre-stellar core. A significant improvement can be seen if we assume a smaller radius for the complete depletion, 1000 au (green curve in Figure A.2), although the high-J transitions are still better reproduced without depletion (red curve in Figure 1). However, given the angular resolution of our Herschel observations (~2700 au), we would need a better resolved physical structure to make a more conclusive statement on the complete freeze-out radius for N2H+ and N2D+ in I16293E.
Figure A.3 shows the results of radiative transfer models using the radial abundance profiles from the chemical models described in Sipilä et al. (2019). We furthermore tested the effects of a radial dependence of ζ following the approach described in Padovani et al. (2018) and used in Redaelli et al. (2021). The abundance profiles that have been used are shown in Figure A.4.
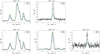 |
Fig. A.2 Results of tests on the effects of depletion. The blue dashed curve shows the results of the non-LTE modelling done assuming a complete depletion in the inner 2000 au of the core, while the green curve assumes a complete depletion in the inner 1000 au of the core. |
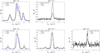 |
Fig. A.3 Results of tests using abundance profiles from chemical models. The blue curve shows the results of the non-LTE modelling using the abundance profiles of N2H+ and N2D+ predicted from the chemical model presented in Sipilä et al. (2019). The green dashed and red dotted curves instead use a chemical model with a radial dependence of the cosmic-ray ionisation rate, with the high model (H) and with the low model (L) from Padovani et al. (2018), respectively. |
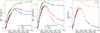 |
Fig. A.4 Abundance profiles from chemical models. Left and central panels: Abundance profiles from different models for N2H+ and N2D+. Right panel: Abundance profiles for ND and NH from Sipilä et al. (2019) at 105yr. |
Appendix B Dust temperature and H2 column density maps of I16293E
The dust colour temperature (TC) and H2 column density (N(H2)) maps of the I16293E core and the adjacent protostellar core IRAS 16293-2422 are shown in Fig. B.1. These are derived from Herschel/PACS and SPIRE/HiRes images at the wavelengths λ = 70, 100, 160, 250, 350, and 500 µm by fitting a grey body function to aligned surface brightness maps. Colour corrections recommended in Herschel documentation4 were applied to the observed surface brightness values in the iterative solution, needed to take into account the dependence of the effective bandwidth of the instrument on the temperature of the source. We assumed that the dust opacity at 250 µm is κ250 µm = 0.1 cm2 g−1, and that the dust emissivity index is β = 2. This assumption approximately corresponds the dust opacity model of Ossenkopf & Henning (1994) for unprocessed dust particles with thin ice coatings. The positions of the dust emission peak in I16293E, the D2H+ peak discovered by Pagani et al. (2024), and the protostars IRAS 16293-2422 A and B are indicated in the maps.
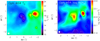 |
Fig. B.1 Dust colour temperature (TC) and H2 column density (N(H2)) maps of the IRAS 16293 region derived using Herschel PACS images at 70, 100, and 160 µm, and deconvolved SPIRE HiRes images at 250, 350, and 500 µm. The position observed in the present work is indicated with a plus sign, and the D2H+ peak discovered by Pagani et al. (2024) is indicated with a diamond. The protostellar core IRAS 16293-2422 dominates the right side of both images. The positions of the protostars IRAS 16293-2422 A and B are shown with asterisks. The column density at the (0,0) is 2.8 × 1023 cm−2 and the TC there is 12.3 K. The effective beam of the SPIRE HiRes map at 500 µm is indicated in the bottom left corner of the image. |
References
- Bacmann, A., Daniel, F., Caselli, P., et al. 2016, A&A, 587, A26 [NASA ADS] [CrossRef] [EDP Sciences] [Google Scholar]
- Bechtel, H. A., Steeves, A. H., & Field, R. W. 2006, ApJ, 649, L53 [CrossRef] [Google Scholar]
- Brünken, S., Müller, H. S. P., Thorwirth, S., et al. 2006, J. Mol. Struct., 780, 3 [CrossRef] [Google Scholar]
- Bocquet, R., Demaison, J., Cosléou, J., et al., 1999, J. Mol. Spectrosc., 195, 345 [NASA ADS] [CrossRef] [Google Scholar]
- Bogey, M., Demuynck, C., & Destombes, J. L. 1986, Chem. Phys. Lett., 125, 383 [NASA ADS] [CrossRef] [Google Scholar]
- Caselli, P., & Ceccarelli, C. 2012, A&A Rev., 20, 56 [NASA ADS] [CrossRef] [Google Scholar]
- Caselli, P., & Dore, L. 2005, A&A, 433, 1145 [NASA ADS] [CrossRef] [EDP Sciences] [Google Scholar]
- Caselli, P., Pineda, J. E., Sipilä, O., et al. 2022, ApJ, 929, 13 [NASA ADS] [CrossRef] [Google Scholar]
- Ceccarelli, C., Dominik, C., López-Sepulcre, A., et al. 2014, ApJ, 790, L1 [Google Scholar]
- Cazzoli, G., Dore, L., Puzzarini, C., et al. 2002, Phys. Chem. Chem. Phys. (Incorp. Faraday Trans.), 4, 35755 [Google Scholar]
- Clark, W. W., & De Lucia, F. C. 1976, J. Mol. Spectrosc., 60, 332 [CrossRef] [Google Scholar]
- Crapsi, A., Caselli, P., Walmsley, C. M., et al. 2005, ApJ, 619, 379 [Google Scholar]
- Crapsi, A., Caselli, P., Walmsley, M. C., et al. 2007, A&A, 470, 221 [NASA ADS] [CrossRef] [EDP Sciences] [Google Scholar]
- Daniel, F., Faure, A., Pagani, L., et al. 2016, A&A, 592, A45 [NASA ADS] [CrossRef] [EDP Sciences] [Google Scholar]
- Dixon, T. A., & Woods, R. C. 1977, J. Chem. Phys., 67, 3956 [CrossRef] [Google Scholar]
- Dzib, S. A., Ortiz-León, G. N., Hernández-Gómez, A., et al. 2018, A&A, 614, A20 [NASA ADS] [CrossRef] [EDP Sciences] [Google Scholar]
- Helminger, P., & Gordy, W. 1969, Phys. Rev., 188, 100 [NASA ADS] [CrossRef] [Google Scholar]
- Helminger, P., Cook, R. L., & De Lucia, F. C. 1971, J. Mol. Spectrosc., 40, 125 [NASA ADS] [CrossRef] [Google Scholar]
- Herbst, E., & van Dishoeck, E. F. 2009, ARA&A, 47, 427 [NASA ADS] [CrossRef] [Google Scholar]
- Hildebrand, R. H. 1983, QJRAS, 24, 267 [NASA ADS] [Google Scholar]
- Jørgensen, J. K., Favre, C., Bisschop, S. E., et al. 2012, ApJ, 757, L4 [Google Scholar]
- Juvela, M. 2020, A&A, 644, A151 [NASA ADS] [CrossRef] [EDP Sciences] [Google Scholar]
- Kahle, K. A., Hernández-Gómez, A., Wyrowski, F., et al. 2023, A&A, 673, A143 [NASA ADS] [CrossRef] [EDP Sciences] [Google Scholar]
- Klapper, G., Surin, L., Lewen, F., et al. 2003, ApJ, 582, 262 [NASA ADS] [CrossRef] [Google Scholar]
- Ladjelate, B., André, P., Könyves, V., et al. 2020, A&A, 638, A74 [NASA ADS] [CrossRef] [EDP Sciences] [Google Scholar]
- Lin, S.-J., Pagani, L., Lai, S.-P., et al. 2020, A&A, 635, A188 [NASA ADS] [CrossRef] [EDP Sciences] [Google Scholar]
- Lique, F., Daniel, F., Pagani, L., et al. 2015, MNRAS, 446, 1245 [NASA ADS] [CrossRef] [Google Scholar]
- Lis, D. C., Gerin, M., Phillips, T. G., et al. 2002, ApJ, 569, 322 [NASA ADS] [CrossRef] [Google Scholar]
- Lis, D. C., Wootten, H. A., Gerin, M., et al. 2016, ApJ, 827, 133 [NASA ADS] [CrossRef] [Google Scholar]
- Melosso, M., Bizzocchi, L., Dore, L., et al. 2021, J. Mol. Spectrosc., 377, 111431 [NASA ADS] [CrossRef] [Google Scholar]
- Messer, J. K., De Lucia, F. C., & Helminger, P. 1984, J. Mol. Spectrosc., 105, 139 [NASA ADS] [CrossRef] [Google Scholar]
- Müller, H. S. P., & Lewen, F. 2017, J. Mol. Spectrosc., 331, 28 [CrossRef] [Google Scholar]
- Müller, H. S. P., Schlöder, F., Stutzki, J., et al. 2005, J. Mol. Struct., 742, 215 [CrossRef] [Google Scholar]
- Ossenkopf, V., & Henning, Th. 1994, A&A, 291, 943 [NASA ADS] [Google Scholar]
- Padovani, M., Marcowith, A., Hennebelle, P., et al. 2016, A&A, 590, A8 [NASA ADS] [CrossRef] [EDP Sciences] [Google Scholar]
- Padovani, M., Ivlev, A. V., Galli, D., et al. 2018, A&A, 614, A111 [NASA ADS] [CrossRef] [EDP Sciences] [Google Scholar]
- Pagani, L., Belloche, A., & Parise, B. 2024, A&A, 691, A88 [NASA ADS] [CrossRef] [EDP Sciences] [Google Scholar]
- Pattle, K., Ward-Thompson, D. and Kirk, J. M., et al. 2015, MNRAS, 450, 1049 [Google Scholar]
- Pickett, H. M., Poynter, R. L., Cohen, E. A., et al. 1998, J. Quant. Spec. Radiat. Transf., 60, 883 [Google Scholar]
- Pineda, J. E., Harju, J., Caselli, P., et al. 2022, AJ, 163, 294 [NASA ADS] [CrossRef] [Google Scholar]
- Redaelli, E., Sipilä, O., Padovani, M., et al. 2021, A&A, 656, A109 [NASA ADS] [CrossRef] [EDP Sciences] [Google Scholar]
- Roberts, H., Herbst, E., & Millar, T. J. 2003, ApJ, 591, L41 [CrossRef] [Google Scholar]
- Roy, A., André, P., Palmeirim, P., et al. 2014, A&A, 562, A138 [NASA ADS] [CrossRef] [EDP Sciences] [Google Scholar]
- Roueff, E., Loison, J. C., & Hickson, K. M. 2015, A&A, 576, A99 [NASA ADS] [CrossRef] [EDP Sciences] [Google Scholar]
- Saykally, R. J., Szanto, P. G., Anderson, T. G., et al. 1976, ApJ, 204, L143 [NASA ADS] [CrossRef] [Google Scholar]
- Shirley, Y. L. 2015, PASP, 127, 299 [Google Scholar]
- Sipilä, O., Caselli, P., & Harju, J. 2019, A&A, 631, A63 [Google Scholar]
- Sokolov, V., Wang, K., Pineda, J. E., et al. 2017, A&A, 606, A133 [NASA ADS] [CrossRef] [EDP Sciences] [Google Scholar]
- Stark, R., Sandell, G., Beck, S. C., et al. 2004, ApJ, 608, 341 [NASA ADS] [CrossRef] [Google Scholar]
- Xu, L.-H., Fisher, J., Lees, R. M., et al. 2008, J. Mol. Spectrosc., 251, 305 [NASA ADS] [CrossRef] [Google Scholar]
- Zakharenko, O., Motiyenko, R. A., Margulès, L., et al. 2015, J. Mol. Spectrosc., 317, 41 [NASA ADS] [CrossRef] [Google Scholar]
Available at https://emaa.osug.fr/species-list
All Tables
All Figures
|
Fig. 1 APEX observations of several transitions of N2H+ and N2D+ towards the dust peak of the pre-stellar core I16293E (black histograms) and results of the LOC non-LTE radiative transfer model (red curve). The physical model of I16293E computed from Herschel SPIRE and PACS data is shown in the upper right panel. The black curve (left y-axis) shows the total volume density |
| In the text | |
|
Fig. 2 Molecular lines observed towards the dust peak of I16293E with APEX. The vertical red dotted line shows the vLSR of the core, 3.7 km s−1. Given the complexity of the environment around I16293E, the rest velocity slightly changes depending on the molecule, as already pointed out in Lis et al. (2016) and Kahle et al. (2023). Both lines present in the panel of fully deuterated ammonia (ND3), top right corner, are hyperfine components of the same rotational transition of ND3 . The stick spectrum at the bottom of the panel of ND3 shows the hyperfine structure of the transition. Their spectroscopic parameters are reported in Table 2. |
| In the text | |
|
Fig. 3 Far-infrared maps and averaged intensity profiles of I16293E. Top: Herschel SPIRE HiRes and PACS surface brightness maps at 500 µm, 350 µm, 250 µm, and 160 µm. The latter three are smoothed to the SPIRE HiRes resolution 15″. The hatched areas are masked out in the calculation of intensity profiles to avoid a contribution from IRAS16293-2422. Bottom: circularly averaged surface brightness profiles. The error bars show standard deviations within annular regions. The solid curves show Plummer-type functions fitted to the averages. |
| In the text | |
|
Fig. 4 Zoomed-in image of the blue-shifted and red-shifted velocity components present in some of the observed lines. The vertical red dotted line shows the vLS R of the core, 3.7 km s−1. |
| In the text | |
|
Fig. A.1 Results of tests for the velocity radial profile. The green curve shows the results of the non-LTE modelling done assuming a static core (i.e. v=0 in the whole core). The blue dashed curve shows the results of the non-LTE modelling done assuming a static envelope (the velocity was set to −0.5 km s−1 in the central part of the core and equal to zero at radii larger than 3000 au. |
| In the text | |
|
Fig. A.2 Results of tests on the effects of depletion. The blue dashed curve shows the results of the non-LTE modelling done assuming a complete depletion in the inner 2000 au of the core, while the green curve assumes a complete depletion in the inner 1000 au of the core. |
| In the text | |
|
Fig. A.3 Results of tests using abundance profiles from chemical models. The blue curve shows the results of the non-LTE modelling using the abundance profiles of N2H+ and N2D+ predicted from the chemical model presented in Sipilä et al. (2019). The green dashed and red dotted curves instead use a chemical model with a radial dependence of the cosmic-ray ionisation rate, with the high model (H) and with the low model (L) from Padovani et al. (2018), respectively. |
| In the text | |
|
Fig. A.4 Abundance profiles from chemical models. Left and central panels: Abundance profiles from different models for N2H+ and N2D+. Right panel: Abundance profiles for ND and NH from Sipilä et al. (2019) at 105yr. |
| In the text | |
|
Fig. B.1 Dust colour temperature (TC) and H2 column density (N(H2)) maps of the IRAS 16293 region derived using Herschel PACS images at 70, 100, and 160 µm, and deconvolved SPIRE HiRes images at 250, 350, and 500 µm. The position observed in the present work is indicated with a plus sign, and the D2H+ peak discovered by Pagani et al. (2024) is indicated with a diamond. The protostellar core IRAS 16293-2422 dominates the right side of both images. The positions of the protostars IRAS 16293-2422 A and B are shown with asterisks. The column density at the (0,0) is 2.8 × 1023 cm−2 and the TC there is 12.3 K. The effective beam of the SPIRE HiRes map at 500 µm is indicated in the bottom left corner of the image. |
| In the text | |
Current usage metrics show cumulative count of Article Views (full-text article views including HTML views, PDF and ePub downloads, according to the available data) and Abstracts Views on Vision4Press platform.
Data correspond to usage on the plateform after 2015. The current usage metrics is available 48-96 hours after online publication and is updated daily on week days.
Initial download of the metrics may take a while.