Fig. 1
Download original image
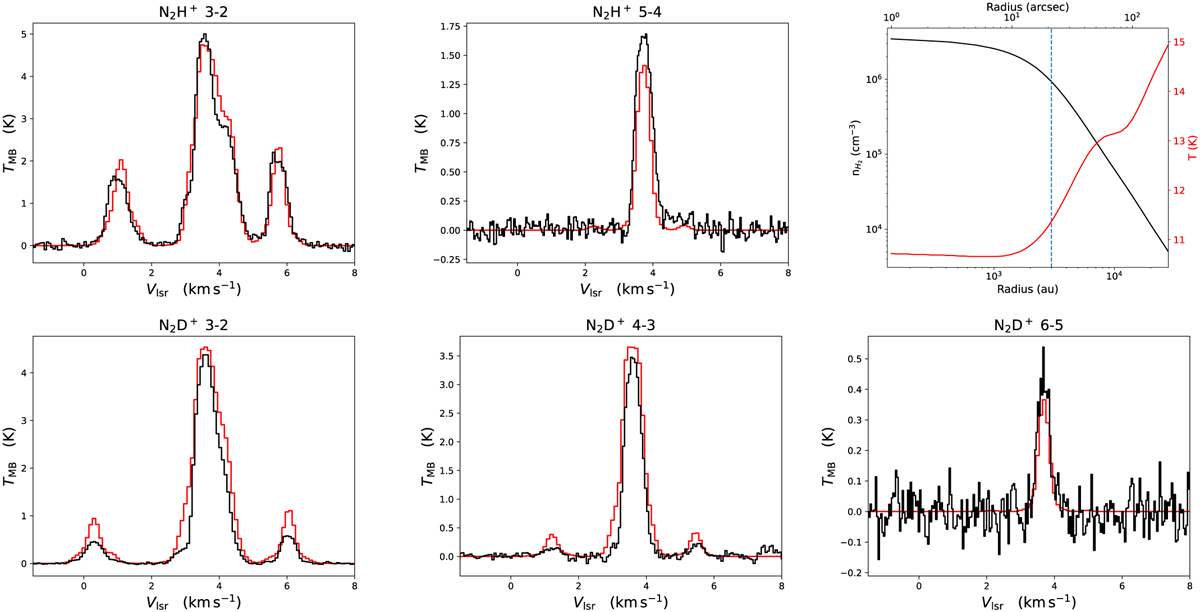
APEX observations of several transitions of N2H+ and N2D+ towards the dust peak of the pre-stellar core I16293E (black histograms) and results of the LOC non-LTE radiative transfer model (red curve). The physical model of I16293E computed from Herschel SPIRE and PACS data is shown in the upper right panel. The black curve (left y-axis) shows the total volume density ![]() , the red curve (right y-axis) shows the dust temperature, and the vertical dashed line indicates the 3000 au (21″) inner radius of the infalling envelope (see Sect. 3).
, the red curve (right y-axis) shows the dust temperature, and the vertical dashed line indicates the 3000 au (21″) inner radius of the infalling envelope (see Sect. 3).
Current usage metrics show cumulative count of Article Views (full-text article views including HTML views, PDF and ePub downloads, according to the available data) and Abstracts Views on Vision4Press platform.
Data correspond to usage on the plateform after 2015. The current usage metrics is available 48-96 hours after online publication and is updated daily on week days.
Initial download of the metrics may take a while.