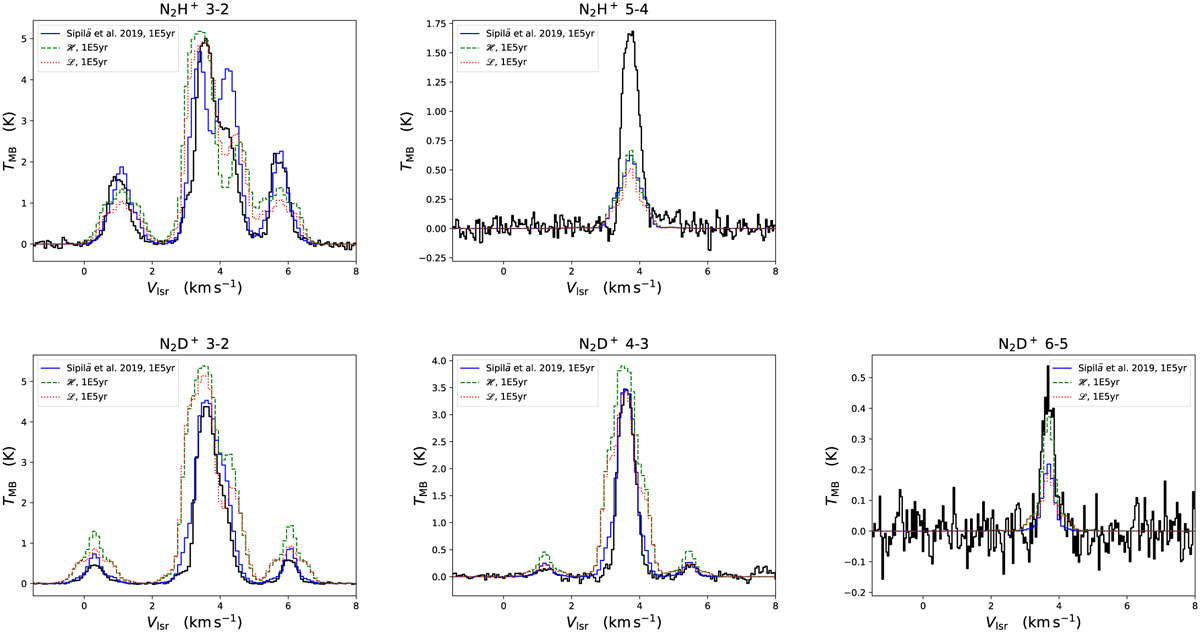
Fig. A.3
Download original image
Results of tests using abundance profiles from chemical models. The blue curve shows the results of the non-LTE modelling using the abundance profiles of N2H+ and N2D+ predicted from the chemical model presented in Sipilä et al. (2019). The green dashed and red dotted curves instead use a chemical model with a radial dependence of the cosmic-ray ionisation rate, with the high model (H) and with the low model (L) from Padovani et al. (2018), respectively.
Current usage metrics show cumulative count of Article Views (full-text article views including HTML views, PDF and ePub downloads, according to the available data) and Abstracts Views on Vision4Press platform.
Data correspond to usage on the plateform after 2015. The current usage metrics is available 48-96 hours after online publication and is updated daily on week days.
Initial download of the metrics may take a while.