Fig. 3
Download original image
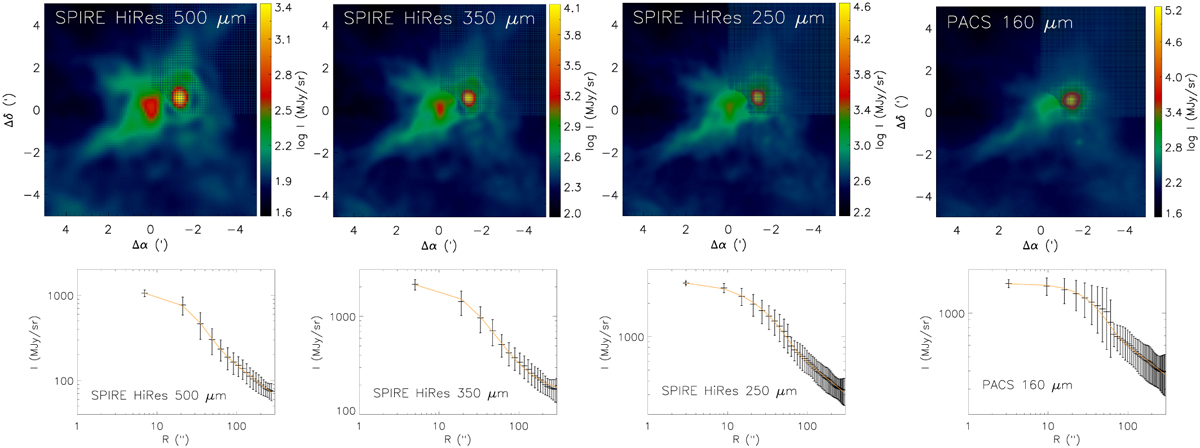
Far-infrared maps and averaged intensity profiles of I16293E. Top: Herschel SPIRE HiRes and PACS surface brightness maps at 500 µm, 350 µm, 250 µm, and 160 µm. The latter three are smoothed to the SPIRE HiRes resolution 15″. The hatched areas are masked out in the calculation of intensity profiles to avoid a contribution from IRAS16293-2422. Bottom: circularly averaged surface brightness profiles. The error bars show standard deviations within annular regions. The solid curves show Plummer-type functions fitted to the averages.
Current usage metrics show cumulative count of Article Views (full-text article views including HTML views, PDF and ePub downloads, according to the available data) and Abstracts Views on Vision4Press platform.
Data correspond to usage on the plateform after 2015. The current usage metrics is available 48-96 hours after online publication and is updated daily on week days.
Initial download of the metrics may take a while.