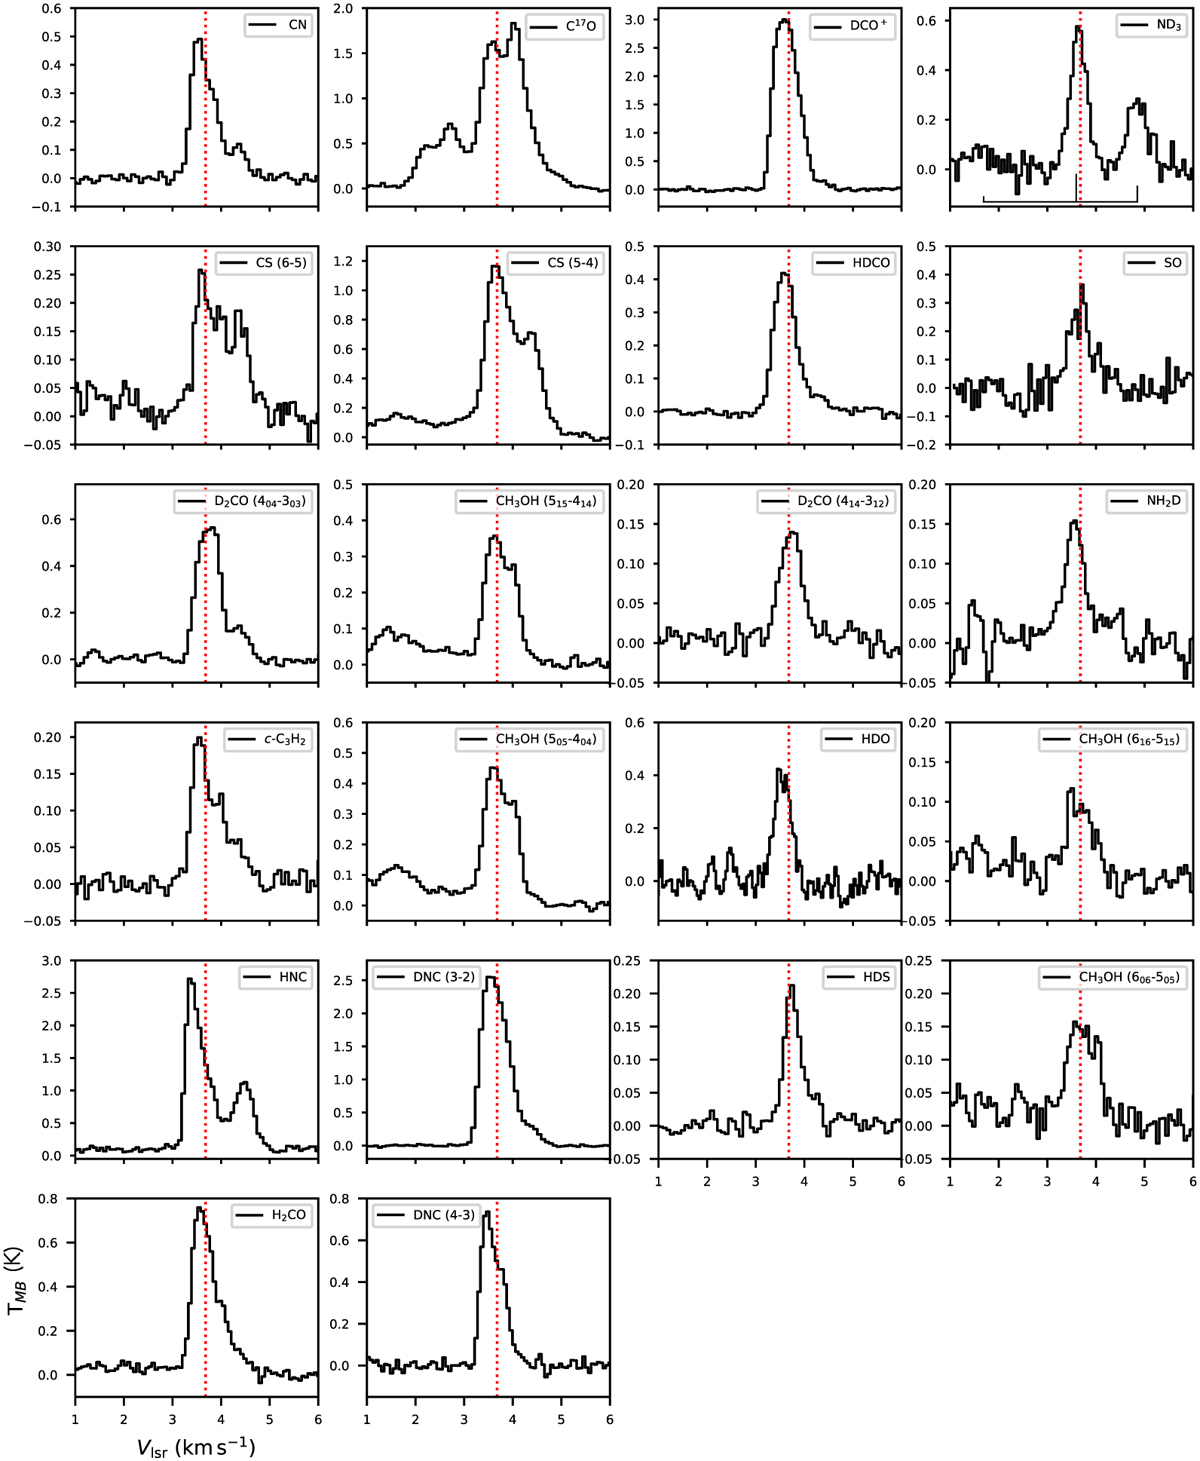
Fig. 2
Download original image
Molecular lines observed towards the dust peak of I16293E with APEX. The vertical red dotted line shows the vLSR of the core, 3.7 km s−1. Given the complexity of the environment around I16293E, the rest velocity slightly changes depending on the molecule, as already pointed out in Lis et al. (2016) and Kahle et al. (2023). Both lines present in the panel of fully deuterated ammonia (ND3), top right corner, are hyperfine components of the same rotational transition of ND3 . The stick spectrum at the bottom of the panel of ND3 shows the hyperfine structure of the transition. Their spectroscopic parameters are reported in Table 2.
Current usage metrics show cumulative count of Article Views (full-text article views including HTML views, PDF and ePub downloads, according to the available data) and Abstracts Views on Vision4Press platform.
Data correspond to usage on the plateform after 2015. The current usage metrics is available 48-96 hours after online publication and is updated daily on week days.
Initial download of the metrics may take a while.