| Issue |
A&A
Volume 693, January 2025
|
|
|---|---|---|
| Article Number | A147 | |
| Number of page(s) | 11 | |
| Section | Interstellar and circumstellar matter | |
| DOI | https://doi.org/10.1051/0004-6361/202451284 | |
| Published online | 13 January 2025 | |
Probing the heating of the neutral atomic interstellar medium in the Dwarf Galaxy Survey through infrared cooling lines
1
Université Paris-Cité, Université Paris-Saclay, CEA, CNRS, AIM,
91191
Gif-sur-Yvette,
France
2
Institut fur Theoretische Astrophysik, Zentrum für Astronomie, Universität Heidelberg,
Albert-Ueberle-Str. 2,
69120
Heidelberg,
Germany
3
Physics Department, Elon University,
100 Campus Drive,
Elon,
NC
27244,
USA
★ Corresponding author; This email address is being protected from spambots. You need JavaScript enabled to view it.
Received:
27
June
2024
Accepted:
7
November
2024
Abstract
Context. Star formation in galaxies is regulated by dynamical and thermal processes. In the Milky Way and star-forming galaxies with similar metallicity, the photoelectric effect on small dust grains usually dominates the heating of the neutral atomic gas, which constitutes the main star-forming gas reservoir. In more metal-poor galaxies, the lower dust-to-gas mass ratio together with the higher occurrence and luminosity of X-ray sources suggest that other heating mechanisms may be at play.
Aims. We aim to determine the contribution of the photoelectric effect, photoionization by UV and X-ray photons, and ionization by cosmic rays to the total heating of the neutral gas in a sample of 37 low-metallicity galaxies. In particular, we wish to assess whether X-ray sources can be a significant source of heating. We also attempt to recover the intrinsic X-ray fluxes and compare them with observations when available.
Methods. We used the statistical code MULTIGRIS together with a photoionization grid of Cloudy models propagating radiation from stellar clusters and potential X-ray sources to the ionized and neutral gas. This grid includes physical parameters such as metallicity, gas density, ionization parameter, and radiative source properties. We describe a galaxy as a combination of many 1D components linked by a few physical hyperparameters. We used infrared cooling lines as constraints to evaluate the most likely combinations and parameters.
Results. We constrained the heating fractions for the main mechanisms for the first time in a low-metallicity galaxy sample. We show that for the higher metallicity galaxies, the photoelectric effect dominates the neutral gas heating. At metallicities below 1 /8 the Milky Way value, cosmic rays and photoionization can become predominant. We computed an observational proxy for the photoelectric effect heating efficiency on polycyclic aromatic hydrocarbons (PAHs) using the total cooling traced by [CII] 158 µm + [OI] 63 µm. We show that this proxy can match theoretical expectations when accounting for the fraction of the heating due to the photoelectric effect according to our models. Finally, we show that it is possible to predict the X-ray fluxes reasonably well in the 0.3–8 keV band from the gas cooling lines for most of the galaxies observed in this band. With the current grid and assumptions, determining the exact heating fraction due to cosmic rays remains difficult, but we speculate that heating from X-ray sources is more important.
Conclusions. As expected from the low abundance of dust and PAHs in metal-poor galaxies, heating mechanisms other than the photoelectric effect heating must be accounted for. Bright X-ray sources may deposit their energy on large scales in such transparent, dust-poor interstellar medium, and thus they represent promising avenues to understand the physical properties of the main star-forming gas reservoir in galaxies. The modeling strategy adopted here makes it possible to recover the global intrinsic radiation field properties when X-ray observations are unavailable, such as in early universe galaxies.
Key words: cosmic rays / ISM: general / photon-dominated region (PDR) / galaxies: ISM
© The Authors 2025
 Open Access article, published by EDP Sciences, under the terms of the Creative Commons Attribution License (https://creativecommons.org/licenses/by/4.0), which permits unrestricted use, distribution, and reproduction in any medium, provided the original work is properly cited.
This article is published in open access under the Subscribe to Open model. This email address is being protected from spambots. You need JavaScript enabled to view it. to support open access publication.
1 Introduction
While star formation mainly occurs in dense, cold neutral molecular gas, the main gas reservoir over long timescales is warmer (few 102–3 K) and atomic. For typical billion years timescales, star formation is regulated by thermodynamical processes that control the transformation of warm neutral atomic gas into cold neutral molecular gas (e.g., Chevance et al. 2023). Heating of the ionized gas of H II regions is known to be dominated by UV photoionization of H and He, but the neutral gas heating is comparatively less well known. It is due to many potential mechanisms, including the photoelectric effect, cosmic ray (CR) ionization, X-ray photoionization, and shocks (see Dalgarno & McCray 1972; Girichidis et al. 2020), that are difficult to disentangle, and many of them are linked to the production of ionizing photons or energetic events that provide information regarding important galactic parameters, such as star formation rate (SFR). Since the heating mechanisms are difficult to probe directly, fine- structure cooling lines can be observed instead, which allow for the inference of several diagnostics, when assuming thermal equilibrium.
At solar metallicity (Z⊙), neutral atomic gas heating is generally dominated by the photoelectric effect on dust grains (e.g., Weingartner & Draine 2001). The majority of the photoelectric effect heating is due to small grains and polycyclic aromatic hydrocarbons (PAHs; Berné et al. 2022). Since the dust-to-gas mass ratio (DGR) decreases with metallicity (Galliano et al. 2021), as does the PAH abundance (PAH emission is not detected under 1/10 Z⊙ Rémy-Ruyer et al. 2015), a relatively lower photoelectric effect heating rate is expected at lower metallicities even if small non-PAH grains may still contribute to the heating.
It could be compensated by mechanisms such as CR heating, photoionization by X-rays, or shocks. The theoretical study from Bialy & Sternberg (2019) indeed shows that CR heating can become prominent at low metallicity. Similar results are found by Brugaletta et al. (2024) in magneto-hydrodynamic simulations including CR propagation in low-metallicity galaxies. However an observationally driven confirmation is still needed. Moreover, the increasing luminosity and number of luminous X-ray sources in metal-poor galaxies (Brorby et al. 2014; Lehmer et al. 2021; Cann et al. 2024) suggest that photoionization by X-rays can also be an important source of heating at low metallicity. This has been explored by Péquignot (2008) and Lebouteiller et al. (2017) in the extremely low metallicity star-forming dwarf galaxy I Zw 18 (≈1/35 Z⊙), showing that X-ray heating should dominate over the photoelectric effect and proposing that CR ionization may not be important. The relative contribution of the photoelectric effect, CRs, and photoionization by X-rays to the heating of the neutral gas has been investigated in the Milky Way by Wolfire et al. (2003). However, there is no theoretical study to our knowledge that includes the contribution of X-ray photoionization to the heating at very-low metallicity.
From an observational perspective, it is particularly difficult to distinguish between CR heating and X-ray heating since both mechanisms effectively lead to the ionization of the same species. However, since CRs and X-rays penetrate at different depths within a cloud (depending on the X-ray photon energy), several studies have attempted to differentiate them by probing the chemical network and its resulting tracers, especially at high extinction (e.g., ionized molecules; Wolfire et al. 2022). CO emission has also been used to probe X-ray dominated regions (e.g., Mingozzi et al. 2018; Vallini et al. 2019) and to distinguish them from CR dominated regions (Meijerink et al. 2006), even though a strong conclusion is difficult to reach (e.g., Rigopoulou et al. 2013; Rosenberg et al. 2014). Molecular gas is unfortunately and notoriously difficult to probe in extremely metal-poor galaxies (e.g., Cormier et al. 2014; Hunter et al. 2024), and in this work we instead focus on the neutral atomic gas (with some contribution from the so-called CO-dark molecular gas Wolfire et al. 2010; Madden et al. 2020), which is mainly cooling down through IR cooling lines [C II] 158 µm and [O I] 63 µm (Tielens & Hollenbach 1985a,b; Wolfire et al. 2003).
While X-ray sources are expected to play an important role in low-metallicity dwarf galaxies (Lebouteiller et al. 2017), their exact nature is generally unknown. Ultraluminous X-ray sources (ULXs, with LX > 1039 erg s−1; see review in Kaaret et al. 2017) have been detected in several dwarf galaxies, but the intrinsic shape of their spectral energy distribution (SED) remains unknown and seems to vary from one object to another (Ott et al. 2005). However, the ULX SED shape, and therefore the associated hints on the ULX nature, may be inferred indirectly from high ionization potential lines of the interstellar medium (ISM) irradiated by these compact sources (Garofali et al. 2024).
In this paper, we wish to determine the contribution of the photoelectric effect, CR, and X-ray photoionization to the total heating of the neutral atomic ISM in the Dwarf Galaxy Survey (DGS; Madden et al. 2013), which is a sample of dwarf galaxies covering a wide range of metallicities (from 1/35 Z⊙ to 1 /2 Z⊙). To this aim, we propose using adequate radiative transfer models in order to link heating and cooling processes, and we use infrared (IR) cooling lines as our main constraints. As a secondary aim, we wish to recover the X-ray fluxes of galaxies in the DGS where ULXs have been observed, in particular by using [OIV] 26 µm and [NeV] 14 µm as main constraints. Given their high ionization potentials, these ionized ISM lines are appropriate to probe the X-ray sources. Notably, such high ionization potential lines have already been used to probe ULX properties in Kaaret & Corbel (2009). Nevertheless, X-rays may also penetrate into the neutral medium and heat it, implying that lines such as [C II] 158 µm or [O I] 63 µm can provide additional constraints on the X-ray fluxes.
We describe in Sect. 2 the DGS sample and the corresponding observations in IR and X-rays. The modeling strategy is presented in Sect. 3 along with the statistical framework MULTI- GRIS used in this work. The main results are presented in Sect. 4. Potential improvements concerning CRs and X-ray sources are discussed in Sect. 5.
2 Observations
For this study, we used IR and X-ray observations of a sample of low-metallicity dwarf galaxies. IR lines are used to trace the cooling of the neutral and ionized ISM and allow us to infer physical conditions and potential heating mechanisms. X-ray observations are used to probe the presence of luminous X-ray binaries that produce significant ionization of the ISM. While we do not use the X-ray observations as direct constraints, we compare them in the following with the inferred X-ray source properties.
2.1 Sample
We used the sample from Ramambason et al. (2022), which is extracted from the DGS (Madden et al. 2013). Our sample contains 37 local star-forming dwarf galaxies (0.7–191 Mpc) with a metallicity spanning from 1/35 Z⊙ to 1/2 Z⊙, making it suitable for studying the variation of the heating mechanisms as a function of metallicity. We restricted the sample to spatially unresolved galaxies in order to include only objects with a coherent line set probing the full galaxy. This is also meant to match the method used on Sect. 3, which models entire galaxies. Previous studies on the DGS, based on SED fitting provided us with various parameters such as the mass of neutral and molecular hydrogen or the DGR (Rémy-Ruyer et al. 2014, 2015; Galliano et al. 2021).
2.2 Infrared spectroscopic observations
The Dwarf Galaxy Survey galaxies have been observed with Spitzer (mid-IR) and Herschel (far-IR), providing spectroscopic and photometric observations (emission lines and total IR luminosity; Cormier et al. 2015, 2019). Cooling lines in the neutral medium such as [C II] 158 µm and [O I] 63 µm are frequently detected (in 37 and 27 galaxies, respectively). We also have access to tracers of the ionized gas (e.g., [NeIII], [NeII]), including from highly ionized species such as O3+ ([OIII] detected in 17 galaxies) or Ne4+ (with [NeV] upper limits available for 31 galaxies).
For 27 galaxies in our sample, PAH emission is measured from Spitzer/IRS spectra (from the CASSISjuice database, Lebouteiller et al. 2011, 2015; Lebouteiller 2023) with the MILES spectral decomposition software, which uses the model from Galliano et al. (2008) together with the band profiles given in Table III.4 of Galliano (2022) to decompose the spectra into dust continuum, PAH emission bands, emission lines, and silicate absorption bands. This gave us access to the total PAH emission between 5 and 14 µm. For the 18 sources in the sample with a low signal-to-noise ratio and/or a low PAH abundance, this method provided an upper limit on the PAH emission.
2.3 X-ray observations
In order to compare the X-ray luminosities predicted by our models to actual observations, we searched the literature for observations of X-ray sources in the galaxies of our sample. Observations in the 0.3–10keV range from Chandra, XMM- Newton, and eROSITA are available for 15 galaxies (Thuan et al. 2004; Ott et al. 2005; Rosa González et al. 2009; Kaaret et al. 2011; Otí-Floranes et al. 2012; Kaaret & Feng 2013; Prestwich et al. 2013; Brorby et al. 2014; Prestwich et al. 2015; Gross et al. 2021; Bykov et al. 2023). Due to sensitivity, most of the observations are dominated by ULXs, except for two diffuse emission regions in He2-10 and NGC1569. All of these studies use a given physical model prescription for the X-ray spectrum and line- of-sight absorption, which together enable the recovery of the intrinsic X-ray spectrum from which luminosities are computed.
The X-ray emission of accreting black holes is thought to arise from two main components: a Compton corona, whose emission is described by a power law, and an accretion disk, modeled by a multicolor blackbody (see review in Remillard & McClintock 2006). Since the Compton emission is relatively more easily detected because it is less absorbed, all of the above studies computed the X-ray luminosities using a power law. A blackbody (potentially multicolor) was also used in Thuan et al. (2004), Ott et al. (2005), and Kaaret & Feng (2013) as a comparison.
We compiled 70 luminosities in eight different energy bands within 0.3–10 keV, some of them arising from the same observation processed with different physical models. Considering the relatively small differences in the luminosities obtained with different models (typically less than a factor of two), it would be beyond the scope of the present study to homogenize all observations by forcing the same physical model, so we instead averaged the luminosities computed from different models. However, we have chosen not to combine the luminosities coming from different studies altogether in order to prevent biases linked to the instrument or data reduction. This effectively led to multiple observations for a few galaxies such as IZw18 (see Table 1). The associated error bar accounts for the error on each prescription and the scatter of the different prescriptions.
In some galaxies, multiple sources can be observed. When this happens, we summed their luminosities to get the total X- ray luminosity of the galaxy. It is likely that dwarf galaxies host a collection of X-ray sources, of which ULXs represent the brightest tail. However ULXs are believed to account for the majority of the total X-ray luminosity (Garofali et al. 2024). The final luminosities obtained with this method can be found in Table 1.
3 Method
3.1 Strategy
We used 1D photoionization models as basic components to represent our galaxies. These models contain a central source (which is a star cluster, with or without a compact object) illuminating a slab or shell with a given density, metallicity, and depth. In order to describe a full galaxy with such models, we combined them through a statistical distribution. This method is meant both to use a physically motivated distribution and to keep a reasonable number of parameters (15 in the chosen “architecture”, described in Sect. 3.3).
With this method, the emission of an observable L is defined as
 (1)
(1)
with Φ(pi) as the weight associated with the parameter pi according to some statistical distribution, I(p) as the observable for a given parameter set, and Δ(pi) as the grid parameter interval. The weight Φ(pi) is determined by the statistical distribution used. For instance, a power-law distribution would be defined as
![Mathematical equation: $\Phi (p) = \left\{ {\matrix{ {{{10}^{{\alpha _p}}}} \hfill & {{\rm{if}}p \in \left[ {{p_{\min }},{p_{\max }}} \right]} \hfill \cr 0 \hfill & {} \hfill \cr } } \right\},$](/articles/aa/full_html/2025/01/aa51284-24/aa51284-24-eq2.png) (2)
(2)
while a broken power law would be defined as
![Mathematical equation: $\Phi (p) = \left\{ {\matrix{ {{{10}^{{\alpha _{p1}}}}} \hfill & {{\rm{if}}p \in \left[ {{p_{\min }},{p_0}} \right]} \hfill \cr {{{10}^{{\alpha _{p2}}}}} \hfill & {{\rm{if}}p \in \left[ {{p_0},{p_{\max }}} \right]} \hfill \cr 0 \hfill & {} \hfill \cr } } \right\},$](/articles/aa/full_html/2025/01/aa51284-24/aa51284-24-eq3.png) (3)
(3)
and a parameter described by a single value defined as
 (4)
(4)
A detailed description of this method is provided in Lebouteiller & Ramambason (2022) and is used in Ramambason et al. (2024) and Lebouteiller et al. (2024).
3.2 SFGX model database
In this study, we used the star-forming galaxies with X-ray sources (SFGX) grid of 1D models (Ramambason et al. 2022), calculated with the code Cloudy 17.02 (Ferland et al. 2017) and the stellar population BPASS (version 2.1; Eldridge et al. 2017). The latter uses variable stellar age and metallicity, with the stellar metallicity being equal to the ISM metallicity. Physical properties of the ISM such as the metallicity or density are varied. The DGR varies with metallicity following the prescription of Galliano et al. (2021). SFGX also includes a potential X-ray source whose emission is modeled as a multicolor blackbody, representing an accretion disk (Mitsuda et al. 1984). The inner temperature TX of the accretion disk is varied from 105 K to 107 K, while the outer temperature Tout is fixed to 103 K. The luminosity LX is given as a fraction of the bolometric luminosity spanning from 0 to 0.1. The X-ray and stellar SEDs used in SFGX are shown in Fig. 1. A complete description of the grid is provided in Ramambason et al. (2022). A synthetic version with the parameter ranges is presented in Table 2.
SFGX also allows the depth of the model to be a free parameter in order to describe matter-bounded clouds. Since running a full model is time consuming, one model was run for each set of primary parameters, with the stopping criterion being either the visual extinction (AV = 10) or the gas temperature (Te = 10 K), whichever happened first. These models were then truncated at different depths, creating several sub-models. These sub-models are defined by a parameter named “cut” in SFGX that determines the depth at which each model has been truncated. In order to make the sub-models comparable for different metallicities, the cut parameter was defined as follows: cut=0: illuminated face of the cloud, AV = 0; cut=1: H+-H0 transition; cut=2: H0-H2 transition; cut=3: C-CO transition; and cut=4: end of model (AV = 10 or Te = 10 K). We then defined non-integer cuts (0.25 step) by interpolating linearly on AV, resulting in 17 sub-models per model actually ran. One should keep in mind that Cloudy models cropped to a given cut are not strictly equivalent to models specifically designed to stop at that cut. This is due in particular to optical depth effects, but we have verified that these effects are not significant. To this purpose, we ran a set of 1D Cloudy models stopped at different depths to compare them to the cropped models, with the physical parameters being chosen to match the average conditions in the DGS galaxies. We found a difference in line emission below 30% for [C II] 158 µm and [O I] 63 µm caused by a drop of temperature at the outer edge of the cloud for the non-cropped models. This drop in temperature is likely caused by the absence of radiation beyond the depth at which the model is stopped, while in reality at least the diffuse interstellar radiation field will always illuminate the back of the cloud. Overall, we conclude that the cropped models, which do not show this temperature drop, provide a good enough approximation for line emission at any given depth.
Cloudy models give access to the heating rates, cooling rates, and intensity of emission lines at each depth within the cloud (see Fig. 2). In SFGX, these values are volume-integrated. Since we wished to analyze the heating mechanisms as a function of depth, we computed the heating and cooling rates integrated between two successive cuts. The same calculation was performed for the emission lines, allowing us to evaluate the fraction of the line emission corresponding to any given depth.
A strong hypothesis in SFGX is that the CR ionization rate is fixed at three times the Galactic value (i.e., 3 × 2 × 10−16 s−1; Indriolo et al. 2007). This choice was initially motivated by the elevated [O I] 145 µm/[OI] 63 µm ratio in the DGS, which cannot be explained without an enhanced CR ionization rate or a high X-ray luminosity (see Cormier et al. 2019 for details). Given that the latter was given a relatively low value, this likely led to a higher CR ionization rate than actually needed.
X-ray observations of DGS galaxies.
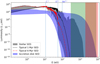 |
Fig. 1 Stellar SEDs with an instantaneous burst age of 1 Myr (black dashed line) and 6 Myr (red dashed line). The gray area represents the spread from the age-metallicity parameter space. The blue area shows the variation of an accretion disk SED when TX is varied (see text). The green and red shaded vertical stripes represent the 0.3–8 keV and 2–10 keV bands. |
Summary of SFGX primary parameters.
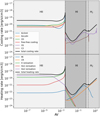 |
Fig. 2 Cooling and heating rate versus depth for the main mechanisms in a typical 1D model (stellar age: 6 Myr, L* = 109 L⊙, n = 2, U = −2, Z = 0.1 Z⊙, LX = 107 L⊙, TX = 106 K). The dashed vertical lines correspond to the cut values 1, 2, and 3. Acronyms: “IScclinH”: hydrogen recombination; “ISrcolH”: net free-bound cooling minus free-free heating; “PE”: photoelectric effect heating; “CR”: cosmic ray heating. |
3.3 Parameter estimation
For each galaxy (i.e., each set of IR observations and the associated error bars), the best combination of 1D models was inferred using the Bayesian code MULTIGRIS (Lebouteiller & Ramambason 2022), which uses Monte Carlo Markov chain (MCMC) techniques from the python package PyMC (Salvatier et al. 2016) with a sampler (sequential Monte-Carlo) adapted to multi-modal posterior distribution. We used the same distribution for the primary parameters as in Ramambason et al. (2024) for consistency purposes (see Table 2). The density (n) and ionization parameter (U) therefore follow power-law distributions, while the cut parameter follows a broken power law with a pivot fixed at the ionization front (i.e., cut=1). The other parameters are described by a single value, with LX and TX being linearly interpolated, while the metallicity, stellar age, and total luminosity use a nearest neighbor interpolation. We obtained a fairly good agreement between the predicted line fluxes and the observations, with 87% of the line fluxes being reproduced within 3σ (see Appendix A).
We obtained probability density functions (PDFs) for each parameter in the model. We also have access to the PDFs of the photoelectric effect, photoionization of hydrogen and helium (from UV and X-ray photons), and CR heating rates. We verified that they account together for at least 90% of the total heating in the neutral medium.
The inferred values of TX and LX allowed us to compute the flux of the X-ray sources and then to compare it to the observed fluxes when available. However, the comparison is not straightforward since we inferred the bolometric flux of the X-ray source, while observations correspond to a given band. We calculated the fraction of the bolometric flux in any given band for an accretion disk, ![Mathematical equation: ${C_{\left[ {{E_{\min }},{E_{\max }}} \right]}}$](/articles/aa/full_html/2025/01/aa51284-24/aa51284-24-eq12.png) , that depends on the band [Emin, Emax], and on the inner temperature of the disk TX. We used the formula for the accretion disk spectrum in Mitsuda et al. (1984) in order to compute this correction factor, which was then defined as follows:
, that depends on the band [Emin, Emax], and on the inner temperature of the disk TX. We used the formula for the accretion disk spectrum in Mitsuda et al. (1984) in order to compute this correction factor, which was then defined as follows:
![Mathematical equation: ${C_{\left[ {{E_{\min }},{E_{\max }}} \right]}}\left( {{T_X}} \right) = {{{L_{\left[ {{E_{\min }},{E_{\max }}} \right]}}} \over {{L_{{\rm{tot}}}}}}{{\mathop \smallint \nolimits^ _{{E_{{\rm{min}}}}}^{{E_{\max }}}dE\mathop \smallint \nolimits^ _{{T_{{\rm{out}}}}}^{{T_{\rm{X}}}}{{\left( {{T \over {{T_{\rm{X}}}}}} \right)}^{ - 11/3}}B(E,T){{dT} \over {{T_{\rm{X}}}}}} \over {\mathop \smallint \nolimits^ _0^\infty dE\mathop \smallint \nolimits^ _{{T_{{\rm{out}}}}}^{{T_{\rm{X}}}}{{\left( {{T \over {{T_{\rm{X}}}}}} \right)}^{ - 11/3}}B(E,T){{dT} \over {{T_{\rm{X}}}}}}},$](/articles/aa/full_html/2025/01/aa51284-24/aa51284-24-eq13.png) (5)
(5)
where B(E, T) is the blackbody radiation for a temperature T, while TX and Tout are defined in Sect. 3.2. ![Mathematical equation: ${C_{\left[ {{E_{\min }},{E_{\max }}} \right]}}$](/articles/aa/full_html/2025/01/aa51284-24/aa51284-24-eq14.png) is shown for different bands in Fig. 3.
is shown for different bands in Fig. 3.
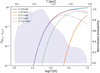 |
Fig. 3 Correction factor for different energy bands to obtain the bolometric X-ray luminosity, depending on the temperature of the inner side of the accretion disk as defined in Mitsuda et al. (1984). The inferred PDF of TX for the DGS is shown in blue. |
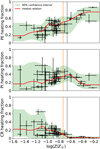 |
Fig. 4 Relative importance of each heating mechanism in the neutral medium with respect to metallicity for the 37 galaxies of our sample. Top: photoelectric effect heating. Middle: photoionization heating. Bottom: cosmic ray heating. The green shaded area indicates the 90% confidence interval computed on the whole sample, with the median relation plotted in red. The black vertical line is the limit above which photoelectric heating dominates (≈22% Z⊙). No PAHs are currently detected in the DGS below the orange vertical line. |
4 Results
4.1 Ionized gas heating processes
In the ionized gas, we expected the main heating mechanism to be photoionization by UV photons (as illustrated for a typical 1D model in Fig. 2). This was confirmed by our models, which show that photoionization accounts for 85% of the total heating at high metallicity and up to ≈100% at low metallicity. The remaining heating is due to the photoelectric effect on grains.
4.2 Neutral gas heating processes
Even though our models account for molecular gas, we limited our study to neutral atomic gas due to a lack of molecular tracers. In the neutral atomic gas, we computed for each galaxy the heating fraction due to the photoelectric effect, photoionization, and CRs, defined as the heating rate of one mechanism integrated over the whole H I region (between cut parameter values 1 and 2, as defined in Sect. 3.2) divided by the total heating rate in the H I region. These heating fractions are shown in Fig. 4.
We found that the photoelectric effect heating fraction increases with metallicity and becomes predominant at metallic- ity above ≈22% Z⊙. Interestingly, this metallicity lies close to the detection limit of PAHs in the DGS at a metallicity of ≈19% Z⊙. The photoionization heating fraction shows no clear trend with metallicity, but it remains significant at all metallicities, even being above 50% for some galaxies. Cosmic rays only heat significantly at metallicities below 1/6 Z⊙, while accounting for only a few percent of the heating at high metallicity.
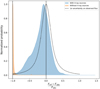 |
Fig. 5 [OIV] 26 µm inferred flux versus observed flux for the DGS, with (blue) and without (orange) X-ray sources. A value of 0 means that the flux is perfectly reproduced, −1 means that no flux is predicted. The dashed line shows the uncertainty distribution on the measured flux. |
4.3 Inferred X-ray luminosities
Figure 5 shows that X-ray sources are necessary to reproduce the observed [OIV] 26 µm flux. Indeed, when removing the X-ray sources from the models, no significant [OIV] 26 µm flux is predicted. When X-ray sources are present, however, the predicted flux is compatible with the observations within 1σ for most of the galaxies. The BPASS stellar SEDs cannot account for this emission, even when taking Wolf-Rayet stars into account. However, this relies on the BPASS stellar model hypotheses, and other results could be achieved using other prescriptions (see, e.g., Lecroq et al. 2023).
The question then is whether the inferred X-ray fluxes in our models are compatible with the observations. We focused only on two bands often used in the literature, 0.3–8 keV (low energy) and 2–10 keV (high energy) since ULXs have already been detected in these two bands in some galaxies of our sample (see Sect. 2.3). We observed in Fig. 6 that despite large uncertainties, all the predicted fluxes in the 0.3–8 keV band are compatible with the observations, even within 1 dex for five galaxies. We verified that the predicted fluxes are not driven by the edges of the grid. In the 2–10 keV band, however, the predicted fluxes are heavily underestimated. We discuss these results further in Sect. 5.4.
5 Discussion
5.1 Photoelectric effect
The increasing trend of the photoelectric heating fraction with metallicity is somewhat expected since the DGR is known to increase with metallicity, and our models do force it to follow the median relation from Galliano et al. (2021). However, with this prescription being constrained from other observations (in particular mid- and far-IR photometry), we expected the photoelectric effect heating fraction not to suffer from large systematic uncertainties. In order to ensure that our results are not biased by the fixed DGR-Z relationship, we examined a subsample of 20 galaxies for which Galliano et al. (2021) measured the DGR. Despite small individual variations, all 20 galaxies fall within the 90% confidence envelop that we computed from the previous runs where the DGR was fixed (see Fig. 4). This holds for the photoelectric effect, photoionization, and CR heating fractions, showing that our results are robust to a change in the DGR.
One possible application of our work is to probe the photoelectric effect heating efficiency on PAHs, which is the fraction of the energy received by the PAHs that goes into ISM heating. An often used observational proxy (e.g., Okada et al. 2013; Berné et al. 2022) is
![Mathematical equation: ${_{{\rm{PAH}}}} = {{[{\rm{CII}}]158\mu {\rm{m}} + [{\rm{OI}}]63\mu {\rm{m}}} \over {{L_{{\rm{PAH}}}} + [{\rm{CII}}]158\mu {\rm{m}} + [{\rm{OI}}]63\mu {\rm{m}}}},$](/articles/aa/full_html/2025/01/aa51284-24/aa51284-24-eq15.png) (6)
(6)
with reported values below 15%, which coincides with the theoretical maximum value calculated in Tielens (2005). However, when applied to low-metallicity galaxies in our sample, values above 15%, and even above 38% for one galaxy, are observed (see Fig. 7), hinting that ϵPAH is not an accurate proxy for the photoelectric effect heating efficiency at low metallicity. This can be explained by the fact that the sum of [CII] 158 µm and [OI] 63 µm traces the total cooling of the gas, which may be heated through various mechanisms. Since ϵPAH is therefore overestimated due to the assumption of a dominant photoelectric effect heating, we can try to use the photoelectric effect heating fraction inferred from our modeling in order to derive a corrected value:
![Mathematical equation: ${_{{\rm{PAH}},{\rm{ corrected }}}} = {{\alpha ([{\rm{CII}}] + [{\rm{OI}}])} \over {{L_{{\rm{PAH}}}} + \alpha ([{\rm{CII}}] + [{\rm{OI}}])}},$](/articles/aa/full_html/2025/01/aa51284-24/aa51284-24-eq16.png) (7)
(7)
with α as the fraction of heating due to the photoelectric effect computed using MULTIGRIS predictions (Fig. 4, top panel). The values of e with and without correction are shown in Fig. 7. The five galaxies with ϵPAH > 15% have ϵPAH,Corrected values dropping below this threshold. We note that while our correction always provides values below 15%, it is biased by the fact that the photoelectric heating fraction in our models accounts not only for PAH heating but also heating on small grains that are not PAHs. While this last component is likely negligible at high metallicity (Berné et al. 2022), it might not be the case anymore at significantly low metallicity. There are indeed clues that smaller, non-PAH grains are present in low-metallicity galaxies due to the fragmentation of big grains by supernovae (Galliano et al. 2018). We cannot exclude that such grains contribute to the photoelectric effect heating, effectively lowering the photoelectric effect efficiency, but our specific study cannot offer a conclusion on this.
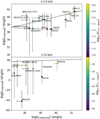 |
Fig. 6 Inferred versus observed X-ray luminosity. Top: 0.3–8 keV. Bottom: 2–10 keV. The dashed line indicates the 1:1 ratio. The color scale shows the logarithm of the correction factor used to calculate the inferred luminosity, as defined in Eq. (5) and shown in Fig. 3. |
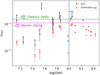 |
Fig. 7 PAH heating efficiency for galaxies in the subsample of the DGS with PAH observations. The observed ϵPAH are shown with black points, the corrected ϵPAH,corrected values are shown in red. The theoretical maximal value of 15% is indicated by the green line and the maximum observed value in Berné et al. (2022) in magenta. The vertical blue line indicates the current limit below which PAH are undetected in the DGS. |
5.2 Cosmic rays
One of the main limitations of the present study is the assumption of a single fixed CR ionization rate in SFGX (6 × 10⁻¹⁶ s−1; see Sect. 3.2). The CR heating fraction is therefore driven by the density of the medium and the depth within the cloud (“cut” parameter). We consider that this CR ionization rate is in fact probably overestimated. Following the prescription from Krumholz et al. (2023)  , with ζtot as the CR ionization rate – based on the SFR and the mass of the neutral gas (H0+H2 measured in Rémy-Ruyer et al. 2014, 2015), we found a median value for the CR ionization rate in the DGS of 3 × 10⁻¹⁷ s−1 (see Fig. 8). Similar values are found by Brugaletta et al. (2024) in magneto-hydrodynamical simulations of low-metallicity galaxies.
Since there is a competition between the ionization from X- rays and CRs in the neutral gas, overestimating the CR heating leads to underestimating the X-ray heating. Although we cannot provide a quantitative value for how much the X-ray heating is actually underestimated, this strengthens the fact that X-rays are a significant, or even dominant, source of heating in the neutral gas at low metallicity. We ran Cloudy models with the CR ionization rate decreased by a factor of 30, which corresponds to the difference between the SFGX CR ionization rate and the DGS median CR ionization rate – the latter was calculated from Krumholz et al. (2023) using the SFR and Mgas from Rémy-Ruyer et al. (2014). The other primary parameters were chosen to match the median values inferred for the DGS. After performing this calculation for six different metallicities, we found that the CR heating fraction decreases by a factor of about 20 for very low metallicity models (1/20 Z⊙) up to 60 for medium metallicity models (1/5 Z⊙). For metallicities above 1/3 Z⊙, the CR heating fraction is negligible when using the low CR ionization rate. For the full metallicity range, the photoelectric effect and photoionization heating fraction do not change significantly between the high CR ionization rate and low CR ionization rate models, showing the same trend with metallicity as in Fig. 4.
The extinction depth of the H+-H0 and H0-H2 transitions does not change significantly between the models with the two CR ionization rates, which implies that the integration over the whole HI region corresponds to the same physical volume and that the test results are indeed meaningful. However, one should keep in mind that changing the CR ionization rate in SFGX is likely to modify the final solution, making it difficult to predict the exact impact of such a change on the final heating fraction. We verified that for metallicities above 1/10 Z⊙, decreasing the CR ionization rate does not impact significantly the intensity of the lines used to constrain the models. However, some line intensities do change significantly for lower metallicity models, implying that the inference should eventually be performed again with an extended grid.
Even when considering these caveats, we wished to understand how the CR heating fraction is constrained.
We found that some line ratios correlate better with the CR heating fraction, especially [CII] 158 µm /[OI] 63 µm and [OI] 145 µm/[OI] 63 µm, as shown in Fig. 9 for the moderately metal-poor galaxies (>1/10 Z⊙), which is the range of metallic- ities where most of the galaxies in our sample lie. Even though the CR heating fraction is linked to the photoelectric effect and photoionization heating fraction, there is no correlation between these line ratios and the photoelectric effect nor the photoionization heating fraction. Moreover, these correlations hold even if X-ray sources are removed from the models and the correlations are observed at every depth of the cloud in the atomic gas. However, the fact that our grid considers a single CR ionization rate – which may be overestimated – somewhat biases these correlations, making it difficult to draw a robust conclusion. We have not identified clear correlations between the photoionization heating fraction and any specific line ratio. For lower metallicities, no correlation is seen between the CR heating fraction and line ratios.
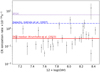 |
Fig. 8 Cosmic ray ionization rate versus Z in the DGS following the prescription from Krumholz et al. (2023). The solid line is the median CR ionization rate, the dashed line is the CR ionization rate used in SFGX, and the dotted line is the galactic CR ionization rate from Indriolo et al. (2007). |
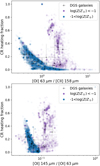 |
Fig. 9 Cosmic ray heating fraction versus [OI] 63 µm/ [CII] 158 µm (top) and [OI] 145 µm/ [OI] 63 µm (bottom). Each point represents a model randomly drawn from the inferred posterior distribution. The global values for each galaxy are overplotted in black. |
5.3 Photoionization
The main caveat regarding the photoionization heating fraction is that we cannot differentiate UV photons (primarily coming from the stellar population continuum) from X-ray photons (primarily coming from X-ray sources associated with the multi-color blackbody prescription) since Cloudy does not track down photons emitted by any given continuum source. Therefore, we are not able to determine the exact contribution of X-ray sources to neutral medium heating. To overcome this limitation, we focused on the best models inferred with MULTIGRIS either with or without X-ray sources and compared them. While we were unable to obtain a quantitative value for the heating rate due to X-ray photons specifically (compared to UV photons), these tests show that all the galaxies are compatible with a higher photoionization heating fraction when X-ray sources are considered, with a median ratio (photoionization heating fraction with X-ray sources)/(photoionization heating fraction without X-ray sources) of 1.7. The results imply that X-rays contribute at least significantly to the neutral medium heating.
5.4 X-ray source properties
Despite an overall agreement between our predicted fluxes and the observations in the 0.3–8 keV band, the predicted values suffer from large uncertainties. These uncertainties come from the two parameters used to derive the flux, namely LX and the correction factor C[0.3−8keV] (defined in Sect. 3.3), which depends on the temperature TX . While LX is well constrained in most of the galaxies, TX is much more uncertain. Moreover, C[0.3–8keV] strongly varies with the temperature, especially at low TX (<5.8 in log), which is the case for most (22) galaxies in our sample. In this temperature range, a rather small uncertainty on TX can lead to a large uncertainty on the predicted flux, making TX the main source of uncertainty in the predicted fluxes.
The fact that TX is not well constrained is mainly due to the lack of tracers with high ionization potentials. The highest ionization potential tracer in our sample is O3+ (55 eV), with additional constraints from Ne4+ (97 eV) via the upper limits on [NeV] 14 µm. This means that we effectively only constrain the low-energy part of the X-ray SED. In our case, however, the X- ray SED is defined by a single source with parameters LX and TX, and we were able to constrain the entire SED simply based on the low-energy part. Nevertheless, we would need high enough energy tracers to provide unambiguous and reliable constraints on TX . To constrain high TX values above 106 K, we would need tracers with significantly higher ionization potentials (≳100 eV). The use of IR coronal lines such as [FeVI] (75 eV) or [SiX] (351 eV), observable with JWST, have been proposed by Cann et al. (2018) to constrain the X-ray SEDs of an active galactic nucleus, and they could be relevant in our study. Sloan Digital Sky Survey observations of optical lines such as [FeVII] (99 eV) or [FeXI] (262 eV) (Reefe et al. 2022) could also prove useful. Unfortunately, no measurements of these lines are available for the DGS. An alternative to using high ionization potential species could be to use species around the ionization front or from the neutral gas instead (Richardson et al. 2022).
Another source of uncertainty in the X-ray flux comparison comes from the X-ray source prescription used in SFGX. While we used an accretion disk (Mitsuda et al. 1984) – often used to represent the low-energy (<2 keV) spectrum of ULXs – such objects are known to display a power-law component at a higher energy (Gladstone et al. 2009; Pintore et al. 2014). This high-energy component is not taken into account in SFGX, which explains why we underestimate the predicted 2–10 keV fluxes (see Fig. 6). New X-ray source models should eventually be implemented in SFGX to account for both the high-energy and low-energy components of the X-ray source SEDs, allowing us to constrain both the 0.3–8 keV and 2–10 keV band fluxes. It is worth noticing that even if the high-energy component is dominant within the 2–8 keV range, it is roughly equal to the accretion disk component within the whole 0.3–8 keV range, making our comparison in this band valid.
We emphasize that the predicted TX is not necessarily the actual physical temperature but rather a parameter of our model for describing the X-ray source SED. In particular, it has been shown that using physical models instead of a power law for the comptonization component can lead to significant differences in TX (Gladstone et al. 2009). In order to infer the actual physical properties of the source, we would need a physical model flexible enough to represent various types of objects (stellar mass black holes, intermediate-mass black holes, active galactic nuclei), such as the models described in Garofali et al. (2024) for ULXs.
It is also important to note that even with a physical model covering the whole 0.3–10 keV range and enough tracers to constrain it, we do not expect a 1:1 relation between the predicted luminosity and the observations. Indeed, we do not infer the intrinsic X-ray luminosity of the source but rather the X-ray luminosity seen on average by the surrounding ISM over a cooling timescale. Line-of-sight effects and time variability of the source are thus expected to produce a scatter in the relation.
6 Conclusion
This paper presents an application of the statistical code MULTIGRIS to a sample of low-metallicity galaxies (DGS; Madden et al. 2013) to study the contribution of the photoelectric effect, photoionization by UV and X-ray photons, and ionization by CRs to the heating of the neutral atomic ISM. We also attempted to predict the intrinsic X-ray flux for galaxies with known X-ray sources. Our main results are the following:
The contribution of photoelectric effect heating to the total heating of the neutral gas increases with metallicity and dominates at high metallicity (>1/8 Z⊙).
Photoionization heating contributes significantly at all metallicities, with a large scatter between individual galaxies. In some cases, it can become the dominant source of heating.
Cosmic ray heating is negligible at high metallicity. At lower metallicity, it becomes an important mechanism but is usually not the dominant one. However, the exact contribution of CRs remains uncertain, since the CR ionization rate is forced to a single value in our models. An extension of SFGX with various CR ionization rates would be necessary to better constrain the impact of CRs on the neutral medium heating, but this is beyond the scope of this paper and intended for future studies.
The single CR ionization rate used in our study is likely overestimated. This implies that the X-ray heating is likely underestimated, which is especially important for low-metallicity galaxies, where the X-ray heating may in fact dominate the total heating.
We find that the heating efficiency of the photoelectric effect on PAHs measured from observational proxies is higher than the theoretical maximal value using the ϵPAH proxy. However, it becomes compatible for all of our galaxies when accounting for the inferred fraction of photoelectric effect heating. This implies that the usual proxy for the PAH heating efficiency must be taken with caution in low-metallicity galaxies.
The luminosity of X-ray sources can be inferred from IR lines of species with high ionization potentials (HII region) and/or of species in the neutral gas. We were able to recover reasonably well the observed 0.3–8 keV fluxes of ULXs in the galaxies of the DGS despite large uncertainties. We determined that uncertainties are dominated by the temperature of the accretion disk and propose potential tracers to better constrain our predicted X-ray fluxes.
A correlation was found between the CR heating fraction and neutral gas line ratios involving [OI] 63 µm, [OI] 145 µm, and [CII] 158 µm for galaxies with a metallicity between 0.08 and 0.3 Z⊙ . However, this correlation is most likely biased by the fact that we used a single CR ionization rate with a value probably overestimated in our grid of models.
The method used in this work offers an interesting perspective to study the gas heating in other types of galaxies, especially at high redshift, since our aim was to disentangle the different ISM phases from an integrated spectrum. Globally, this method is well adapted to high-z observations with ALMA, which include neutral gas tracers such as [CII] 158 µm and [OI] 63 µm as well as potential future far-IR spectroscopic facilities such as PRIMA. Our study suggests that X-ray sources are important contributors to the heating of the star forming gas reservoir and could be useful ingredients to implement in galaxy simulations.
The same method can also be applied to specifically study the X-ray source properties present in low-metallicity galaxies. In particular, it offers a potential way to probe the X-ray spectrum shape by probing only the surrounding ISM emission to characterize X-ray sources without a direct X-ray detection.
Acknowledgements
L.R. gratefully acknowledges funding from the Deutsche Forschungsgemeinschaft (DFG, German Research Foundation) through an Emmy Noether Research Group (grant number CH2137/1-1). C.R. gratefully acknowledges the support of the Elon University Japheth E. Rawls Professorship. This work is supported by the FACE Foundation Transatlantic Research Partnership Fund (award TJF21_053).
Appendix A Agreement between models and observations
In order to characterize how well our models reproduce the observations, we computed for each observed line in the sample the difference between the observed flux and the predicted flux as  (see Fig. A.1). We find that for most of the lines, the predicted flux fall within 3σ of the observation for almost all the galaxies. When plotting the PDF of ∆ for the whole sample, we find that it peaks is within the 3σ area for all the lines except [NIII] 57 µm and H2 12.3 µm. Over the whole sample, 87% of the line fluxes are reproduced at the 3σ level and 55% at the 1σ level.
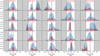 |
Fig. A.1 Probability density function of the difference between observed and predicted lines for the whole sample. The shaded gray area shows the predicted points that fall further than ±3σ from the observation. The blue PDFs shows the concatenated sample while the red histograms shows the distribution of the median flux predicted for each galaxy. |
References
- Berné, O., Foschino, S., Jalabert, F., & Joblin, C. 2022, A&A, 667, A159 [NASA ADS] [CrossRef] [EDP Sciences] [Google Scholar]
- Bialy, S., & Sternberg, A. 2019, ApJ, 881, 160 [NASA ADS] [CrossRef] [Google Scholar]
- Brorby, M., Kaaret, P., & Prestwich, A. 2014, MNRAS, 441, 2346 [NASA ADS] [CrossRef] [Google Scholar]
- Brugaletta, V., Walch, S., Naab, T., et al. 2024, MNRAS submitted [arXiv:2410.19087] [Google Scholar]
- Bykov, S. D., Gilfanov, M. R., & Sunyaev, R. A. 2023, MNRAS, 527, 1962 [NASA ADS] [CrossRef] [Google Scholar]
- Cann, J. M., Satyapal, S., Abel, N. P., et al. 2018, ApJ, 861, 142 [NASA ADS] [CrossRef] [Google Scholar]
- Cann, J. M., Weaver, K. A., Pfeifle, R. W., et al. 2024, ApJ, 961, 178 [NASA ADS] [CrossRef] [Google Scholar]
- Chevance, M., Krumholz, M. R., McLeod, A. F., et al. 2023, ASP Conf. Ser., 534, 1 [NASA ADS] [Google Scholar]
- Cormier, D., Madden, S. C., Lebouteiller, V., et al. 2014, A&A, 564, A121 [NASA ADS] [CrossRef] [EDP Sciences] [Google Scholar]
- Cormier, D., Madden, S. C., Lebouteiller, V., et al. 2015, A&A, 578, A53 [CrossRef] [EDP Sciences] [Google Scholar]
- Cormier, D., Abel, N. P., Hony, S., et al. 2019, A&A, 626, A23 [NASA ADS] [CrossRef] [EDP Sciences] [Google Scholar]
- Dalgarno, A., & McCray, R. A. 1972, ARA&A, 10, 375 [Google Scholar]
- Eldridge, J. J., Stanway, E. R., Xiao, L., et al. 2017, PASA, 34, e058 [Google Scholar]
- Ferland, G. J., Chatzikos, M., Guzmán, F., et al. 2017, Rev. Mex. Astron. Astrofis., 53, 385 [NASA ADS] [Google Scholar]
- Galliano, F. 2022, arXiv e-prints [arXiv:2202.01868] [Google Scholar]
- Galliano, F., Madden, S. C., Tielens, A. G. G. M., Peeters, E., & Jones, A. P. 2008, ApJ, 679, 310 [Google Scholar]
- Galliano, F., Galametz, M., & Jones, A. P. 2018, ARA&A, 56, 673 [Google Scholar]
- Galliano, F., Nersesian, A., Bianchi, S., et al. 2021, A&A, 649, A18 [EDP Sciences] [Google Scholar]
- Garofali, K., Basu-Zych, A. R., Johnson, B. D., et al. 2024, ApJ, 960, 13 [NASA ADS] [CrossRef] [Google Scholar]
- Girichidis, P., Offner, S. S. R., Kritsuk, A. G., et al. 2020, Space Sci. Rev., 216, 68 [NASA ADS] [CrossRef] [Google Scholar]
- Gladstone, J. C., Roberts, T. P., & Done, C. 2009, MNRAS, 397, 1836 [NASA ADS] [CrossRef] [Google Scholar]
- Grier, C. J., Mathur, S., Ghosh, H., & Ferrarese, L. 2011, ApJ, 731, 60 [NASA ADS] [CrossRef] [Google Scholar]
- Gross, A. C., Prestwich, A., & Kaaret, P. 2021, MNRAS, 505, 610 [NASA ADS] [CrossRef] [Google Scholar]
- Hunter, D. A., Elmegreen, B. G., & Madden, S. C. 2024, ARA&A, 62, 113 [NASA ADS] [CrossRef] [Google Scholar]
- Indriolo, N., Geballe, T. R., Oka, T., & McCall, B. J. 2007, ApJ, 671, 1736 [NASA ADS] [CrossRef] [Google Scholar]
- Kaaret, P., & Corbel, S. 2009, ApJ, 697, 950 [NASA ADS] [CrossRef] [Google Scholar]
- Kaaret, P., & Feng, H. 2013, ApJ, 770, 20 [NASA ADS] [CrossRef] [Google Scholar]
- Kaaret, P., Schmitt, J., & Gorski, M. 2011, ApJ, 741, 10 [NASA ADS] [CrossRef] [Google Scholar]
- Kaaret, P., Feng, H., & Roberts, T. P. 2017, ARA&A, 55, 303 [Google Scholar]
- Krumholz, M. R., Crocker, R. M., & Offner, S. S. R. 2023, MNRAS, 520, 5126 [NASA ADS] [CrossRef] [Google Scholar]
- Lebouteiller, V. 2023, arXiv e-prints [arXiv:2309.06876] [Google Scholar]
- Lebouteiller, V., & Ramambason, L. 2022, A&A, 667, A34 [NASA ADS] [CrossRef] [EDP Sciences] [Google Scholar]
- Lebouteiller, V., Barry, D. J., Spoon, H. W. W., et al. 2011, ApJS, 196, 8 [NASA ADS] [CrossRef] [Google Scholar]
- Lebouteiller, V., Barry, D. J., Goes, C., et al. 2015, ApJS, 218, 21 [Google Scholar]
- Lebouteiller, V., Péquignot, D., Cormier, D., et al. 2017, A&A, 602, A45 [NASA ADS] [CrossRef] [EDP Sciences] [Google Scholar]
- Lebouteiller, V., Richardson, C. T., Polimera, M. S., et al. 2024, A&A submitted [arXiv:2412.15860] [NASA ADS] [CrossRef] [EDP Sciences] [Google Scholar]
- Lecroq, M., Charlot, S., Bressan, A., et al. 2023, MNRAS, 527, 9480 [NASA ADS] [CrossRef] [Google Scholar]
- Lehmer, B. D., Eufrasio, R. T., Basu-Zych, A., et al. 2021, ApJ, 907, L17 [CrossRef] [Google Scholar]
- Madden, S. C., Rémy-Ruyer, A., Galametz, M., et al. 2013, PASP, 125, 600 [NASA ADS] [CrossRef] [Google Scholar]
- Madden, S. C., Cormier, D., Hony, S., et al. 2020, A&A, 643, A141 [NASA ADS] [CrossRef] [EDP Sciences] [Google Scholar]
- Meijerink, R., Spaans, M., & Israel, F. P. 2006, ApJ, 650, L103 [Google Scholar]
- Mingozzi, M., Vallini, L., Pozzi, F., et al. 2018, MNRAS, 474, 3640 [NASA ADS] [CrossRef] [Google Scholar]
- Mitsuda, K., Inoue, H., Koyama, K., et al. 1984, PASJ, 36, 741 [NASA ADS] [Google Scholar]
- Okada, Y., Pilleri, P., Berné, O., et al. 2013, A&A, 553, A2 [NASA ADS] [CrossRef] [EDP Sciences] [Google Scholar]
- Ott, J., Walter, F., & Brinks, E. 2005, MNRAS, 358, 1423 [CrossRef] [Google Scholar]
- Otí-Floranes, H., Mas-Hesse, J. M., Jiménez-Bailón, E., et al. 2012, A&A, 546, A65 [NASA ADS] [CrossRef] [EDP Sciences] [Google Scholar]
- Pintore, F., Zampieri, L., Wolter, A., & Belloni, T. 2014, MNRAS, 439, 3461 [Google Scholar]
- Prestwich, A. H., Tsantaki, M., Zezas, A., et al. 2013, ApJ, 769, 92 [NASA ADS] [CrossRef] [Google Scholar]
- Prestwich, A. H., Jackson, F., Kaaret, P., et al. 2015, ApJ, 812, 166 [NASA ADS] [CrossRef] [Google Scholar]
- Péquignot, D. 2008, A&A, 478, 371 [NASA ADS] [CrossRef] [EDP Sciences] [Google Scholar]
- Ramambason, L., Lebouteiller, V., Bik, A., et al. 2022, A&A, 667, A35 [NASA ADS] [CrossRef] [EDP Sciences] [Google Scholar]
- Ramambason, L., Lebouteiller, V., Madden, S. C., et al. 2024, A&A, 681, A14 [NASA ADS] [CrossRef] [EDP Sciences] [Google Scholar]
- Reefe, M., Satyapal, S., Sexton, R. O., et al. 2022, ApJ, 936, 140 [NASA ADS] [CrossRef] [Google Scholar]
- Remillard, R. A., & McClintock, J. E. 2006, ARA&A, 44, 49 [Google Scholar]
- Richardson, C. T., Simpson, C., Polimera, M. S., et al. 2022, ApJ, 927, 165 [NASA ADS] [CrossRef] [Google Scholar]
- Rigopoulou, D., Hurley, P. D., Swinyard, B. M., et al. 2013, MNRAS, 434, 2051 [Google Scholar]
- Rosa González, D., Terlevich, E., Jiménez Bailón, E., et al. 2009, MNRAS, 399, 487 [CrossRef] [Google Scholar]
- Rosenberg, M. J. F., Meijerink, R., Israel, F. P., et al. 2014, A&A, 568, A90 [NASA ADS] [CrossRef] [EDP Sciences] [Google Scholar]
- Rémy-Ruyer, A., Madden, S. C., Galliano, F., et al. 2014, A&A, 563, A31 [Google Scholar]
- Rémy-Ruyer, A., Madden, S. C., Galliano, F., et al. 2015, A&A, 582, A121 [Google Scholar]
- Salvatier, J., Wieckiâ, T. V., & Fonnesbeck, C. 2016, Astrophysics Source Code Library [record ascl:1610.016] [Google Scholar]
- Thuan, T. X., Bauer, F. E., Papaderos, P., & Izotov, Y. I. 2004, ApJ, 606, 213 [NASA ADS] [CrossRef] [Google Scholar]
- Tielens, A. G. G. M. 2005, The Physics and Chemistry of the Interstellar Medium (Cambridge: Cambridge University Press) [Google Scholar]
- Tielens, A. G. G. M., & Hollenbach, D. 1985a, ApJ, 291, 747 [NASA ADS] [CrossRef] [Google Scholar]
- Tielens, A. G. G. M., & Hollenbach, D. 1985b, ApJ, 291, 722 [Google Scholar]
- Vallini, L., Tielens, A. G. G. M., Pallottini, A., et al. 2019, MNRAS, 490, 4502 [CrossRef] [Google Scholar]
- Weingartner, J. C., & Draine, B. T. 2001, ApJS, 134, 263 [CrossRef] [Google Scholar]
- Wolfire, M. G., McKee, C. F., Hollenbach, D., & Tielens, A. G. G. M. 2003, ApJ, 587, 278 [Google Scholar]
- Wolfire, M. G., Hollenbach, D., & McKee, C. F. 2010, ApJ, 716, 1191 [Google Scholar]
- Wolfire, M. G., Vallini, L., & Chevance, M. 2022, ARA&A, 60, 247 [NASA ADS] [CrossRef] [Google Scholar]
All Tables
All Figures
|
Fig. 1 Stellar SEDs with an instantaneous burst age of 1 Myr (black dashed line) and 6 Myr (red dashed line). The gray area represents the spread from the age-metallicity parameter space. The blue area shows the variation of an accretion disk SED when TX is varied (see text). The green and red shaded vertical stripes represent the 0.3–8 keV and 2–10 keV bands. |
| In the text | |
|
Fig. 2 Cooling and heating rate versus depth for the main mechanisms in a typical 1D model (stellar age: 6 Myr, L* = 109 L⊙, n = 2, U = −2, Z = 0.1 Z⊙, LX = 107 L⊙, TX = 106 K). The dashed vertical lines correspond to the cut values 1, 2, and 3. Acronyms: “IScclinH”: hydrogen recombination; “ISrcolH”: net free-bound cooling minus free-free heating; “PE”: photoelectric effect heating; “CR”: cosmic ray heating. |
| In the text | |
|
Fig. 3 Correction factor for different energy bands to obtain the bolometric X-ray luminosity, depending on the temperature of the inner side of the accretion disk as defined in Mitsuda et al. (1984). The inferred PDF of TX for the DGS is shown in blue. |
| In the text | |
|
Fig. 4 Relative importance of each heating mechanism in the neutral medium with respect to metallicity for the 37 galaxies of our sample. Top: photoelectric effect heating. Middle: photoionization heating. Bottom: cosmic ray heating. The green shaded area indicates the 90% confidence interval computed on the whole sample, with the median relation plotted in red. The black vertical line is the limit above which photoelectric heating dominates (≈22% Z⊙). No PAHs are currently detected in the DGS below the orange vertical line. |
| In the text | |
|
Fig. 5 [OIV] 26 µm inferred flux versus observed flux for the DGS, with (blue) and without (orange) X-ray sources. A value of 0 means that the flux is perfectly reproduced, −1 means that no flux is predicted. The dashed line shows the uncertainty distribution on the measured flux. |
| In the text | |
|
Fig. 6 Inferred versus observed X-ray luminosity. Top: 0.3–8 keV. Bottom: 2–10 keV. The dashed line indicates the 1:1 ratio. The color scale shows the logarithm of the correction factor used to calculate the inferred luminosity, as defined in Eq. (5) and shown in Fig. 3. |
| In the text | |
|
Fig. 7 PAH heating efficiency for galaxies in the subsample of the DGS with PAH observations. The observed ϵPAH are shown with black points, the corrected ϵPAH,corrected values are shown in red. The theoretical maximal value of 15% is indicated by the green line and the maximum observed value in Berné et al. (2022) in magenta. The vertical blue line indicates the current limit below which PAH are undetected in the DGS. |
| In the text | |
|
Fig. 8 Cosmic ray ionization rate versus Z in the DGS following the prescription from Krumholz et al. (2023). The solid line is the median CR ionization rate, the dashed line is the CR ionization rate used in SFGX, and the dotted line is the galactic CR ionization rate from Indriolo et al. (2007). |
| In the text | |
|
Fig. 9 Cosmic ray heating fraction versus [OI] 63 µm/ [CII] 158 µm (top) and [OI] 145 µm/ [OI] 63 µm (bottom). Each point represents a model randomly drawn from the inferred posterior distribution. The global values for each galaxy are overplotted in black. |
| In the text | |
|
Fig. A.1 Probability density function of the difference between observed and predicted lines for the whole sample. The shaded gray area shows the predicted points that fall further than ±3σ from the observation. The blue PDFs shows the concatenated sample while the red histograms shows the distribution of the median flux predicted for each galaxy. |
| In the text | |
Current usage metrics show cumulative count of Article Views (full-text article views including HTML views, PDF and ePub downloads, according to the available data) and Abstracts Views on Vision4Press platform.
Data correspond to usage on the plateform after 2015. The current usage metrics is available 48-96 hours after online publication and is updated daily on week days.
Initial download of the metrics may take a while.