Fig. 7
Download original image
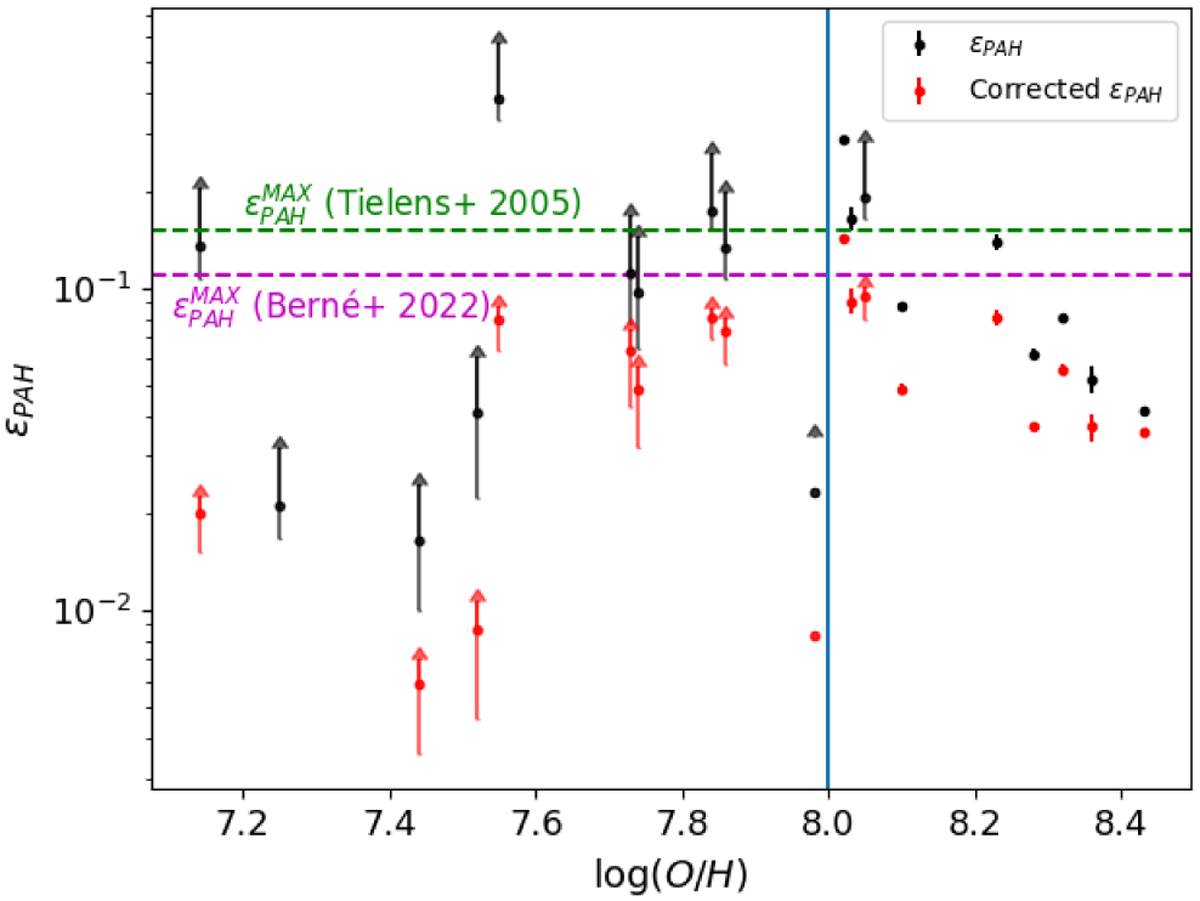
PAH heating efficiency for galaxies in the subsample of the DGS with PAH observations. The observed ϵPAH are shown with black points, the corrected ϵPAH,corrected values are shown in red. The theoretical maximal value of 15% is indicated by the green line and the maximum observed value in Berné et al. (2022) in magenta. The vertical blue line indicates the current limit below which PAH are undetected in the DGS.
Current usage metrics show cumulative count of Article Views (full-text article views including HTML views, PDF and ePub downloads, according to the available data) and Abstracts Views on Vision4Press platform.
Data correspond to usage on the plateform after 2015. The current usage metrics is available 48-96 hours after online publication and is updated daily on week days.
Initial download of the metrics may take a while.