Open Access
Fig. 5
Download original image
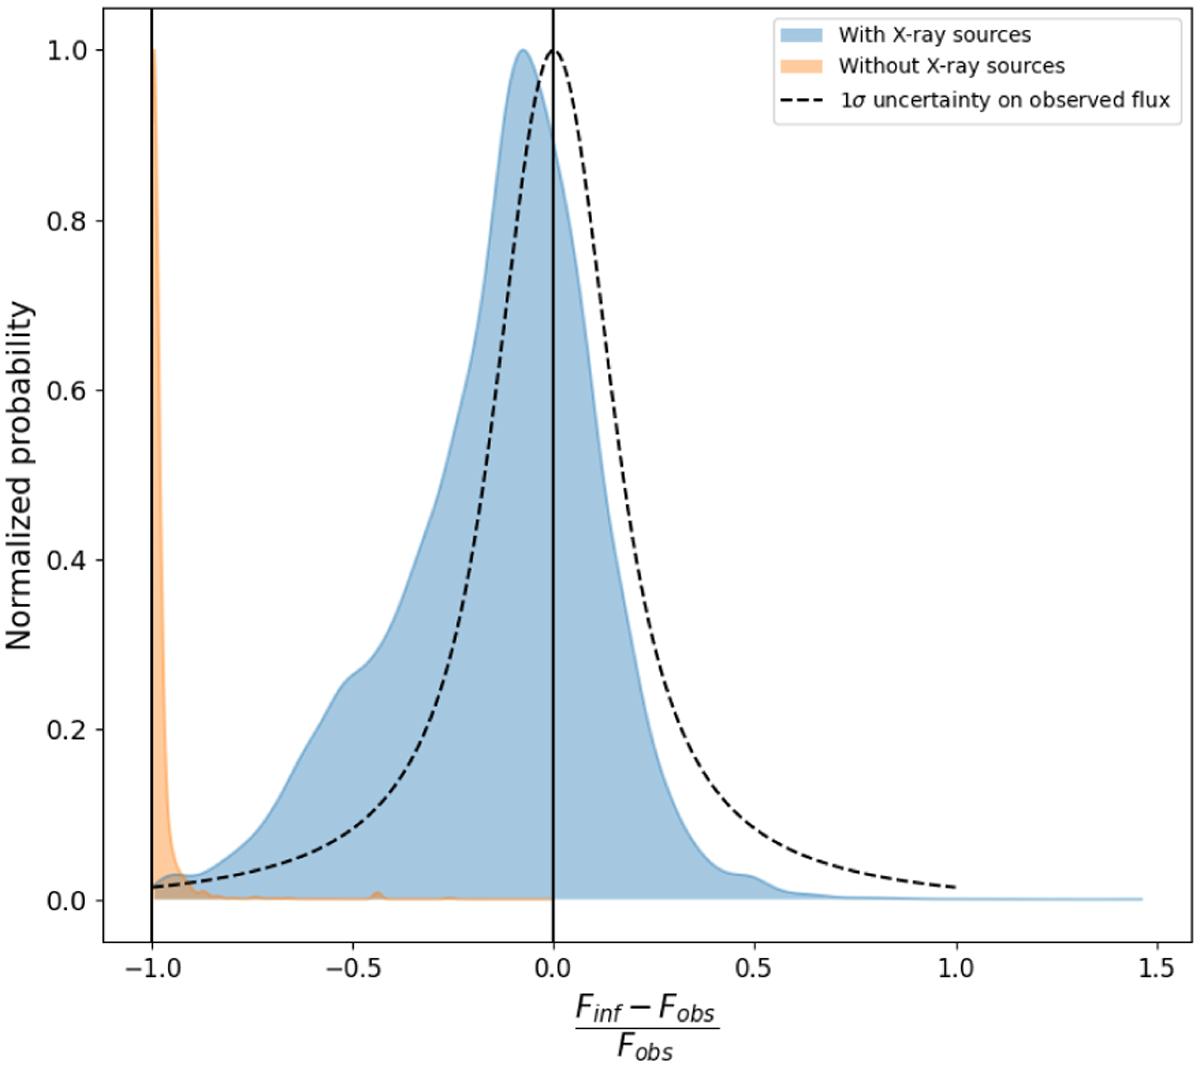
[OIV] 26 µm inferred flux versus observed flux for the DGS, with (blue) and without (orange) X-ray sources. A value of 0 means that the flux is perfectly reproduced, −1 means that no flux is predicted. The dashed line shows the uncertainty distribution on the measured flux.
Current usage metrics show cumulative count of Article Views (full-text article views including HTML views, PDF and ePub downloads, according to the available data) and Abstracts Views on Vision4Press platform.
Data correspond to usage on the plateform after 2015. The current usage metrics is available 48-96 hours after online publication and is updated daily on week days.
Initial download of the metrics may take a while.