Fig. A.1
Download original image
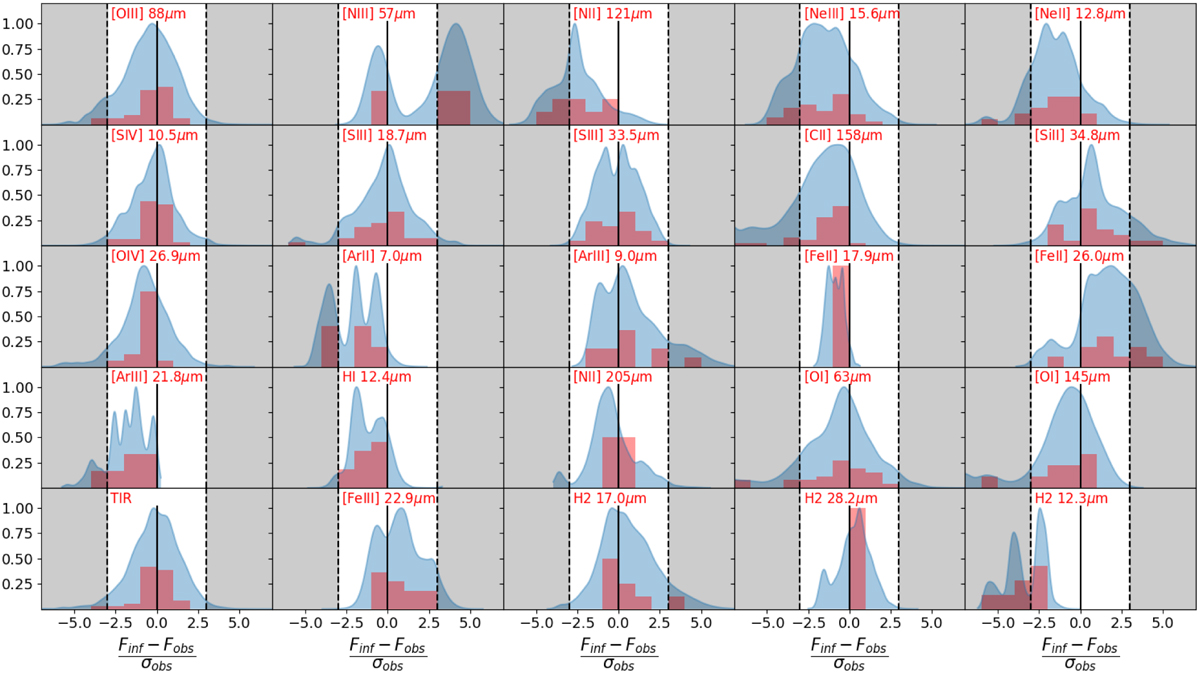
Probability density function of the difference between observed and predicted lines for the whole sample. The shaded gray area shows the predicted points that fall further than ±3σ from the observation. The blue PDFs shows the concatenated sample while the red histograms shows the distribution of the median flux predicted for each galaxy.
Current usage metrics show cumulative count of Article Views (full-text article views including HTML views, PDF and ePub downloads, according to the available data) and Abstracts Views on Vision4Press platform.
Data correspond to usage on the plateform after 2015. The current usage metrics is available 48-96 hours after online publication and is updated daily on week days.
Initial download of the metrics may take a while.