| Issue |
A&A
Volume 693, January 2025
|
|
|---|---|---|
| Article Number | A25 | |
| Number of page(s) | 9 | |
| Section | Extragalactic astronomy | |
| DOI | https://doi.org/10.1051/0004-6361/202450261 | |
| Published online | 23 December 2024 | |
An infrared and far-UV study of jet-induced star formation in the halo of Centaurus A
1
Graduate School of Science, Nagoya University, Furo-cho, Chikusa-ku, Nagoya, Aichi 464-8602, Japan
2
Subaru Telescope, National Astronomical Observatory of Japan, 650 North Aohoku Place, Hilo, HI 96720, USA
3
Institute of Liberal Arts and Sciences, Tokushima University, 1-1 Minami-Jyosanjima, Tokushima-shi, Tokushima 770-8502, Japan
4
Institute of Space and Astronomical Science, Japan Aerospace Exploration Agency, 3-1-1 Yoshinodai, Chuo-ku, Sagamihara Kanagawa 252-5210, Japan
5
Institute of Astronomy, The University of Tokyo, 2-21-1 Osawa, Mitaka, Tokyo 181-0015, Japan
⋆ Corresponding author; This email address is being protected from spambots. You need JavaScript enabled to view it.
Received:
5
April
2024
Accepted:
7
November
2024
Abstract
Centaurus A (Cen A) is the nearest galaxy hosting an active galactic nucleus (AGN), which produces powerful radio and X-ray jets extending to hundreds of kiloparsecs from the center. At 15 kpc northeast (NE) and 12 kpc southwest (SW) in the halo along the jet from the nucleus of Cen A, dust clouds accompanying the Hα emission are detected. For both NE and SW clouds, past studies suggested that star formation may have been induced through interactions between the AGN jet and the surrounding intergalactic media. For these clouds, we performed dust model fitting of infrared (IR) spectral energy distributions (SEDs) created from the archival data of WISE, Spitzer, and Herschel. Then we compare the IR emission properties of the dust clouds with the far-ultraviolet (UV) emission using the archival data of GALEX/FUV. As a result, we find that the interstellar radiation field intensity G0 (and thus the dust temperature) in the NE cloud suggests star formation activity, while that in the SW cloud does not. The local far-UV intensity and G0 in the NE region are significantly larger than those expected for the far-UV radiation originating from the central region of Cen A and its dust-scattered component, respectively. In contrast, the local far-UV intensity and G0 in the SW region are compatible with them. The polycyclic aromatic hydrocarbon (PAH) emission is detected for both NE and SW clouds. The mass abundance ratios of PAH to dust are similar for both clouds and significantly lower than that in the central region of Cen A. We suggest that the dust clouds and the PAHs in the clouds are associated with the broken ring-like structure of H I gas which is thought to be a remnant of the past gas-rich merger and that shocks by the jet responsible for the middle lobe on the north side may have triggered the star formation in the NE cloud.
Key words: ISM: jets and outflows / galaxies: halos / intergalactic medium / galaxies: individual: Centaurus A / galaxies: star formation
© The Authors 2024
 Open Access article, published by EDP Sciences, under the terms of the Creative Commons Attribution License (https://creativecommons.org/licenses/by/4.0), which permits unrestricted use, distribution, and reproduction in any medium, provided the original work is properly cited.
This article is published in open access under the Subscribe to Open model. This email address is being protected from spambots. You need JavaScript enabled to view it. to support open access publication.
1. Introduction
Outflows and relativistic jets originating from active galactic nuclei (AGNs) are expected to affect the star formation in their host galaxies (i.e., AGN feedback). Generally, two opposite scenarios, negative and positive feedback ones, have been proposed so far. In the negative feedback scenario, a large amount of energy released via outflows and jets heats or sweeps cold gas out of their host galaxies to suppress the star formation (e.g., Silk & Rees 1998; McNamara & Nulsen 2007; Fabian 2012). On the other hand, in the positive feedback scenario, shocks driven by AGN jets compress gas to enhance the star formation (e.g., Croft et al. 2006; Silk 2013; Cresci et al. 2015; Carniani et al. 2016).
Centaurus A (Cen A), also known as NGC 5128, is the nearest and well-studied radio galaxy located at a distance of 3.8 ± 0.1 Mpc (Harris et al. 2010). At its center, there is a 5 × 10⁷ M⊙ supermassive black hole (Neumayer 2010), which powers symmetric twin radio lobes extending to ∼5 kpc (i.e., inner lobes) and further up to hundreds of kiloparsecs (i.e., outer lobes). In addition, on the north side from the nucleus, so-called Northern Middle Lobe (NML) exists between the inner and outer lobes at 10 − 40 kpc from the nucleus (Neff et al. 2015). In contrast, there is no apparent radio counterpart to NML at a similar distance on the south side (see Figs. 1 and 8 as discussed later). Morganti et al. (1999) suggested that NML is connected to the northern inner lobe via a large-scale jet which extends from 6 to about 15 kpc from the nucleus. Cen A also hosts a massive disk of dust, gas, and young stars in its central region, which is considered to have been formed as a result of a merger with a small gas-rich disk galaxy in the past (Malin et al. 1983; Quillen et al. 1993; Schiminovich et al. 1994). As shown by the white contours in Fig. 1, in the outside of this disk at a distance 10 − 15 kpc from the nucleus, a broken ring-like structure of an H I cloud is detected from the northeast (NE) to the southwest (SW) of the nucleus (Schiminovich et al. 1994; Oosterloo & Morganti 2005; Struve et al. 2010). The NE and SW ends of the H I cloud are located in the direction of the jet axis in the projected view.
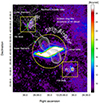 |
Fig. 1. Overview of Cen A and the relevant structure. The background color image is taken from the Herschel 250 μm map. The gray and the white contours show the radio jet structure of Cen A, which is obtained with the Australia Telescope Compact Array (ATCA) at 1.4 GHz (Morganti et al. 1999) and the H I column density in the halo (Auld et al. 2012), respectively. The red squares in the northeast and southwest halos indicate the regions where the Hα emission was detected by Santoro et al. (2016) and Keel et al. (2019), respectively. The yellow squares denote the boundaries of the northeast and the southwest region defined in the present study (e.g., Figs. 2 and 4). The yellow circle corresponds to the aperture region for the SED fitting described in Section 4.2. |
At the positions indicated by the green lines in Fig. 1, two bright filaments are detected along the direction of the radio jet. In the so-called inner filament which is located at 8 kpc NE from the center of Cen A, young stars with ages of 1−4 Myr are detected, suggesting that a radio jet-induced bow shock may have triggered the star formation (Crockett et al. 2012). On the other hand, at about 15 kpc NE from the center of Cen A, the jet passes in the vicinity of the H I cloud where the so-called outer filament is detected, suggesting that jet-cloud interaction may have caused star formation in the outer filament, too (Mould et al. 2000; Rejkuba et al. 2002; Oosterloo & Morganti 2005). Indeed, from the optical observation of the outer filament using Very Large Telescope, Santoro et al. (2015) detected the Hα emission and confirmed that the kinematics of the ionized gas in the part of the outer filament closely matches the ambient H I gas which is considered to have been disturbed through an interaction with the radio jet. Santoro et al. (2016) further investigated a small Hα-emitting region in the outer filament (NE small red square in Fig. 1). According to the emission line ratios of the ionized gas in this region, the overall ionization is thought to be due to the AGN radiation in Cen A, although the embedded star formation also affects the line ratios locally (Santoro et al. 2016). Moreover, Auld et al. (2012) detected a far-infrared (IR) cold dust cloud around the NE part of the H I cloud with Herschel, from which they found that a far-ultraviolet (UV) emission filament revealed by GALEX apparently coexists with the dust cloud at its edge (NE Y-shaped green line in Fig. 1). This far-UV filament may originate from the embedded star formation and be obscured by the dust cloud.
Similarly, at 12 kpc SW from the center of Cen A, Auld et al. (2012) detected a cold dust cloud accompanying H I gas, where there is no evidence for the UV emission. The recent observation by Keel et al. (2019) detected optical emission features including the Hα line which are spatially coincident with the peaks of the SW dust and H I clouds (SW red square in Fig. 1). Keel et al. (2019) indicated that the ratios of these emission lines are consistent with a picture of photoionization in normal H II regions, suggesting that the AGN activity may have enhanced star formation in the SW region as well as in the NE region. Katayama et al. (2020) performed Paβ line mapping of Cen A with SIRIUS (Simultaneous InfraRed Imager of Unbiased Survey) camera on the InfraRed Survey Facility (IRSF) 1.4 m telescope, and found that there is no significant Paβ emission for both of the optical emission regions in the NE and SW. The upper limit of the Paβ/Hα in the NE region is, nevertheless, compatible with that for a typical H II region. On the other hand, the upper limit of the Paβ/Hα in the SW region is significantly lower than that expected for a typical H II region. Hence it was proposed that the Hα fluxes detected in the SW region are likely to originate from the dust scattering of Hα photons which come from the central region of Cen A (Katayama et al. 2020).
Regarding the properties of the halo dust in Cen A studied in the past, only the temperatures of the entire clouds in the NE and SW were obtained, using the Spitzer/MIPS and Herschel/SPIRE far-IR data (Auld et al. 2012). Together with the star-formation rates estimated from the GALEX UV fluxes of the clouds, Auld et al. (2012) suggested that the dominant mechanism of dust heating for both NE and SW clouds could be explained by the starlight of the evolved stellar population within the central region of Cen A, not requiring the contribution of UV from local star-formation within the clouds, if any. Thus they could not find the evidence of the star formation in the IR observations towards the NE cloud although the UV flux suggested it, which might have originated from the lack of spatial resolution in their analysis or the lack of fidelity in some data points of the spectral energy distribution (SED). In this paper, we conduct a better SED fitting using the near- to far-IR (WISE, Spitzer, Herschel/PACS, and Herschel/SPIRE) data and derive spatially-resolved dust temperatures to search for the sign of star formation.
We focus on the emission and scattering properties of the dust in the NE and SW halo clouds of Cen A, which were not discussed in the past study. Through dust model fitting of SEDs, we derive the far-UV radiation field intensities (Section 3.1), which are directly compared to the far-UV intensities at the clouds from the central region of Cen A (Section 3.2). We also estimate the far-UV dust scattering components in the clouds on the basis of the dust properties derived with the SED fitting, which are compared to the local far-UV luminosities measured for the clouds (Section 3.3). Furthermore, we investigate the spatially-resolved dust temperature and PAH distributions for both NE and SW regions by pixel-by-pixel SED fitting to relate them with possible star formation in the halo clouds (Section 3.4).
2. Observations and data analysis
2.1. Infrared observations
For the analysis of SED fitting, we retrieved archival IR data of WISE (Wright et al. 2010), Spitzer (Werner et al. 2004), and Herschel (Pilbratt et al. 2010) for a wavelength range of 3.4 − 500 μm, and conducted aperture photometry. The details of the data used in this study are described below, while the image of each data is shown in Fig. 2.
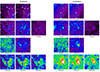 |
Fig. 2. Near- to far-IR images in the northeast (left) and the southwest (right) region of Centaurus A, whose sizes are 400″ × 400″ as denoted by the yellow squares in Fig. 1. For each panel, from top left to bottom right: WISE 3.4, 4.6, 12, and 22 μm, Spitzer 24 μm, Herschel/PACS 70 and 160 μm, Herschel/SPIRE 250, 350, and 500 μm images. The 24, 70, and 160 μm images are smoothed with Gaussian kernels of |


WISE mapped Cen A in the four bands centered at 3.4, 4.6, 12, and 22 μm using 1024 × 1024 arrays with a pixel scale of  . For this study, the observation data were taken from NASA/IPAC Infrared Science Archive (IRSA)1, which were processed for flat-fielding, sky subtraction, and calibration of every frame with a pixel scale of
  .
.
The Spitzer observations of Cen A were carried out using the Multi-Band Imaging Photometer for Spitzer (MIPS) in the 24, 70, and 160 μm bands. We obtained all the data from NASA/IPAC IRSA. However, as noted in Auld et al. (2012), the 70 μm images suffered an unremovable artifact of the observing system, while the 160 μm images missed a part of the NE region where the dust cloud exists. Therefore we used only the 24 μm images from the Spitzer data in this study. For the 70 and 160 μm bands, instead, we utilized the data derived with Photodetector Array Camera and Spectrometer (PACS) on Herschel.
Cen A was observed by Herschel using PACS (70 and 160 μm) and SPIRE (Spectral and Photometric Imaging Receiver; 250, 350, and 500 μm) in a scan-map mode as part of the Very Nearby Galaxy Survey program. We retrieved the observation data from the Herschel Science Archive2 whose observation IDs were 134288855 and 134288663 for the PACS and the SPIRE data, respectively. The PACS 70 and 160 μm maps have the pixel sizes of  and
and  , while the SPIRE 250, 350, and 500 μm maps have those of 6″, 10″, and 14″, respectively.
We performed aperture photometry of all the IR data for the NE and SW regions to measure the near- to far-IR fluxes. As seen in Fig. 2, the SW region appears to be systematically brighter in the far-IR images than the NE region, since the background sky around Cen A is contaminated with the Galactic cirrus from the south to the north (Auld et al. 2012; see also Fig. 1). In order to remove the cirrus contaminations as accurately as possible, we measured the background levels at positions close to the photometry region. For both NE and SW regions, the photometry apertures are defined as a circular region of 130″, while the background regions are defined as an annular region from 1.2 to 2.5 times the aperture radius for both regions. The background regions are used for the analysis in Sections 3.1 and 3.4. Figure 3 shows the photometry fields of the NE and the SW region on the sky-subtracted Herschel 250 μm map, with the contours of the H I column density (magenta) and the GALEX/FUV intensity distribution (white). Auld et al. (2012) concluded that the H I gas shown in Fig. 3 is associated with Cen A because the systemic velocity of the H I gas significantly exceeds that of a Galactic H I cloud toward this direction. The spatial distribution of the dust emission matches well with that of the H I gas, and thus it is assumed that the dust is also associated with Cen A rather than of the Galactic cirrus origin.
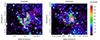 |
Fig. 3. Photometry fields of (left) the northeast and (right) the southwest region of Cen A. The background color images are sky-subtracted Herschel 250 μm maps, where the color scales are the same for both images. The yellow circles are the adopted photometry apertures. The magenta contours show the H I column density, where the contour levels correspond to 1, 5, 10, 15, and 20 × 1020 cm−2 (Auld et al. 2012; the same as in Fig. 1). The white contours show the GALEX/FUV intensity distribution, where the contour levels correspond to 0.0017, 0.002, 0.0035, and 0.006 ct s−1 per 1.5 arcsec2. |
2.2. Ultraviolet observations
The UV images of Cen A were obtained with GALEX (Martin et al. 2005) as part of the GALEX Nearby Galaxies Survey program (Gil de Paz et al. 2007). The observations were carried out in the far-UV (FUV; 1344−1786 Å, λeff = 1516 Å) and the near-UV (NUV; 1771−2831 Å, λeff = 2267 Å) band. We retrieved the pipeline-reduced data of Cen A from the GALEX GR6/GR7 data release3. The data reduction procedure is described in Morrissey et al. (2007). We used the FUV intensity map which covers a  diameter circular field with a pixel scale of
  (Fig. 4).
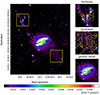 |
Fig. 4. The GALEX/FUV maps of Centaurus A. Left: The overall map of Centaurus A. Yellow squares correspond to the northeast and the southwest region investigated in this paper, as in Fig. 2, for both of which past studies suggest that jet-induced star formation may have occurred therein. Right: Enlarged FUV maps of the northeast (top), the southwest (center), and the central (bottom) region. The yellow contours show the Herschel 250 μm intensity distribution, the levels of which correspond to 9, 10.5, 12, and 18 MJy sr−1. The black ellipse in the bottom panel is the photometry aperture to measure the FUV flux from the central region of Cen A. All the FUV images in the left and right panels are shown after smoothed with a Gaussian kernel of |

The left panel of Fig. 4 shows an overall FUV emission distribution around Cen A where a jet-like structure with some bright emission features can be seen from the center to the NE direction. The top and middle right panels of Fig. 4, which are enlarged FUV maps of the NE and the SW region, respectively, indicate that those FUV filaments coexist with the dust cloud in the NE region, while there are no apparent FUV filamentary features in the SW region but somewhat widely extended emission seen along the inner lobe distribution. As shown in the bottom right panel of Fig. 4, although it is partially attenuated by the dust lane, there is a large amount of the FUV emission from the central region of Cen A, which indicates that active star formation is taking place in the disk.
3. Results
3.1. IR SED fitting
In order to study the emission properties of the dust clouds in the NE and the SW region, we perform IR SED fitting using the DustEM model4 (Compiègne et al. 2011), which allows us to compute the dust emission (and the extinction spectrum) assuming dust temperature distributions under a given grain size distribution and optical properties. The model described in Compiègne et al. (2011) includes the following five dust components: neutral and ionized polycyclic aromatic hydrocarbons (nPAH and iPAH, respectively), small and large amorphous carbons (SamC and LamC, respectively), and amorphous silicates (aSil). Besides the original DustEM model, we added a blackbody function to reproduce the stellar continuum emission in the near-IR, where the temperature was fixed at 5000 K and the amplitude was allowed to vary. The fitting parameters of our model are a mass abundance per hydrogen for each dust component assuming the gas column density of NH = 1 × 1020 cm−2 (YnPAH, YiPAH, YSamC, YLamC, and YaSil), the amplitude of the blackbody function, and the interstellar radiation field (ISRF) parameter G0, which is a scaling factor of the radiation field intensity integrated between 6 and 13 eV relative to the solar neighborhood ISRF. We confirm the significance of the fitting by a chi-square test with a confidence level of 90%.
Figure 5 shows the results of the IR SED-fitting for the dust clouds in the NE and the SW region. The emission properties of the dust clouds derived from the fitting for each region are summarized in Table 1, where the mass abundance ratios of PAH (fPAH), small dust (fsmall), and large dust (flarge) are defined as follows:
Dust emission properties for the northeast and the southwest region of the halo of Cen A.
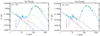 |
Fig. 5. Results of the SED fitting for the northeast and the southwest region of the halo of Cen A. A purple dashed line shows the stellar continuum, while purple, green, and red dotted lines show the continua emitted by the PAH, small dust, and large dust components, respectively (see text for their definitions). Blue circles and red squares represent the fluxes observed in each band and predicted by the model SED, respectively. |
 (1)
(1)
 (2)
(2)
and
 (3)
(3)
where
 (4)
(4)
and
 (5)
(5)
As shown in Table 1, the radiation field parameter G0 of the NE region is significantly larger than that of the SW region, suggesting that the star formation is more active in the NE region. It should be noted, however, that the radiation field intensities obtained in the NE and the SW region may be contaminated by the FUV radiation from the central star-forming disk of Cen A. On the other hand, there is no significant difference in fPAH and flarge between the NE and SW clouds, although it seems that fsmall is not constrained well.
We estimate the dust masses (Mdust) of the NE and the SW region using the following equation:
 (6)
(6)
where Ytot is the dust mass abundance per hydrogen derived from Eq. (5) and mp is the proton mass (1.67 × 10⁻²⁴ g). We adopt the column density of the hydrogen gas, NH, of 1 × 1020 cm−2. Furthermore, Sap is the area of the aperture to create the fitted SEDs. The resultant Mdust of each region is shown in Table 1, which indicates that Mdust in the NE and the SW region is similar to each other within a factor of ∼2.
Auld et al. (2012) conducted the far-IR SED fitting of the NE and SW clouds using a modified blackbody model with the Spitzer 70 and 160 μm data and Herschel 250, 350, and 500 μm data. However, the 70 μm data points were given only as the upper limits because of the limited data quality of the MIPS 70 μm images. As a result of the SED fitting, Auld et al. (2012) found that Mdust are ∼105 M⊙ for both NE and SW clouds, which are similar to our results. Auld et al. (2012) also obtained the dust temperatures of  K and
K and  K for the NE and SW clouds, respectively. In a subsequent section (Section 3.2), we show that these similar dust temperatures between these clouds are inconsistent with different values of G0 found in these clouds. The difference in the dust temperature is most likely due to the difference in the data used for 70 and 160 μm (i.e., Spitzer/MIPS versus Herschel/PACS). The MIPS data suffered the severe artifact and missed a part of the NE cloud as explained in Section 2.1, and therefore the SED fitting using the MIPS data may be insufficient to constrain the dust temperature.
3.2. Estimate of G0 from the GALEX/FUV map
We estimate the G0 value of each region due to the contribution of the FUV radiation from the central region of Cen A using the GALEX/FUV map. First, we measured the FUV flux within an elliptical aperture covering the galactic center, whose radii are 210″ and 70″ for the major and the minor axis, respectively (Fig. 4, bottom right). The background was measured in a box of 10″ × 10″ free of stellar continuum near the aperture region. We converted the units of the measured FUV flux from count s−1 to erg s−1 cm−2 Å−1 using the conversion formula given on the GALEX website5, and further converted to erg s−1 cm−2 by multiplying the effective bandwidth of the GALEX/FUV band.
Secondly, we corrected for the dust extinction. As for the foreground Galactic extinction, we used the attenuation value AFUV = 0.91 mag (Gil de Paz et al. 2007). To approximately correct for the intrinsic extinction due to the dust lane in the center of Cen A, we measure the IR luminosity of the central region, LIR, using the same aperture as used to measure the FUV flux, and assume the following relationship:
 (7)
(7)
where  and
and  are the FUV luminosities corrected and uncorrected for the intrinsic extinction, respectively. We derived LIR from the SED fitting to the Herschel far-IR fluxes using a modified blackbody with the emissivity power-law index β = 2. Since no dust attenuation is assumed in the directions to the NE and SW regions, this would give values near the upper limits.
Thirdly, because of the definition of G0 (see Section 3.1), we converted the FUV flux with the GALEX/FUV bandwidth to the flux over 6 to 13.6 eV by extrapolating the ISRF spectrum estimated by Mathis et al. (1983). The resultant conversion factor is approximately 2.56. Finally, we obtain the corrected FUV luminosity  , and estimate G0center using the following equation:
 (8)
(8)
where c is the speed of light and uISRF ( = 5.29 × 10⁻¹⁴ erg cm−3) is the energy density of the solar neighborhood starlight background over 6 to 13.6 eV which is estimated by Habing (1968). The distance from the center of Cen A to each region, r, is 15 kpc and 12 kpc for the NE and the SW region, respectively. The G0center value of each region thus derived by Eq. (8) is 1.22 and 1.90 for the NE and the SW region, respectively.
In comparison with the G0SED values in Table 1 which is dust-illuminating FUV radiation, G0SED in the NE is significantly larger than G0center. Therefore the result supports that the dust in the NE cloud is further heated by the local FUV emission originating from the NE region and thus the jet-induced star formation has indeed occurred there. On the other hand, G0SED in the SW is compatible with (or slightly smaller than) G0center. Therefore the result indicates that the dust-illuminating FUV radiation mainly originates from the central region of Cen A, but not locally from the SW region in the halo of Cen A.
3.3. Estimate of dust scattering of FUV photons from the central region
As seen in Fig. 4, extended FUV emission is detected from both NE and SW regions. It is therefore likely that some fraction of the FUV radiation which illuminates the dust in the NE and SW halo clouds is scattered by the same dust as that heated to emit the IR radiation. We estimate the dust-scattered FUV luminosities of the NE and the SW region, and compare them with the luminosity in each region measured with the GALEX/FUV map. We assume the dust size distribution and chemical composition proposed in Mathis et al. (1977). Then we obtain the dust-scattered FUV luminosities ( ) of the NE and the SW region using the following equations:
 (9)
(9)
 (10)
(10)
where  is the FUV luminosity of the central region derived from the GALEX/FUV map as described in Section 3.2, but the conversion of the bandwidth to calculate G0 is not necessary here. The distance from the galactic center to the halo region, r, is 15 kpc and 12 kpc for the NE and the SW region, respectively, and Csca is the scattering cross-section. The scattering and the absorption coefficient of a dust grain at a given wavelength (i.e., the GALEX/FUV band), and chemical composition (silicate and graphite), Qsca and Qabs respectively, are taken from Laor & Draine (1993). Furthermore, κabs is the mass absorption coefficient, and Mdust is the dust mass. Here we adopt the Mdust values estimated in Section 3.1 (Table 1).
The dust-scattered FUV luminosities predicted in the above calculation are shown in Table 2. On the other hand, we measure the observed FUV luminosities ( ) of the NE and the SW region by the aperture photometry in the same method as described in Section 2.1, which are also shown in Table 2. Comparing
  and
and  , we find that
  is much higher than
  for the NE region, again indicating that the jet-induced star formation produces the local FUV emission in the NE cloud. By contrast, for the SW region,
  is rather lower than
  , while they are consistent with the power-law index q = −4.5 for the dust size distribution. The spatial coincidence between the FUV and far-IR distributions is better for the SW cloud than for the NE cloud (see the right panels in Fig. 4), which is consistent with the interpretation that the dust-scattered FUV is dominant in the SW cloud. This constraint on the dust size distribution agrees with the previous measurements derived from the Paβ/Hα ratio (Katayama et al. 2020), both of which consistently imply that the dust in the halo clouds may be relatively abundant in the very small grains through dust shattering (Hirashita & Lin 2020).
FUV luminosities expected from dust scattering for the northeast and the southwest region of the halo of Cen A.
Auld et al. (2012) obtained FUV luminosities similar to ours for both NE and SW clouds to calculate the star formation rate (SFR) of 0.0038 and < 2 × 10⁻⁴ M⊙ yr−1 for the NE and SW clouds, respectively. They concluded that the dust emission is unrelated to star formation, at least in the SW cloud, due to the low SFR and the lack of the FUV emission, which is consistent with our result. For the NE cloud, however, considering the emission and scattering properties of the dust in more detail, we find that the dust-heating G0 and the local FUV luminosity cannot be explained by the contribution of the FUV flux from the central region of Cen A alone, as shown above, which positively supports the local star-formation activity.
3.4. Dust luminosity ratio maps
For the purpose of mapping the dust properties of the NE and SW halo clouds more robustly, we create spatially-resolved luminosity ratio maps by pixel-by-pixel SED fitting with a simplified model consisting of emissions from stars, PAHs, warm dust, and cold dust. For the stellar continuum, we use a blackbody function where the temperature is fixed at 5000 K, while the amplitude is allowed to vary. We adopt the Draine & Li (2007) model for the PAH emission, and allow only the amplitude of the PAH emission to vary. For the warm and cold dust components, we adopt modified blackbody models with the emissivity power-law index β = 2, where the temperatures are constrained within ranges of 45 ± 5 K and 15 ± 5 K for the warm and cold dust, respectively, while the amplitudes are allowed to vary.
Prior to performing the SED fitting, we removed the background from the 3.4 − 500 μm images using the values estimated with the photometry described in Section 2.1. Besides, we rebinned all the images with a pixel scale of 14″ commonly, which is the pixel size of the Herschel 500 μm image. Then we performed the pixel-by-pixel SED fitting to derive the luminosities of the PAH, the warm dust and the cold dust emission for every pixel to construct the maps of the warm to cold dust luminosity ratio (Lw/Lc) and the PAH to total dust luminosity ratio (LPAH/Ltot), where Ltot = LPAH + Lw + Lc.
Figures 6 and 7 show the resultant Lw/Lc and LPAH/Ltot maps, respectively, for the NE and the SW region of Cen A. For the NE region, the Lw/Lc ratio distribution roughly corresponds to the GALEX/FUV intensity distribution, indicating that the dust in the cloud is heated by the on-going star formation activity that intensifies the FUV radiation. On the other hand, for the SW region, the Lw/Lc distribution shows no apparent correspondence with the GALEX/FUV distribution, both of which have no clear peaks, thus indicating no star-formation activity. Regarding the LPAH/Ltot maps in Fig. 7, the PAH emission intensities are enhanced in the directions toward which the dust clouds are present as shown by the Herschel 250 μm intensity distribution for both of the NE and the SW region. Hence both clouds contain appreciable amounts of PAHs. In other words, it is confirmed that the PAH emission does not necessarily trace the star formation activity in the case of the SW cloud.
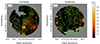 |
Fig. 6. Warm and cold dust luminosity ratio maps for (left) the northeast and (right) the southwest region in the halo of Cen A. The green contours show the GALEX/FUV intensity distribution, where the contours correspond to the levels of 0.00155, 0.002, 0.0035, and 0.006 ct s−1 per 1.5 arcsec2 and 0.0015, 0.00155, 0.0017, and 0.00185 ct s−1 per 1.5 arcsec2 for the northeast and the southwest region, respectively. The yellow contours show the Herschel 250 μm intensity distribution, where the contours correspond to the levels of 9, 10.5, 12, and 18 MJy sr−1. |
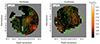 |
Fig. 7. PAH and total dust luminosity ratio maps for (left) the northeast and (right) the southwest region in the halo of Cen A. The contours are the same as in Fig. 6. |
4. Discussion
4.1. Difference between the northeast and southwest clouds
The SED fitting result (Table 1) and the dust luminosity ratio maps (Fig. 6) clearly indicate on-going star formation in the NE halo cloud and no star formation activity in the SW halo cloud, although both clouds are located at a similar distance of ∼10 kpc from the center of Cen A. The results support the interpretation on the origin of the Hα emission from the SW (i.e., scattering of the Hα photons from the galaxy in the previous study; Katayama et al. 2020). The difference could be explained by difference in the environments between the NE and the SW region; one possibility might be difference in the amount of interstellar and intergalactic media (ISM and IGM) in each region. Charmandaris et al. (2000), however, found that the masses of H I gas are 2.14 × 10⁷ M⊙ and 2.17 × 10⁷ M⊙ for the NE and SW clouds, respectively, and thus comparable to each other. The dust masses obtained in the present study also show similar values between the NE and SW clouds as shown in Table 1, and therefore the dust-to-gas mass ratios are similar between the NE and the SW cloud, too. Hence this possibility is not likely.
Another possibility to explain the difference between the NE and the SW region would be difference in the jet structure of Cen A. The left panel of Fig. 8 shows a full view of the radio jet structure of Cen A, which was observed by Murchison Widefield Array (MWA, Tingay et al. 2013) at a central frequency of 200 MHz. As shown in Fig. 8, in the NE region, the inner lobe and Northern Middle Lobe (NML) extend to ∼7 kpc and ∼10 − 40 kpc, respectively, from the center of Cen A (Neff et al. 2015). The red circles in Fig. 8 show the regions we study in the present paper. The NE region is located in the interface between the inner lobe and NML. In contrast, in the SW region, the inner lobe extends to ∼5.5 kpc from the center, but there is no apparent jet structure corresponding to NML at the position of the SW red circle in Fig. 8. Hence the prominent difference in the environments between the NE and the SW region is whether the middle lobe structure is present (NE) or absent (SW). Therefore it may be shocks by the jet which produced NML that have triggered the star formation in the NE cloud.
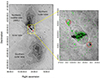 |
Fig. 8. Radio jet structure in the halo of Cen A. Left: The background image is the MWA 200 MHz map. The contours correspond to the levels of 0.3, 0.5, 0.7, 1.0, 1.5, 2, 10, and 50 Jy/beam. The red circles correspond to the aperture region for the SED fitting in our study. Right: The background image is the Herschel 250 μm map. The green and the white contours show the GALEX/FUV map (as shown in Fig. 3) and the radio jet structure of Cen A as shown in the left panel, respectively. The red circles are the same with those in the left panel. |
Regarding the time elapsed after the jet compression of the NE cloud, it should be 0.1 − 10 Myr considering the expansion of NML of ∼40 kpc traveled with the light speed and the lifetime of the synchrotron radiation in NML (Neff et al. 2015), the range of which covers typical time scales for star formation (i.e., 1 − 10 Myr) as well as the ages of 1 − 4 Myr for the young stars in the NE region (Crockett et al. 2012). On the other hand, the jet that has produced the inner lobe does not appear to reach and thus may have not yet exerted any influence on the SW cloud (and the NE cloud, either).
4.2. Origins of the dust in the northeast and southwest regions
To compare the properties of the dust in the halo with those in the central region of Cen A, we perform the SED fitting for the central region of Cen A using the same method as described in Section 2.1. Here, we add the Spitzer 8 μm data, which are available only for the central region, to the SED fitting. The photometry aperture and the background region are defined as a circular region of 450″ and an annular region from 500″ to 600″, respectively.
Figure 9 shows the result of the SED fitting, while the properties of the dust emission derived from the fitting are summarized in Table 3. Comparing Tables 1 and 3, fPAH in the central region of Cen A, which is close to the value typical of the ISM in our Galaxy (∼4.6%; Li & Draine 2001; Weingartner & Draine 2001; Chastenet et al. 2019), is significantly higher than those in the NE and the SW region. Generally, fPAH correlates with the metallicity because, in the low metallicity environments, the shielding of dust grains is reduced and then PAHs are expected to be photodissociated by the strong UV radiation. For example, Smith et al. (2007) found that the PAH intensity is suppressed in galaxies with low metallicities. The metallicity tends to increase as a galaxy evolves, and therefore when fPAH takes a small value, the galaxy is assumed to be in a relatively early stage of evolution.
Properties of the dust emission for the central region of Cen A.
Since both the NE and SW clouds contain appreciable amounts of dust and PAHs, they cannot be of primordial gas origins. Given that fPAH in the clouds are lower than that in the central region of Cen A, the PAHs are likely to have been produced in the host galaxy and ejected at an early evolutionary stage of the galaxy. Since the dust-to-gas mass ratios (Section 4.1) and fPAH are similar between the NE and SW clouds, both clouds are likely to be of the same origin. Judging from the spatial correspondence as seen in Fig. 1 as well as the lower fPAH, we suggest that those clouds, and thus the dust and the PAHs therein, are associated with the broken ring-like structure of H I gas which is thought to be a remnant of the past gas-rich merger (Struve et al. 2010) that has triggered the star formation in the central region of Cen A.
5. Conclusions
We have performed dust model fitting to the near- to far-IR SED of Cen A created from the archival data of WISE, Spitzer, and Herschel in order to study jet-induced star formation in the NE and SW clouds in the halo of Cen A. We have also compared the IR emission properties of the NE and SW dust clouds with the far-UV emission using the archival data of GALEX/FUV.
Based on the interstellar radiation field intensity G0 derived by the IR SED fitting, we find that the NE halo cloud indicates active star formation, while the SW halo cloud does not. For the NE cloud, the local far-UV intensity and G0 are significantly larger than those estimated from the far-UV radiation originating from the star-forming disk in the central region of Cen A. These results consistently support that the jet-induced star formation have indeed occurred in the NE halo cloud. On the other hand, for the SW cloud, G0 agrees with that from the central region of Cen A.
Moreover, the local far-UV intensity detected in the SW cloud can be explained by scattering of the far-UV radiation from the central region by the dust in the SW cloud. Judging from the fact that the major difference in the environments between the NE and the SW region is whether a middle lobe structure is present (NE) or absent (SW), it may be shocks by the jet which produced NML that have triggered the star formation in the NE cloud.
For both NE and SW clouds, the mass abundance ratios of the PAH to the dust (fPAH) and the dust-to-gas mass ratios are comparable to each other, indicating that they are likely of the same origin. In contrast, fPAH for both clouds are significantly lower than that in the central region of Cen A. We suggest that the dust and the PAHs in the clouds originate from a remnant of the past gas-rich merger that has triggered the star formation in the central region of Cen A.
Acknowledgments
We thank the referee for giving us useful comments. This work is based on observations made with Herschel, which is an ESA space observatory with science instruments provided by European-led Principal Investigator consortia and with important participation from NASA. Wide-field Infrared Survey Explorer is a joint project of the University of California, Los Angeles, and the Jet Propulsion Laboratory/California Institute of Technology, funded by the NASA. Spitzer Space Telescope is operated by the California Institute of Technology for NASA under NASA contract 1407. Galaxy Evolution Explorer was operated for NASA by the California Institute of Technology under NASA contract NAS5-98034.
References
- Auld, R., Smith, M. W. L., Bendo, G., et al. 2012, MNRAS, 420, 1882 [NASA ADS] [CrossRef] [Google Scholar]
- Carniani, S., Marconi, A., Maiolino, R., et al. 2016, A&A, 591, A28 [NASA ADS] [CrossRef] [EDP Sciences] [Google Scholar]
- Charmandaris, V., Combes, F., & van der Hulst, J. M. 2000, A&A, 356, L1 [NASA ADS] [Google Scholar]
- Chastenet, J., Sandstrom, K., Chiang, I.-D., et al. 2019, ApJ, 876, 62 [NASA ADS] [CrossRef] [Google Scholar]
- Compiègne, M., Verstraete, L., Jones, A., et al. 2011, A&A, 525, A103 [Google Scholar]
- Cresci, G., Marconi, A., Zibetti, S., et al. 2015, A&A, 582, A63 [NASA ADS] [CrossRef] [EDP Sciences] [Google Scholar]
- Crockett, R. M., Shabala, S. S., Kaviraj, S., et al. 2012, MNRAS, 421, 1603 [NASA ADS] [CrossRef] [Google Scholar]
- Croft, S., van Breugel, W., de Vries, W., et al. 2006, ApJ, 647, 1040 [NASA ADS] [CrossRef] [Google Scholar]
- Draine, B. T., & Li, A. 2007, ApJ, 657, 810 [CrossRef] [Google Scholar]
- Fabian, A. C. 2012, ARA&A, 50, 455 [Google Scholar]
- Gil de Paz, A., Boissier, S., Madore, B. F., et al. 2007, ApJS, 173, 185 [Google Scholar]
- Habing, H. J. 1968, Bull. Astron. Inst. Neth., 19, 421 [Google Scholar]
- Harris, G. L. H., Rejkuba, M., & Harris, W. E. 2010, PASA, 27, 457 [NASA ADS] [CrossRef] [Google Scholar]
- Hirashita, H., & Lin, C.-Y. 2020, Planet. Space Sci., 183, 104504 [Google Scholar]
- Katayama, R., Kaneda, H., Kokusho, T., et al. 2020, PASJ, 72, 88 [Google Scholar]
- Keel, W. C., Banfield, J. K., Medling, A. M., & Neff, S. G. 2019, AJ, 157, 66 [NASA ADS] [CrossRef] [Google Scholar]
- Laor, A., & Draine, B. T. 1993, ApJ, 402, 441 [NASA ADS] [CrossRef] [Google Scholar]
- Li, A., & Draine, B. T. 2001, ApJ, 554, 778 [Google Scholar]
- Malin, D. F., Quinn, P. J., & Graham, J. A. 1983, ApJ, 272, L5 [CrossRef] [Google Scholar]
- Martin, D. C., Fanson, J., Schiminovich, D., et al. 2005, ApJ, 619, L1 [Google Scholar]
- Mathis, J. S., Rumpl, W., & Nordsieck, K. H. 1977, ApJ, 217, 425 [Google Scholar]
- Mathis, J. S., Mezger, P. G., & Panagia, N. 1983, A&A, 128, 212 [NASA ADS] [Google Scholar]
- McNamara, B. R., & Nulsen, P. E. J. 2007, ARA&A, 45, 117 [NASA ADS] [CrossRef] [Google Scholar]
- Morganti, R., Killeen, N. E. B., Ekers, R. D., & Oosterloo, T. A. 1999, MNRAS, 307, 750 [NASA ADS] [CrossRef] [Google Scholar]
- Morrissey, P., Conrow, T., Barlow, T. A., et al. 2007, ApJS, 173, 682 [Google Scholar]
- Mould, J. R., Ridgewell, A., Gallagher, J. S., et al. 2000, ApJ, 536, 266 [NASA ADS] [CrossRef] [Google Scholar]
- Neff, S. G., Eilek, J. A., & Owen, F. N. 2015, ApJ, 802, 88 [NASA ADS] [CrossRef] [Google Scholar]
- Neumayer, N. 2010, PASA, 27, 449 [NASA ADS] [CrossRef] [Google Scholar]
- Oosterloo, T. A., & Morganti, R. 2005, A&A, 429, 469 [NASA ADS] [CrossRef] [EDP Sciences] [Google Scholar]
- Pilbratt, G. L., Riedinger, J. R., Passvogel, T., et al. 2010, A&A, 518, L1 [NASA ADS] [CrossRef] [EDP Sciences] [Google Scholar]
- Quillen, A. C., Graham, J. R., & Frogel, J. A. 1993, ApJ, 412, 550 [NASA ADS] [CrossRef] [Google Scholar]
- Rejkuba, M., Minniti, D., Courbin, F., & Silva, D. R. 2002, ApJ, 564, 688 [NASA ADS] [CrossRef] [Google Scholar]
- Santoro, F., Oonk, J. B. R., Morganti, R., & Oosterloo, T. 2015, A&A, 574, A89 [NASA ADS] [CrossRef] [EDP Sciences] [Google Scholar]
- Santoro, F., Oonk, J. B. R., Morganti, R., Oosterloo, T. A., & Tadhunter, C. 2016, A&A, 590, A37 [NASA ADS] [CrossRef] [EDP Sciences] [Google Scholar]
- Schiminovich, D., van Gorkom, J. H., van der Hulst, J. M., & Kasow, S. 1994, ApJ, 423, L101 [NASA ADS] [CrossRef] [Google Scholar]
- Silk, J. 2013, ApJ, 772, 112 [Google Scholar]
- Silk, J., & Rees, M. J. 1998, A&A, 331, L1 [NASA ADS] [Google Scholar]
- Smith, J. D. T., Draine, B. T., Dale, D. A., et al. 2007, ApJ, 656, 770 [Google Scholar]
- Struve, C., Oosterloo, T. A., Morganti, R., & Saripalli, L. 2010, A&A, 515, A67 [NASA ADS] [CrossRef] [EDP Sciences] [Google Scholar]
- Tingay, S. J., Goeke, R., Bowman, J. D., et al. 2013, PASA, 30, e007 [Google Scholar]
- Weingartner, J. C., & Draine, B. T. 2001, ApJ, 548, 296 [Google Scholar]
- Werner, M. W., Roellig, T. L., Low, F. J., et al. 2004, ApJS, 154, 1 [NASA ADS] [CrossRef] [Google Scholar]
- Wright, E. L., Eisenhardt, P. R. M., Mainzer, A. K., et al. 2010, AJ, 140, 1868 [Google Scholar]
All Tables
Dust emission properties for the northeast and the southwest region of the halo of Cen A.
FUV luminosities expected from dust scattering for the northeast and the southwest region of the halo of Cen A.
All Figures
|
Fig. 1. Overview of Cen A and the relevant structure. The background color image is taken from the Herschel 250 μm map. The gray and the white contours show the radio jet structure of Cen A, which is obtained with the Australia Telescope Compact Array (ATCA) at 1.4 GHz (Morganti et al. 1999) and the H I column density in the halo (Auld et al. 2012), respectively. The red squares in the northeast and southwest halos indicate the regions where the Hα emission was detected by Santoro et al. (2016) and Keel et al. (2019), respectively. The yellow squares denote the boundaries of the northeast and the southwest region defined in the present study (e.g., Figs. 2 and 4). The yellow circle corresponds to the aperture region for the SED fitting described in Section 4.2. |
| In the text | |
|
Fig. 2. Near- to far-IR images in the northeast (left) and the southwest (right) region of Centaurus A, whose sizes are 400″ × 400″ as denoted by the yellow squares in Fig. 1. For each panel, from top left to bottom right: WISE 3.4, 4.6, 12, and 22 μm, Spitzer 24 μm, Herschel/PACS 70 and 160 μm, Herschel/SPIRE 250, 350, and 500 μm images. The 24, 70, and 160 μm images are smoothed with Gaussian kernels of |
| In the text | |
|
Fig. 3. Photometry fields of (left) the northeast and (right) the southwest region of Cen A. The background color images are sky-subtracted Herschel 250 μm maps, where the color scales are the same for both images. The yellow circles are the adopted photometry apertures. The magenta contours show the H I column density, where the contour levels correspond to 1, 5, 10, 15, and 20 × 1020 cm−2 (Auld et al. 2012; the same as in Fig. 1). The white contours show the GALEX/FUV intensity distribution, where the contour levels correspond to 0.0017, 0.002, 0.0035, and 0.006 ct s−1 per 1.5 arcsec2. |
| In the text | |
|
Fig. 4. The GALEX/FUV maps of Centaurus A. Left: The overall map of Centaurus A. Yellow squares correspond to the northeast and the southwest region investigated in this paper, as in Fig. 2, for both of which past studies suggest that jet-induced star formation may have occurred therein. Right: Enlarged FUV maps of the northeast (top), the southwest (center), and the central (bottom) region. The yellow contours show the Herschel 250 μm intensity distribution, the levels of which correspond to 9, 10.5, 12, and 18 MJy sr−1. The black ellipse in the bottom panel is the photometry aperture to measure the FUV flux from the central region of Cen A. All the FUV images in the left and right panels are shown after smoothed with a Gaussian kernel of |
| In the text | |
|
Fig. 5. Results of the SED fitting for the northeast and the southwest region of the halo of Cen A. A purple dashed line shows the stellar continuum, while purple, green, and red dotted lines show the continua emitted by the PAH, small dust, and large dust components, respectively (see text for their definitions). Blue circles and red squares represent the fluxes observed in each band and predicted by the model SED, respectively. |
| In the text | |
|
Fig. 6. Warm and cold dust luminosity ratio maps for (left) the northeast and (right) the southwest region in the halo of Cen A. The green contours show the GALEX/FUV intensity distribution, where the contours correspond to the levels of 0.00155, 0.002, 0.0035, and 0.006 ct s−1 per 1.5 arcsec2 and 0.0015, 0.00155, 0.0017, and 0.00185 ct s−1 per 1.5 arcsec2 for the northeast and the southwest region, respectively. The yellow contours show the Herschel 250 μm intensity distribution, where the contours correspond to the levels of 9, 10.5, 12, and 18 MJy sr−1. |
| In the text | |
|
Fig. 7. PAH and total dust luminosity ratio maps for (left) the northeast and (right) the southwest region in the halo of Cen A. The contours are the same as in Fig. 6. |
| In the text | |
|
Fig. 8. Radio jet structure in the halo of Cen A. Left: The background image is the MWA 200 MHz map. The contours correspond to the levels of 0.3, 0.5, 0.7, 1.0, 1.5, 2, 10, and 50 Jy/beam. The red circles correspond to the aperture region for the SED fitting in our study. Right: The background image is the Herschel 250 μm map. The green and the white contours show the GALEX/FUV map (as shown in Fig. 3) and the radio jet structure of Cen A as shown in the left panel, respectively. The red circles are the same with those in the left panel. |
| In the text | |
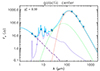 |
Fig. 9. Same as Fig. 5, but for the central region of Cen A. |
| In the text | |
Current usage metrics show cumulative count of Article Views (full-text article views including HTML views, PDF and ePub downloads, according to the available data) and Abstracts Views on Vision4Press platform.
Data correspond to usage on the plateform after 2015. The current usage metrics is available 48-96 hours after online publication and is updated daily on week days.
Initial download of the metrics may take a while.